Abstract
Sleep apnea is associated with hypertension. The mechanisms contributing to a sustained increase in mean arterial pressure (MAP) even during normoxic awake-state remain unknown. Rats exposed to chronic intermittent hypoxia for 7 days, a model of the hypoxemia associated with sleep apnea, exhibit sustained increases in MAP even during the normoxic dark phase. Activation of the renin-angiotensin system (RAS) has been implicated in chronic intermittent hypoxia (CIH) hypertension. Since the subfornical organ (SFO) serves as a primary target for the central actions of circulating ANG II, we tested the effects of ANG II type 1a receptor (AT1aR) knockdown in the SFO on the sustained increase in MAP in this CIH model. Adeno-associated virus carrying green fluorescent protein (GFP) and small-hairpin RNA against either AT1aR or a scrambled control sequence (SCM) was stereotaxically injected in the SFO of rats. After recovery, MAP, heart rate, respiratory rate, and activity were continuously recorded using radiotelemetry. In the normoxic groups, the recorded variables did not deviate from the baseline values. Both CIH groups exhibited significant increases in MAP during CIH exposures (P < 0.05). During the normoxic dark phase in the CIH groups, only the SCM-injected group exhibited a sustained increase in MAP (P < 0.05). The AT1aR-CIH group showed significant decreases in FosB/ΔFosB staining in the median preoptic nucleus and the paraventricular nuclei of the hypothalamus compared with the SCM-CIH group. Our data indicate that AT1aRs in the SFO are critical for the sustained elevation in MAP and increased FosB/ΔFosB expression in forebrain autonomic nuclei associated with CIH.
Keywords: angiotensin receptor, subfornical organ, chronic intermittent hypoxia, obstructive sleep apnea, AT1aR
sleep apnea (SA) is increasingly being recognized as a cause of neurogenic and treatment-resistant hypertension (12, 19, 32, 37, 52). SA is associated with a sustained increase in sympathetic nerve activity (SNA) and mean arterial pressure (MAP) even during periods of wakefulness and normoxia (4, 33). Animal models of chronic intermittent hypoxia (CIH), such as the one introduced by Fletcher at al. (17), produce cardiovascular sequelae similar to sleep apnea (11). Together, it appears that CIH episodes lead to pathophysiological adaptations that may generate and sustain a heightened basal MAP, which is partially dependent on increased SNA.
The renin-angiotensin system (RAS) is activated during CIH (11, 16, 54), and it contributes to CIH hypertension (11, 16). For example, in rats exposed to CIH, peripheral administration of losartan, an angiotensin II (ANG II) type 1 receptor (AT1R) antagonist, has been shown to prevent the increase in MAP (14, 16, 18). ANG II is a major effector peptide of the RAS (21). Most of the physiological actions of ANG II are mediated thought its actions on AT1R (10, 51). AT1R has two subtypes, type a (AT1aR) and type b (AT1bR), that share 94% sequence homology (22, 24). ANG II has both peripheral and central effects, and subsequent studies have demonstrated that ANG II may have multiple sites of action that contribute to CIH hypertension. ANG II has been shown to have direct effects on chemoreceptors (1), and losartan treatment attenuates the effects of CIH on chemoreflex sensitivity (28). In addition, endothelial dysfunction associated with CIH is also prevented by losartan (29). Other studies have shown that ANG II may also have central effects that support CIH hypertension (9, 26). The central actions of circulating ANG II are mediated by circumventricular organs, such as the subfornical organ (SFO), which lack a functional blood-brain-barrier (13, 30). ANG II actions on the SFO are known to promote drinking behavior (31, 45) and salt appetite (53). In addition, the SFO has also been shown to participate in ANG II-dependent hypertension (23, 55), and we previously observed that the SFO may be chronically activated during CIH (25). On the basis of these observations, we tested whether the SFO, as an important site of action for peripheral ANG II, is involved in CIH hypertension.
In this study, we hypothesized that knockdown of AT1aR in SFO will prevent sustained increase in MAP associated with CIH. To test this hypothesis, we utilized recombinant adeno-associated virus (AAV) vectors, which are highly neuron specific (3), to deliver small-hairpin RNA (shRNA) to silence the gene encoding for AT1aR in the SFO.
METHODS
Animals
All experiments were conducted according to National Institutes of Health guidelines and were approved by the Institutional Animal Care and Use Committee at the University of North Texas Health Science Center at Fort Worth. Adult male Sprague-Dawley rats (250–300 g body wt; Charles River) were individually housed in a temperature-controlled room on a 12:12-h light-dark cycle with light onset at 0700. Food and water were provided ad libitum except where indicated in specific experimental protocols. All surgeries were performed using aseptic techniques. To prevent infection and postoperative pain, each rat was treated with an antibiotic (procaine penicillin G, 30,000 U sc) and carprofen (Rimadyl, 2 mg po).
Measurements of Plasma Renin Activity
Separate groups of rats were used to confirm that the CIH protocol used in the present study is associated with increased plasma renin activity (PRA) as has been reported in other CIH models (16, 54). Rats were exposed to 1 day or 7 days of CIH or normoxia. On the morning following the last CIH exposure, each rat was anesthetized with thiobutabarbital (Inactin, 100 mg/kg ip, Sigma-Aldrich, St. Louis, MO) and decapitated. Trunk blood was collected in chilled centrifuge tubes containing EDTA (1 mg/ml). The blood was centrifuged at 10,000 g for 10 min at 4°C. Two milliliters of plasma was removed from each sample, placed in a conical centrifuge tube, and stored in an ultracold freezer (−80°C) until it was shipped on dry ice to the RIA core at the University of Iowa for measurement of PRA. PRA was determined using a commercially available kit that measures the conversation of angiotensin I (Gammacoat Plasma Renin Activity kit, DiaSorin S.p.A.) as previously described (20).
Microinjection of Viral Vectors
The recombinant AAV viral vectors (GENEDETECT, Auckland, NZ) carried GFP and shRNA either against AT1aR or control scrambled sequence (AAV-GFP-shAT1aR or AAV-GFP-shSCM). The titers for each vector were 1.1 × 10¹² genomic particles/ml. For microinjection of viral vectors in the SFO, the rats were anesthetized with isoflurane (2%) and positioned in a stereotaxic frame. After leveling the skull between lambda and bregma, a midline incision was made in the skin over the skull. A small burr hole was then drilled in the skull using coordinates from the atlas of Paxinos and Watson (38): 1.5 mm posterior, 4.5 mm ventral, and 0.0 mm medial from bregma. A stainless steel injector (30-gauge hypodermic tubing, Small Parts, Logansport, IN) connected to a Hamilton microsyringe by calibrated polyethylene tubing was used to inject 200 nl of undiluted vector in each rat over 15–30 s. The injector was left at the injection site for an additional 5 min before it was gradually removed from the brain. The hole in the skull was filled with gel foam, and the incision wound was surgically sutured. The rats were allowed to recover for 7 days from the surgery.
Laser-Capture Microdissection of GFP-Labeled SFO
Laser capture microdissection (LCM) was performed as previously described (35). After delivery of viral vector in SFO, both groups of rats (shSCM, n = 6; and shAT1aR, n = 6) were maintained in a separate room and allowed to breath room air for 4 wk. After 4 wk, each rat was anesthetized with thiobutabarbital (Inactin, 100 mg/kg ip, Sigma-Aldrich, St. Louis, MO) and decapitated. The brain was rapidly removed and frozen in cooled isopentane that was kept on dry ice. Serial frozen coronal section (10 μm thickness) containing SFO were obtained using a cryostat (Leica Biosystems, Buffalo Grove, IL). The sections were mounted on polyethylene naphthalate (PEN) membrane-coated slides (Arcturus Biosciences, Mountain View, CA). Before microdissecting SFO, the brain sections were thawed for 30 s and then postfixed in 100% methanol for 1 min. This was followed by three washes in ice-cold DEPC-PBS. The GFP-expressing SFO sections were immediately visualized and dissected using the Arcturus Veritas laser capture microdissection system (13553-00, version-c) equipped with an infrared capture laser and ultraviolet cutting laser. One SFO exhibiting GFP expression from each animal was captured onto an Arcturus Adhesive Cap. This was immediately treated with a mixture of nanoscale lysis solution and proteinase K as previously described (35). After thorough vortexing, the lysed cells were stored at −80°C.
RNA Extraction and Amplification
RNA purification from lysed SFO cells was performed using ArrayPure Nano-Scale RNA Purification Kit (Epicentre Biotechnol, Madison, WI) as previously described (35). The purity and concentration of RNA were measured by spectrophotometry (Nanodrop 2000c Spectrophotometer, ThermoScientific, Wilmington, DE). RNA samples were then stored at −80°C until further processing. RNA amplification was done using TargetAmp 2-Round Aminoallyl-aRNA Amplification Kit (Epicentre Biotechnol, Madison, WI), as previously reported from our lab (5, 8, 34–36). This amplification protocol converts the RNA yield in the picogram range to the nanogram range.
Quantitative Real-Time PCR (qRT-PCR)
For each subject, 50 ng of amplified aminoallyl-aRNA from each laser-captured SFO was reverse transcribed to cDNA using a Sensiscript RT kit (Qiagen, Valencia, CA). Each RT reaction was prepared by mixing 2 μl of 10X RT buffer, 2 μl of dNTP mix (final concentration 10 μM), 1 μl of RNase inhibitor (final concentration 10 U/μl), 1 μl Sensiscript reverse transcriptase, 50 ng of aRNA, and RNase-free water to yield a final volume of 20 μl. Reverse transcription was performed at 37°C for 1 h to yield cDNA.
An individual PCR reaction mix (15 μl) comprised 1.8 μl of cDNA, 0.6 μl each of forward and reverse primers (Integrated DNA Technologies, Coralville, IA), 7.5 μl of iQ SYBR Green Supermix (Bio-Rad Laboratories, Hercules, CA), and 4.5 μl of RNase-free water. PCR reactions were performed in a Bio-Rad iQTM5 iCycler system (Bio-Rad Laboratories). To normalize gene expression, 18S mRNA was also measured using qRT PCR. For each PCR experiment, no-RT and no-template controls were performed. The data were analyzed using the 2−ΔΔCt method, as reported previously (5, 34–36). The following primers used to identify respective gene transcripts: AT1aR, forward 5′-ACTCACAGCAACCCTCCAAG-3′ and reverse 5′-ATCACCACCAAGCTGTTTCC-3′; GFP, forward 5′-GACGTAAACGGCCACAAGTTC-3′ and reverse 5′-GTCGCCCTCGAACTTCACCTC-3′; 18S, forward 5′-CAGAAGGACGTGAAGGATGG-3′ and reverse 5′-CAGTGGTCTTGGTGTGCTGA-3′.
ANG II-Induced Drinking Response and c-Fos Expression Experiments
A separate set of animals was used to functionally test AT1aR gene knockdown in SFO by measuring their drinking response to subcutaneous (sc) injections of ANG II (2 mg/kg body wt). All experiments were conducted between 0900 and 1200. Animals were tested 5 days and 1 day before microinjection of viral vectors. The animals were injected with either shSCM (n = 6) or shAT1aR (n = 7) in the SFO as described above. After stereotaxic surgery, animals were allowed to recover for 1 wk. Drinking tests were conducted once every week for 4 wk. At the beginning of each test, the animals were weighed, their food was removed, and their water bottles were replaced with graduated drinking tubes. Baseline water intake was measured for 30 min. After this baseline period, each rat was injected with ANG II (2 mg/kg sc) and their water intakes were measured after 2 h.
In addition to ANG II-induced drinking response, these animals were also tested for ANG II-induced c-Fos staining in forebrain regions innervated by the SFO. For this test, the rats were prepared as described above and injected with the same dose of ANG II but they were not given water following the injections. After 2 h, the animals were anesthetized with thiobutabarbital (Inactin, 100 mg/kg ip, Sigma-Aldrich, St. Louis, MO) and transcardially perfused with 4% paraformaldehyde in 0.1 M phosphate-buffered saline (PBS). Their brains were removed and placed in 4% paraformaldehyde for 2 h and transferred to 30% sucrose in PBS. After 2–3 days, serial coronal forebrain sections (40 μm) were collected using a cryostat (Leica Biosystems, Buffalo Grove, IL) and stored in cryoprotectant at −20°C until processed further for either c-Fos [1:2,000; goat anti-c-Fos (sc-52-G), Santa Cruz Biotechnologies, Santa Cruz, CA] or glial fibrillary acidic protein (GFAP) [1:1,000 mouse monoclonal anti-GFAP (clone G3893), Sigma-Aldrich] immunohistochemistry according to previously described methods (25).
Telemetry Monitoring of Blood Pressure, Heart Rate, Respiratory Rate, and Activity
For the CIH study, a Dataquest IV radiotelemetry system (Data Sciences, St. Paul, MN) was used to continuously record MAP, heart rate (HR), respiratory rate (RR), and activity (Act). After 7 days of recovery from stereotaxic surgery, each rat was anesthetized (isoflurane 2%) and implanted with an abdominal aortic catheter, attached to a radiotelemetry transmitter (model TA11PA-C40) as previously described (7, 25). The rats were allowed to recover for an additional 7 days from the surgery. MAP, HR, RR, and Act data were radiotelemetrically acquired and electronically recorded by a Dataquest A.R.T 2.2 system (Data Sciences International, St. Paul, MN). The data were sampled for 10 s every 10 m and further reduced to 1-h averages throughout the 24-h period.
CIH Protocol
For CIH treatments, the rats' home cages were placed in custom-built Plexiglas chambers containing O2 monitors and connected to a custom-made set of time-controlled valves used to expose the rats to 6-min cycles of 10% O2 as previously described (25). These hypoxia-normoxia cycles were repeated for 8 h during the light (nocturnal) phase, from 0800 to 1600. During 16 h of dark phase (1600- 0800), the lids were removed from the chambers and the animals remained exposed to room air. CIH exposure was performed for 7 days. Animals in normoxia groups were housed in the same room and allowed to breathe room air. The experimental duration from the day of virus injection until the day the animal was euthanized was 4 wk.
Based on the type of viral vector and treatment protocol, the animals were divided into four groups: 1) shSCM and normoxia (S-Norm, n = 7), 2) shAT1aR and normoxia, (A-Norm, n = 10), 3) shSCM and CIH, (S-CIH, n = 9), and 4) shAT1aR and CIH (A-CIH, n = 8).
Immunohistochemistry
On the morning after the last day of CIH exposure, rats were anesthetized using thiobutabarbital (Inactin, 100 mg/kg ip, Sigma-Aldrich) and transcardially perfused with 4% paraformaldehyde. Their brains were prepared for immunohistochemistry as described above. At the level of the SFO, one 20-μm section, after every three 40-μm sections, was placed directly on a gelatin-coated slide and coverslipped using aqueous mounting medium (Vectashield HardSet mounting medium, Vector Laboratories, Burlingame, CA) for verification of injection site. All other sets of 40-μm sections were stored in cryoprotectant at −20°C until further processing.
One set of forebrain sections from each rat was processed for FosB (goat anti-FosB, Santa Cruz Biotechnology; 1:1,000) immunohistochemistry as previously described (25). As the antibody binds with both FosB and its splice variant ΔFosB, we refer to the resultant staining as FosB/ΔFosB. Sections were then visualized using an epifluorescent microscope (Olympus BX41, Olympus, Center Valley, PA) equipped with a digital camera (Olympus DP70, Olympus) and imaging software (DP manager, v2.2.1). Images were analyzed using ImageJ (National Institutes of Health, v. 1.44p). Forebrain nuclei were identified and FosB/ΔFosB-positive cells were counted from each section and PVN subsections (49, 50) and averaged for each region as previously reported by our laboratory (25, 26).
Data and Statistical Analyses
Baseline recordings of MAP, HR, RR, and Act were performed for 5 days prior to starting CIH. The mean was calculated for each recorded variable during CIH (0800-1600) and dark phase. The data for 7 days of CIH are represented as the difference from the respective mean baseline value. The differences in MAP, HR, RR, and Act among groups were determined using two-way repeated-measures ANOVA and Student-Neuman-Keuls (SNK) post hoc tests (SigmaPlot v.12, Systat Software, , San Jose, CA). Data from the postinjection drinking tests were analyzed by two-way repeated-measures ANOVA. Differences in mean c-Fos+ or FosB/ΔFosB+ cell counts per section and relative mRNA expression were tested by Student's t-test. The differences were deemed significant only if the P value was found to be <0.05. All data are expressed as means ± SE.
RESULTS
Effects of CIH on PRA
PRA was significantly elevated after both 1 and 7 days of CIH compared with normoxic controls [normoxic (n = 8) 4.4 ± 1.2 ng·ml−1·min−1; 1 day CIH (n = 6) 20.5 ± 5.9; 7 days CIH (n = 9) 13.6 ± 2.8; P < 0.05].
Viral Delivery and Transfection in the SFO
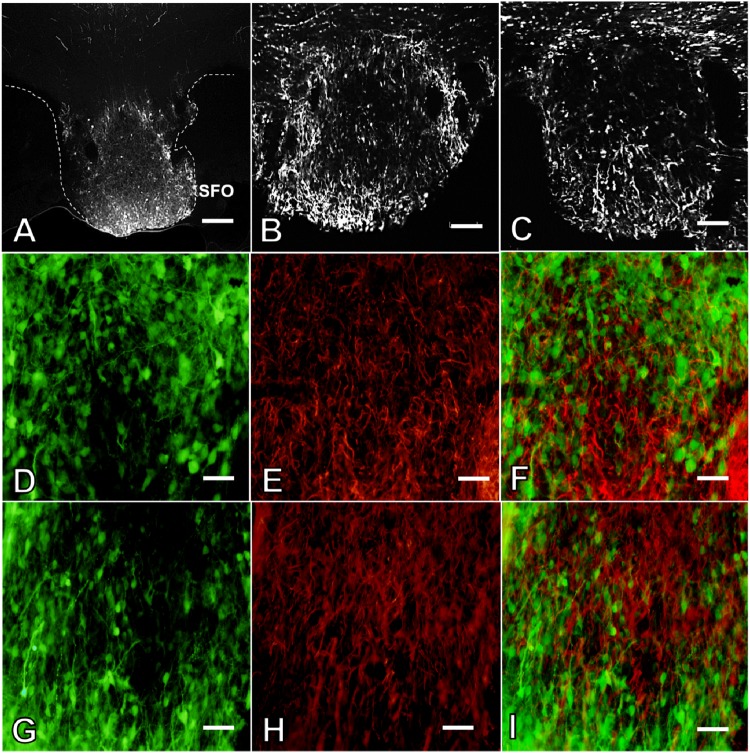
Histological examination demonstrated successful delivery of viral vectors, as demonstrated by expression of GFP in the SFO. No differences were observed in localization and intensity of GFP expression among the shSCM or shAT1aR group of animals (Fig. 1, A–C). Verification of injection site was performed for all the animals. Rats in the CIH study or the drinking behavior study that had injection sites that missed the SFO were excluded from further analyses. In addition, immunohistochemical staining for GFAP revealed that GFP expression was not observed in astrocytes (Fig. 1, D–I). Some AAV vectors have been shown to produce retrograde transfection of cells projecting to the injection site (2, 44). Based on a previous study (6), we inspected the nucleus of the solitary tract (NTS) for GFP-positive cells in brain stems from rats injected in the SFO with either shSCM (n = 7) or shAT1aR (n = 8) that were euthanized 4 wk after the injections. No GFP-positive cells were observed in the NTS from any of the rats inspected.
Fig. 1.
Representative fluorescent images demonstrating green flourescent protein (GFP) expression in the subfornical organ (SFO) of rats that received ANG II type 1a receptor (AT1aR) small-hairpin (sh) RNA (shAT1aR; A and B). Representative photomicrographs demonstrating GFP expression in rats that received scrambled control sequence (SCM) shRNA (shSCM) (C). Representative pseudocolored images demonstrating GFP expression (green), glial fibrillary acidic protein (GFAP) staining (red), and colocalization (merged images) in SFO of rats treated with shSCM (D–F) or shAT1aR (G–I). Scale bars: 200 μm (A), 100 μm (B and C), 50 μm (D–I).
Verification of Effective Knockdown of AT1aR in SFO
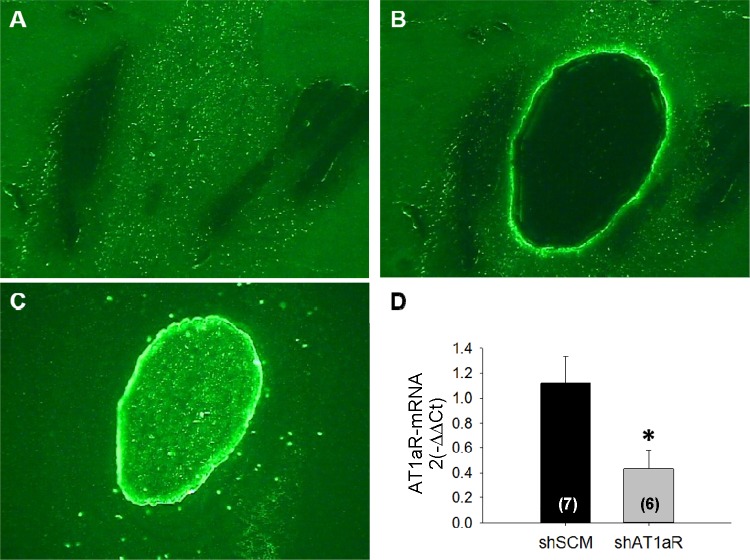
To verify the knockdown of AT1aR, we laser-captured GFP-expressing SFO bulb and measured AT1aR mRNA. Representative images of GFP-expressing SFO before and after capturing SFO is shown in Fig. 2, A and B. The captured SFO bulb is shown in Fig. 2C. We observed that after 4 wk of virus delivery, AT1aR mRNA was significantly lower in shAT1aR (n = 6) compared with the shSCM group (n = 7; Fig. 2D). We normalized AT1aR mRNA against ribosomal 18S mRNA. The GFP mRNA was not significantly different between the two groups (P > 0.05).
Fig. 2.
Representative images of GFP expression in the SFO before (A) and after (B) laser capture microdissection (LCM) extraction of the region. C: the harvested SFO. Bar graph (D) shows the effects of shAT1aR treatment (n = 6) compared with shSCM injections (n = 7) on AT1aR mRNA in the SFO. *P < 0.05.
Effect of AT1aR Knockdown in SFO on ANG II-Induced Drinking Behavior
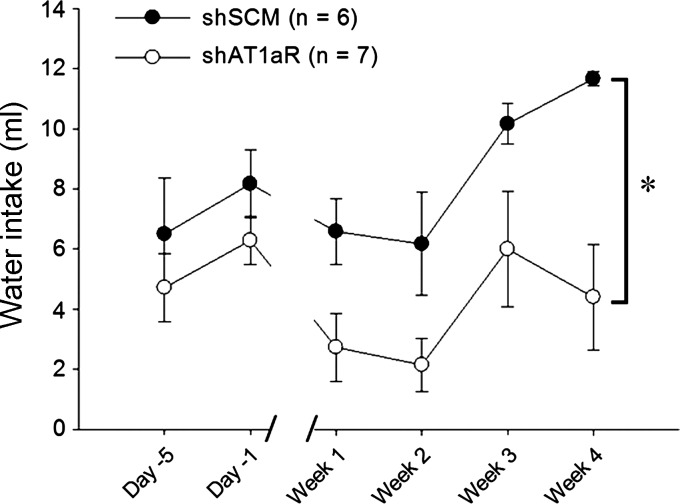
To further verify AT1aR knockdown, we tested the drinking response after subcutaneous administration of ANG II in the shSCM (n = 6) and shAT1aR (n = 7) groups. Before the injection of viral vectors, there was no difference in ANG II (2 mg/kg body wt)-induced water intake between the groups. After receiving the treatments, rats in the shAT1aR-treated group drank significantly less following the ANG II injections than rats injected with shSCM [group main effect F(1,11) = 11.02, P < 0.006; Fig. 3].
Fig. 3.
Drinking response to ANG II (2 mg/kg sc) administration in rats injected in the SFO with either shAT1aR (n = 7) or shSCM (n = 6). The shAT1aR group drank significantly less water compared with the shSCM group. *P < 0.05.
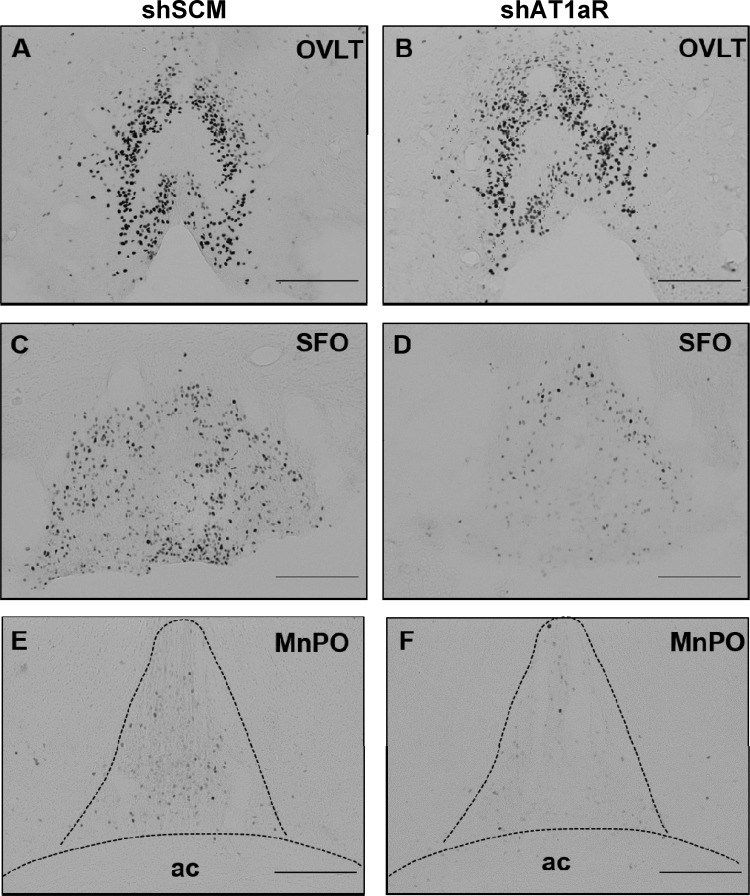
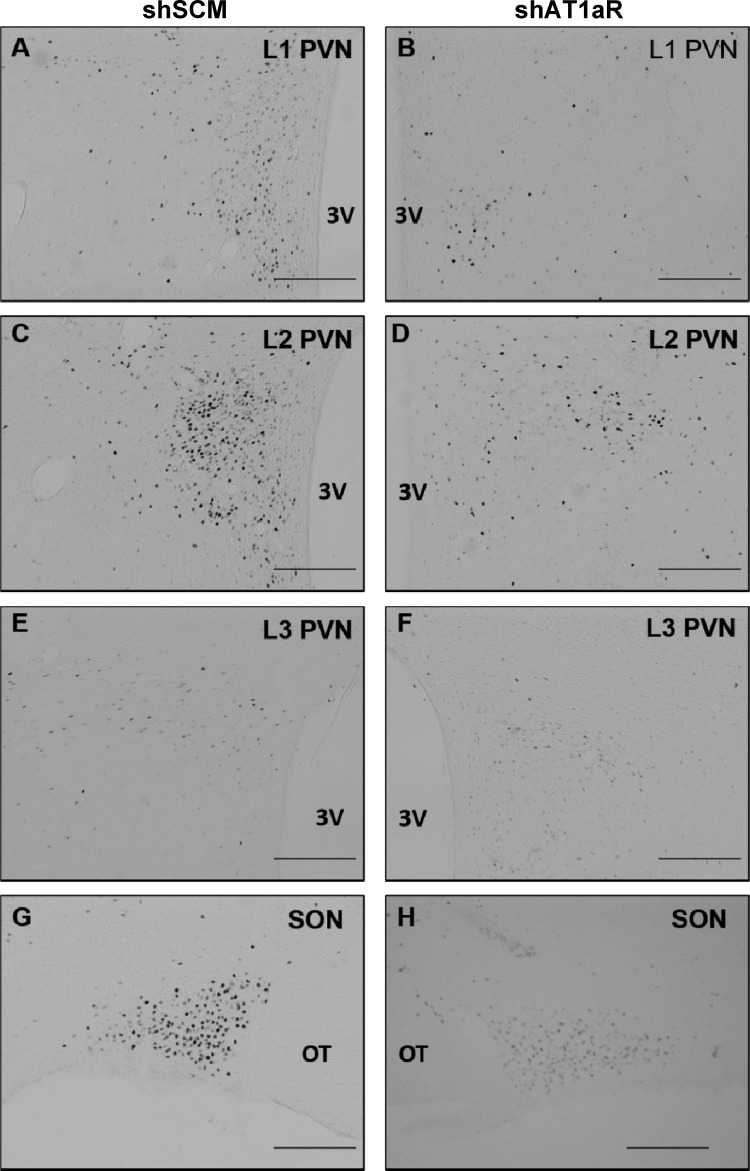
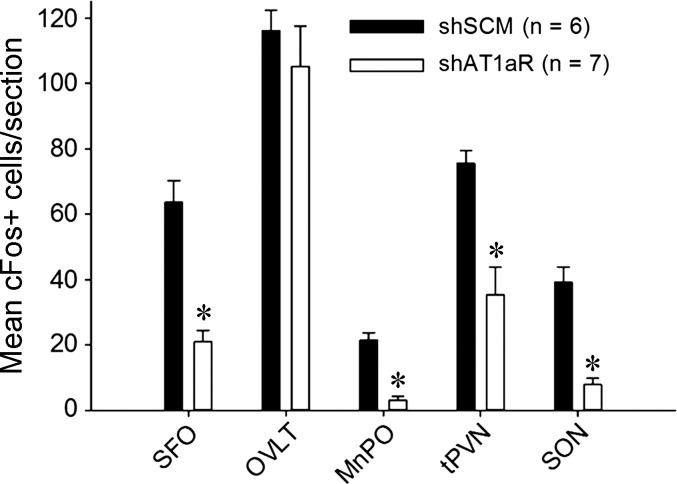
Next, we tested if c-Fos staining in the SFO, organum vasculosum of the lamina terminalis (OVLT), median preoptic nucleus (MnPO), and hypothalamic paraventricular and supraoptic nuclei (PVN and SON, respectively) following subcutaneous ANG II administration is different between shAT1aR and shSCM groups. There was no significant difference in the c-Fos staining in the OVLT between two groups. In the other regions that we examined, we found significant reductions in c-Fos-positive neurons in shAT1aR rats compared with rats injected with shSCM. Representative photomicrographs of OVLT, SFO, and MnPO are shown in Fig. 4 and those of PVN and SON are shown in Fig. 5. Cumulative summary data of the counts are shown in Fig. 6. Significant decreases in c-Fos staining were observed in posterior magnocellular (pm), medial parvocellular (mp), and dorsal cap (dp) regions of the PVN (P < 0.05; Table 1). There was a trend towards decreases in c-Fos-positive neurons in ventrolateral parvocellular (vlp) and lateral parvocellular (lp) neurons; however, these differences did not achieve statistical significance.
Fig. 4.
c-Fos expression in AV3V nuclei 2 h after sc ANG II administration. Representative photomicrographs showing c-Fos staining in the organum vasculosum of the lamina terminalis (OVLT) (A and B), SFO (C and D), and median preoptic nucleus (MnPO) (E and F) in rats that received AT1aR shRNA in SFO (shAT1aR; right column) or SCM shRNA (shSCM; left column) in SFO. ac, anterior commissure. Scale bar is 200 μm for each image.
Fig. 5.
Representative images showing c-Fos staining in the PVN (A–F) and SON (G and H) following ANG II (2 mg/kg sc) in rats that were injected in the SFO with either AT1aR shRNA (shAT1aR; right column) or SCM shRNA (shSCM; left column). 3V, third ventricle; OT, optic tract. Scale bars in each image are 200 μm.
Fig. 6.
Mean numbers of c-Fos-positive cells per section of forebrain nuclei 2 h after sc ANG II injection. Bar graph showing average c-Fos-positive cells per section in key autonomic and neuroendocrine nuclei in key forebrain nuclei after 2 h of sc ANG II (2 mg/kg body wt) in rats that received SCM shRNA (shSCM; black bars, n = 6) or AT1aR shRNA (shAT1aR; open bars, n = 7) in SFO. *P < 0.05.
Table 1.
Mean numbers of c-Fos-positive cells per section in subdivisions of paraventricular nucleus of hypothalamus of rats 2 h after ANG II (2 mg/kg body wt) treatments
| PVN Subdivision | shSCM | shAT1aR |
|---|---|---|
| pm | 26 ± 2 | 8 ± 2* |
| mp | 16 ± 1 | 8 ± 2* |
| dp | 10 ± 1 | 5 ± 1* |
| vlp | 12 ± 1 | 6 ± 1 |
| lp | 12 ± 1 | 9 ± 2 |
Data are presented as means ± SE. Rats were previously injected with either SCM shRNA (shSCM) or AT1aR shRNA (shAT1aR) in the subfornical organ (SFO). pm, posterior magnocellular; mp, medial parvocellular; dp, dorsal cap; vlp, ventrolateral parvocellular; lp, lateral parvocellular neurons.
P < 0.05.
Baseline Measurements of MAP, HR, RR, and Act
Baseline recordings were done for 5 days prior to starting CIH exposures. The mean values during light and dark phases were calculated, and differences between groups were measured (Table 2). There was no significant differences in baseline recordings of MAP, HR, RR, and Act among the groups during 0800-1600 of the light phase or the dark phase (P < 0.05).
Table 2.
Average baseline (5 days) MAP and heart rate of normoxic and CIH-exposed rats injected with SCM shRNA (S-Norm and S-CIH) and AT1aR shRNA (A-Norm and A-CIH-SFO) during light and dark phase
| S-Norm | S-CIH | A-Norm | A-CIH-SFO | |
|---|---|---|---|---|
| MAP, mmHg | ||||
| Light phase | 93.3 ± 2.4 | 95.5 ± 1.6 | 94.8 ± 1.7 | 93.1 ± 1.7 |
| Dark phase | 98.4 ± 2.7 | 99.8 ± 1.8 | 99.9 ± 2.1 | 97.9 ± 1.6 |
| Heart rate, beats/min | ||||
| Light phase | 343.1 ± 4.1 | 326.2 ± 6.0 | 342.5 ± 3.5 | 332.4 ± 4.9 |
| Dark phase | 398.6 ± 5.0 | 384.8 ± 4.4 | 401.7 ± 4.0 | 393.8 ± 4.0 |
Data are presented as means ± SE.
MAP, mean arterial pressure; CIH, chronic intermittent hypoxia.
No significant difference was observed in the recorded variables.
Effect of AT1aR Knockdown on MAP
CIH (0800-1600).
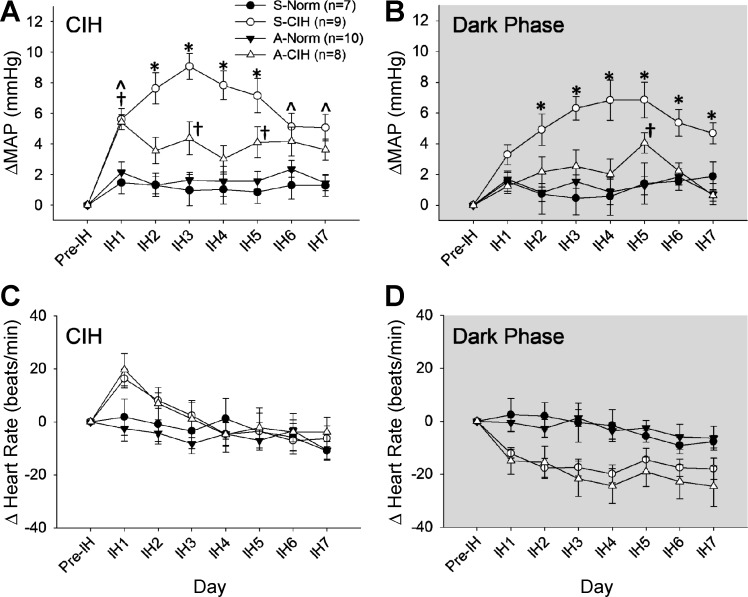
The results indicated that there was an interaction for MAP during CIH (0800-1600) [treatment × day interaction, F(18,180) = 2.36, P < 0.002; Fig. 7A]. Follow-up analyses of the interaction indicated that on day 1 (IH1), a significant increase in MAP was observed in both groups exposed to CIH compared with both normoxic groups (P < 0.05; Fig. 7A). From IH2 through IH7, rats exposed to CIH and injected in the SFO with shSCM showed significantly greater changes in MAP than both normoxic groups (S-Norm and A-Norm; P < 0.05). From IH2 through IH5, rats injected with shSCM and exposed to CIH showed higher MAP than CIH rats injected with shAT1aR (P < 0.05). On IH6 and IH7, however, the changes in MAP in the two CIH-treated groups were not significantly different. Through the CIH protocol there was a trend for the rats in the SFO with shAT1aR to have greater increases in blood pressure than the two normoxic groups, and these differences reached statistical significance on days IH1, IH3 and IH5. There were no differences between the two normoxic control groups for any of the treatment days.
Fig. 7.
Effects of AT1aR knockdown in the SFO on MAP and HR. The changes from baseline (Pre-IH) are shown in MAP during CIH (A) and dark phase (room air breathing; B) and in HR during CIH (C) and dark phase (room air breathing; D). Data are expressed as means ± SE and analyzed using two-way repeated-measures ANOVA followed by Student-Neuman-Keuls test. IH1–IH7, intermittent hypoxia days 1–7. S-Norm, shSCM + normoxia; S-CIH, shSCM + CIH; A-Norm, shAT1aR + normoxia; A-CIH, shAT1aR + CIH. All symbols indicate P < 0.05: *S-CIH vs. all other groups; †A-CIH vs. A-Norm and S-Norm; Ŝ-CIH vs. A-Norm and S-Norm.
Dark phase.
Analyses of changes in MAP recorded during the normoxic dark phase demonstrated a significant interaction [treatment × day interaction, F(18,180) = 2.1, P < 0.001; Fig. 7B]. Followup analyses indicate that there were no differences in MAP among the groups on the first day of CIH (IH1). From IH2 through IH7, MAP in S-CIH was significantly higher than both normoxic groups and the rats treated with shAT1aR and CIH (all P < 0.05). There was no significant difference between the CIH and shAT1aR-treated group and the normoxic groups (S-Norm and A-Norm), except on IH5 (P < 0.05). Rats with injections of shAT1aR that did not include the SFO (n = 10) and were exposed to CIH showed increases in MAP that were not different from the shSCM-injected rats treated with CIH (average ΔMAP CIH 6.1 ± 0.6, dark phase 4.9 ± 0.7 mmHg, P > 0.05 from S-CIH).
Effect of AT1aR Knockdown on HR
CIH.
During CIH, changes in HR were not significantly influenced by the treatments [treatment × day interaction F(18,180) = 1.63, P > 0.05; treatment F(3,30) = 0.81, P = 0.5; Fig. 7C].
Dark phase.
Changes in HR during the dark phase (room air breathing) were significantly affected by the treatments [F(3,30) = 5.3, P < 0.01; Fig. 7D]. Pairwise comparison revealed that during room air breathing, average HR in A-CIH (−20 ± 4 beats/min) was significantly lower than both normoxic groups (S-Norm −3 ± 4 beats/min; A-Norm −3 ± 4 beats/min, all P < 0.05). Similarly, S-CIH also showed lower average HR (−17 ± 4 beats/min) than both normoxic groups, but the difference failed to reach statistical significance (P = 0.059).
Effect of AT1aR Knockdown on RR and Act
CIH.
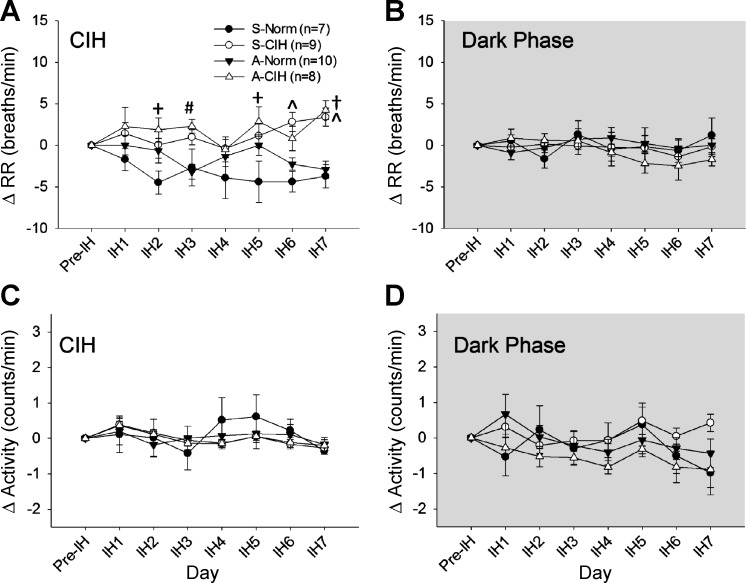
During CIH, there was a significant interaction for changes in RR [F(18,180) = 1.84. P < 0.05; Fig. 8A]. Both CIH-treated groups exhibited significantly higher changes in RR compared with the normoxic control groups on the last day of the CIH protocol (P < 0.05). Similarly, rats injected with shAT1aR and exposed to CIH exhibited higher changes in RR than at least one of the normoxic controls on all of the other treatments days with the exception of day IH4. There were no significant effects of the treatments on Act [treatment × day interaction F(18,180) = 0.72, P > 0.05; treatment F(3,30) = 0.06, P > 0.05; Fig. 8C].
Fig. 8.
Effects of AT1aR knockdown in the subfornical organ (SFO) on respiratory rate (RR) and Activity. The changes from baseline (Pre-IH) are shown in HR during light phase (CIH) (A) and dark phase (room air breathing; B) and in Activity during light phase (CIH) (C) and dark phase (room air breathing; D). Data are expressed as means ± SE and analyzed using two-way repeated-measures ANOVA followed by Student-Neuman-Keuls test. All symbols indicate P < 0.05: #A-CIH vs. S-Norm; +A-CIH vs. A-Norm; Ŝ-CIH vs. A-Norm and S-Norm; †A-CIH vs. A-Norm and S-Norm.
Dark phase (Fig. 8, B and D).
No significant differences were observed in RR [treatment × day interaction F(18,180) = 0.82, P > 0.05; treatment F(3,30) = 0.25, P > 0.05; Fig. 8B] or Act [treatment × day interaction F(18,180) = 1.21, P > 0.05; treatment F(3,30) = 1.1, P > 0.05; Fig. 8D] among groups during the dark phase when rats were allowed to breath room air.
Effect of AT1aR Knockdown in SFO on CIH-Associated Expression of FosB/ΔFosB
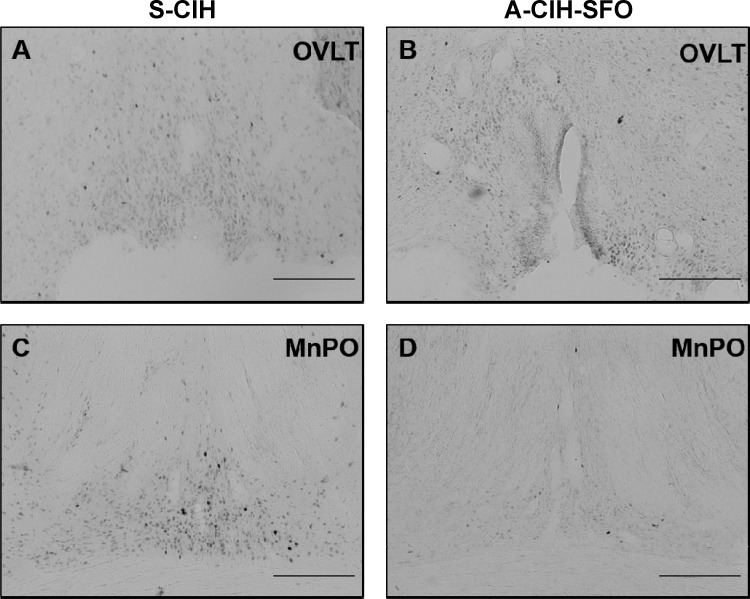
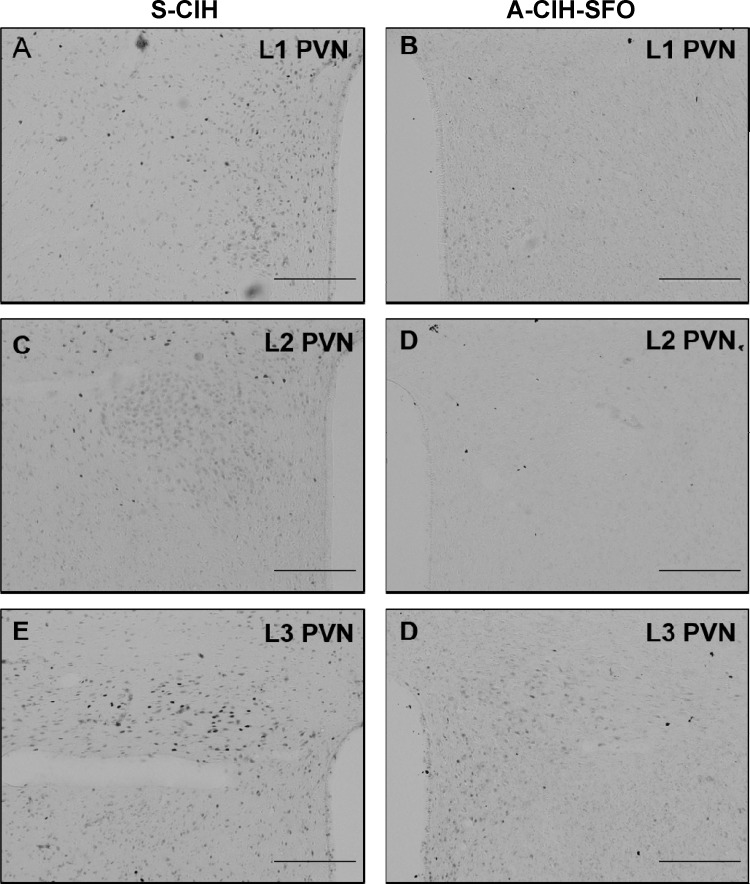
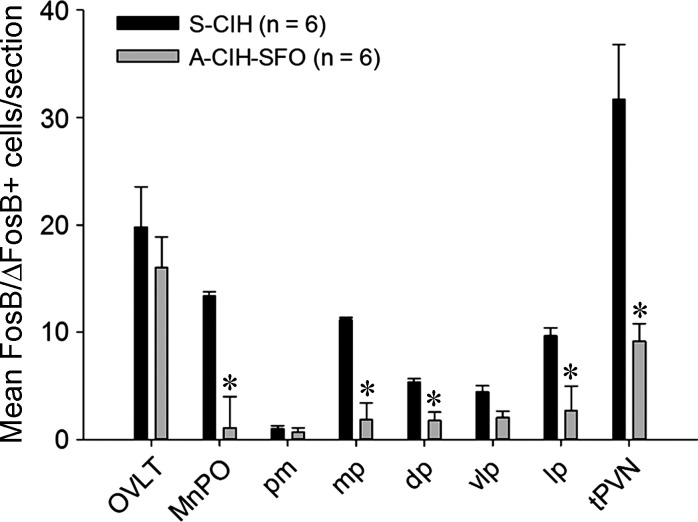
We have previously reported that our protocol of 7 day CIH show enhanced FosB/ΔFosB expression in OVLT, MnPO, and PVN (25). We tested whether AT1aR knockdown in the SFO affects CIH-associated FosB/ΔFosB staining in these forebrain nuclei. Representative photomicrographs of FosB/ΔFosB staining in these regions are shown in Figs. 9 and 10. We observed significant decreases in FosB/ΔFosB staining in MnPO and most parvocellular divisions of PVN from shAT1aR-injected rats exposed to CIH (n = 6) compared with the same regions in shSCM and CIH-treated rats (n = 6; Figs. 11). There were no significant differences in FosB/ΔFosB staining in OVLT and magnocellular PVN.
Fig. 9.
Representative images of the OVLT (A and B) and MnPO (C and D) showing FosB/ΔFosB staining after 7 days of CIH exposure from rats injected with AT1aR shRNA (A-CIH-SFO; right column) or SCM shRNA in SFO (S-CIH; left column). Scale bar is 200 μm.
Fig. 10.
Representative images of 3 different rostral-caudal planes of the PVN (anterior, A and B; medial, C and D; caudal, E and F) showing FosB/ΔFosB staining after 7 days of CIH exposure from rats injected with AT1aR shRNA (A-CIH-SFO; right column) or SCM shRNA (S-CIH; left column)in SFO. Scale bar is 200 μm.
Fig. 11.
Bar graph showing average numbers of FosB/ΔFosB-positive cells per section from OVLT, MnPO, subregions of PVN, and total PVN (tPVN) from rats injected with AT1aR shRNA (A-CIH-SFO; n = 6) or SCM shRNA (S-CIH; n = 6) after 7 days of CIH. *P < 0.05. pm, posterior magnocellular; mp, medial parvocellular; dp, dorsal cap; vlp, ventrolateral parvocellular; lp, lateral parvocellular neurons.
DISCUSSION
In animal models of CIH, peripheral activation of RAS has been implicated in the sustained increase in MAP (15, 16, 18, 54). Fletcher et al. (18) demonstrated that systemic administration of the AT1R antagonist (losartan) blocks the increase in MAP associated with CIH. More recent studies have identified at least two different peripheral mechanisms that could account for effects of losartan (28, 29) and provided evidence that the brain RAS may also participate in CIH hypertension (9, 26). The SFO, a circumventricular organ in the forebrain that lacks blood-brain barrier, serves as a primary target for the central actions of circulating ANG II. In the present study, we investigated whether AT1aRs in the SFO play a role in sustained increase in MAP associated with CIH. We used an AAV vector containing shRNA directed against the AT1aR to selectively knockdown these receptors in the SFO. Our preliminary experiments showed that injections of this vector in the SFO significantly reduced AT1aR mRNA in this region. In a separate group of rats, SFO AT1aR knockdown reduced water intake and c-Fos staining in the SFO, MnPO, PVN, and SON induced by peripherally injected ANG II. This indicates that the injections of AT1aR-shRNA in the SFO significantly attenuated the behavioral and c-Fos responses to exogenous circulating ANG II, which is consistent with a decrease in AT1aRs. It should also be noted that the SFO injections did not affect c-Fos staining in the OVLT following subcutaneous ANG II. This observation was expected since the OVLT is a CVO that also expresses AT1aR and may explain why the drinking responses to ANG II were reduced and not abolished.
When the rats injected with shAT1aR in the SFO were exposed to CIH (A-CIH), we observed significant effects on the blood pressure response and FosB/ΔFosB staining. During CIH exposure from 0800 to 1600 on the first day of CIH, rats injected with shSCM and shAT1aR and exposed to CIH showed similar increases in the MAP. However, during most of the days of CIH exposures, the shAT1aR-injected group showed significantly smaller changes in MAP during intermittent hypoxia than rats injected with shSCM and exposed to CIH. During the dark phase, when rats were allowed to breathe room air, shAT1aR in the SFO prevented the increases in MAP associated with CIH. Hence, AT1aR knockdown in SFO appears to have prevented the sustained component of CIH hypertension. Our data suggest that AT1aRs in SFO contribute to both increases in MAP during hypoxic exposure and normoxia during CIH but that their contribution to the sustained component of CIH hypertension during normoxia may be more essential.
These results are similar to the effects of intracerebroventricular (ICV) losartan infusions on CIH hypertension, which affected the changes in MAP during both the intermittent hypoxia component of the protocol and the normoxic dark phase (26). In the present study, our treatments selectively targeted AT1aRs in the SFO, whereas the ICV infusions of losartan likely had multiple sites of action and could have affected both AT1aRs and AT1bRs.
One of the mechanisms underlying CIH hypertension is increased drive from peripheral chemoreceptors that contributes to a sustained increase in central sympathetic outflow (42). In animal models of CIH, sustained increases in the sensitivity to hypoxia in carotid chemoreceptors have been observed (40, 41). Reactive oxygen species (39) and local RAS activation (27) in the carotid bodies have been implicated in these peripheral adaptations. It is plausible that the antihypertensive effect of the peripheral administration of losartan in CIH rats (16) are partly mediated by inhibition of RAS activity in the peripheral chemoreceptors. However, this hypothesis is insufficient to account for CIH-associated chronic activation of the lamina terminalis (25) or our present observation that AT1aR knockdown in the SFO attenuates CIH hypertension. Our results and previous studies indicating a role for peripheral ANG II in CIH hypertension (16, 18) are consistent with the hypothesis that action of circulating ANG II on the SFO is one of the possible mechanisms that contributes to the sustained increase in arterial pressure associated with CIH.
Recent reports indicate that de novo synthesis of ANG II in the SFO could play a functional role in cardiovascular regulation (43, 46–48). Using genetic techniques to control spatiotemporal expression and inhibition of human renin and angiotensinogen gene in the SFO neurons, Sakai et al. (43) have reported that local synthesis of ANG II in the SFO plays a critical role in regulating sodium and fluid balance. It is likely that AT1aR knockdown in the SFO would interfere with the ability of this region to respond to both circulating and locally generated ANG II. Therefore, our results could be due to the interruption of an interaction between a local RAS in the SFO and circulating ANG II or either of these systems working independently of the other.
We have previously reported that inhibition of the transcriptional activity of FosB in the MnPO decreases FosB/ΔFosB staining in the PVN and blocks the sustained, normoxic component of CIH hypertension (7). In this study, we observed that AT1aR knockdown in the SFO is associated with attenuated CIH-induced FosB/ΔFosB staining in the MnPO and parvocellular PVN. This indicates that ANG II-dependent input from the SFO is necessary for increased FosB/ΔFosB staining in these regions during CIH. As SFO neurons project to PVN both directly and through MnPO, the decreased FosB/ΔFosB in PVN could be due to decreased activity in both of these pathways. Additional studies will be required to fully address the relationship among these three regions and their roles in the pathogenesis and maintenance of CIH hypertension.
Perspectives
CIH, which models the hypoxemia associated with SA, has been shown to produce a sustained increase in blood pressure that is dependent on the RAS (16, 18). More recent studies have described several mechanisms that could explain the role of the RAS in CIH hypertension including endothelial dysfunction (29), enhanced chemoreceptor function (28), and altered central control of autonomic function (9, 26). It has been suggested that endothelial dysfunction related to the RAS contributes more to the maintenance than the genesis of CIH hypertension (29). It is possible that the RAS acting on the chemoreceptors and the CNS produces early adaptations in sympathetic control that lead to hypertension associated with CIH. Although hypoxemia may be one of several physiological triggers that contribute to hypertension in patients with SA (11), a better understanding of early adaptations that underlie the pathogenesis of CIH hypertension may allow us to identify alternative therapeutic options or diagnostic tests to determine the risk of developing hypertension associated with SA.
GRANTS
This study was supported by National Heart, Lung, and Blood Institute Grant P01-HL-88052.
DISCLOSURES
No conflicts of interest, financial or otherwise, are declared by the author(s).
AUTHOR CONTRIBUTIONS
Author contributions: A.S., T.P.N., and J.T.C. conception and design of research; A.S., J.T.L., T.P.N., and J.T.C. performed experiments; A.S., J.T.L., and T.P.N. analyzed data; A.S., T.P.N., and J.T.C. interpreted results of experiments; A.S. prepared figures; A.S. and J.T.C. drafted manuscript; A.S., J.T.L., T.P.N., and J.T.C. edited and revised manuscript; A.S., T.P.N., and J.T.C. approved final version of manuscript.
REFERENCES
- 1.Allen AM. Angiotensin AT1 receptor-mediated excitation of rat carotid body chemoreceptor afferent activity. J Physiol 510: 773–781, 1998. [DOI] [PMC free article] [PubMed] [Google Scholar]
- 2.Aschauer DF, Kreuz S, Rumpel S. Analysis of transduction efficiency, tropism and axonal transport of AAV serotypes 1, 2, 5, 6, 8 and 9 in the mouse brain. PLos One 8: e76310. doi: 10.1371/journal.pone.0076310 eCollection 0072013, 2013. [DOI] [PMC free article] [PubMed] [Google Scholar]
- 3.Bartlett JS, Samulski RJ, McCown TJ. Selective and rapid uptake of adeno-associated virus type 2 in brain. Hum Gene Ther 9: 1181–1186, 1998. [DOI] [PubMed] [Google Scholar]
- 4.Carlson JT, Hedner J, Elam M, Ejnell H, Sellgren J, Wallin BG. Augmented resting sympathetic activity in awake patients with obstructive sleep apnea. Chest 103: 1763–1768, 1993. [DOI] [PubMed] [Google Scholar]
- 5.Carreno FR, Walch JD, Dutta M, Nedungadi TP, Cunningham JT. Brain-derived neurotrophic factor-tyrosine kinase B pathway mediates NMDA receptor NR2B subunit phosphorylation in the supraoptic nuclei following progressive dehydration. J Neuroendocrinol 23: 894–905, 2011. [DOI] [PMC free article] [PubMed] [Google Scholar]
- 6.Ciriello J, Rosas-Arellano MP, Solano-Flores LP. Direct projections to subfornical organ from catecholaminergic neurons in the caudal nucleus of the solitary tract. Brain Res 726: 227–232, 1996. [PubMed] [Google Scholar]
- 7.Cunningham JT, Knight WD, Mifflin SW, Nestler EJ. An essential role for DeltaFosB in the median preoptic nucleus in the sustained hypertensive effects of chronic intermittent hypoxia. Hypertension 60: 179–187, 2012. [DOI] [PMC free article] [PubMed] [Google Scholar]
- 8.Cunningham JT, Nedungadi TP, Walch JD, Nestler EJ, Gottlieb HB. DeltaFosB in the supraoptic nucleus contributes to hyponatremia in rats with cirrhosis. Am J Physiol Regul Integr Comp Physiol 303: R177–R185, 2012. [DOI] [PMC free article] [PubMed] [Google Scholar]
- 9.da Silva AQ, Fontes MA, Kanagy NL. Chronic infusion of angiotensin receptor antagonists in the hypothalamic paraventricular nucleus prevents hypertension in a rat model of sleep apnea. Brain Res 1368: 231–238, 2011. [DOI] [PMC free article] [PubMed] [Google Scholar]
- 10.de Gasparo M, Catt KJ, Inagami T, Wright JW, Unger T. International Union of Pharmacology. XXIII. The angiotensin II receptors. Pharmacol Rev 52: 415–472, 2000. [PubMed] [Google Scholar]
- 11.Dempsey JA, Veasey SC, Morgan BJ, O'Donnell CP. Pathophysiology of sleep apnea. Physiol Rev 90: 47–112, 2010. [DOI] [PMC free article] [PubMed] [Google Scholar]
- 12.Dernaika TA, Kinasewitz GT, Tawk MM. Effects of nocturnal continuous positive airway pressure therapy in patients with resistant hypertension and obstructive sleep apnea. J Clin Sleep Med 5: 103–107, 2009. [PMC free article] [PubMed] [Google Scholar]
- 13.Ferguson AV, Bains JS. Electrophysiology of the circumventricular organs. Front Neuroendocrinol 17: 440–475, 1996. [DOI] [PubMed] [Google Scholar]
- 14.Fletcher EC. Effect of episodic hypoxia on sympathetic activity and blood pressure. Respir Physiol 119: 189–197, 2000. [DOI] [PubMed] [Google Scholar]
- 15.Fletcher EC. Physiological consequences of intermittent hypoxia: systemic blood pressure. J Appl Physiol 90: 1600–1605, 2001. [DOI] [PubMed] [Google Scholar]
- 16.Fletcher EC, Bao G, Li R. Renin activity and blood pressure in response to chronic episodic hypoxia. Hypertension 34: 309–314, 1999. [DOI] [PubMed] [Google Scholar]
- 17.Fletcher EC, Lesske J, Qian W, Miller CC 3rd, Unger T. Repetitive, episodic hypoxia causes diurnal elevation of blood pressure in rats. Hypertension 19: 555–561, 1992. [DOI] [PubMed] [Google Scholar]
- 18.Fletcher EC, Orolinova N, Bader M. Blood pressure response to chronic episodic hypoxia: the renin-angiotensin system. J Appl Physiol 92: 627–633, 2002. [DOI] [PubMed] [Google Scholar]
- 19.Gonzaga CC, Gaddam KK, Ahmed MI, Pimenta E, Thomas SJ, Harding SM, Oparil S, Cofield SS, Calhoun DA. Severity of obstructive sleep apnea is related to aldosterone status in subjects with resistant hypertension. J Clin Sleep Med 6: 363–368, 2010. [PMC free article] [PubMed] [Google Scholar]
- 20.Gottlieb HB, Ji LL, Jones H, Penny ML, Fleming T, Cunningham JT. Differential effects of water and saline intake on water deprivation-induced c-Fos staining in the rat. Am J Physiol Regul Integr Comp Physiol 290: R1251–R1261, 2006. [DOI] [PubMed] [Google Scholar]
- 21.Grobe JL, Xu D, Sigmund CD. An intracellular renin-angiotensin system in neurons: fact, hypothesis, or fantasy. Physiology 23: 187–193, 2008. [DOI] [PMC free article] [PubMed] [Google Scholar]
- 22.Hein L. Genetic deletion and overexpression of angiotensin II receptors. J Mol Med 76: 756–763, 1998. [DOI] [PubMed] [Google Scholar]
- 23.Hendel MD, Collister JP. Contribution of the subfornical organ to angiotensin II-induced hypertension. Am J Physiol Heart Circ Physiol 288: H680–H685, 2005. [DOI] [PubMed] [Google Scholar]
- 24.Iwai N, Inagami T. Identification of two subtypes in the rat type I angiotensin II receptor. FEBS Lett 298: 257–260, 1992. [DOI] [PubMed] [Google Scholar]
- 25.Knight WD, Little JT, Carreno FR, Toney GM, Mifflin SW, Cunningham JT. Chronic intermittent hypoxia increases blood pressure and expression of FosB/ΔFosB in central autonomic regions. Am J Physiol Regul Integr Comp Physiol 301: R131–R139, 2011. [DOI] [PMC free article] [PubMed] [Google Scholar]
- 26.Knight WD, Saxena A, Shell B, Nedungadi TP, Mifflin SW, Cunningham JT. Central losartan attenuates increases in arterial pressure and expression of FosB/ΔFosB along the autonomic axis associated with chronic intermittent hypoxia. Am J Physiol Regul Integr Comp Physiol 305: R1051–R1058, 2013. [DOI] [PMC free article] [PubMed] [Google Scholar]
- 27.Lam SY, Liu Y, Ng KM, Liong EC, Tipoe GL, Leung PS, Fung ML. Upregulation of a local renin-angiotensin system in the rat carotid body during chronic intermittent hypoxia. Exp Physiol 99: 220–231, 2014. [DOI] [PubMed] [Google Scholar]
- 28.Marcus NJ, Li YL, Bird CE, Schultz HD, Morgan BJ. Chronic intermittent hypoxia augments chemoreflex control of sympathetic activity: role of the angiotensin II type 1 receptor. Respir Physiol Neurobiol 171: 36–45, 2010. [DOI] [PMC free article] [PubMed] [Google Scholar]
- 29.Marcus NJ, Philippi NR, Bird CE, Li YL, Schultz HD, Morgan BJ. Effect of AT 1 receptor blockade on intermittent hypoxia-induced endothelial dysfunction. Respir Physiol Neurobiol 183: 67–74, 2012. [DOI] [PMC free article] [PubMed] [Google Scholar]
- 30.McKinley MJ, Albiston AL, Allen AM, Mathai ML, May CN, McAllen RM, Oldfield BJ, Mendelsohn FA, Chai SY. The brain renin-angiotensin system: location and physiological roles. Int J Biochem Cell Biol 35: 901–918, 2003. [DOI] [PubMed] [Google Scholar]
- 31.Miselis RR, Shapiro RE, Hand PJ. Subfornical organ efferents to neural systems for control of body water. Science 205: 1022–1025, 1979. [DOI] [PubMed] [Google Scholar]
- 32.Narkiewicz K, Kato M, Phillips BG, Pesek CA, Davison DE, Somers VK. Nocturnal continuous positive airway pressure decreases daytime sympathetic traffic in obstructive sleep apnea. Circulation 100: 2332–2335, 1999. [DOI] [PubMed] [Google Scholar]
- 33.Narkiewicz K, Somers VK. Sympathetic nerve activity in obstructive sleep apnoea. Acta Physiol Scand 177: 385–390, 2003. [DOI] [PubMed] [Google Scholar]
- 34.Nedungadi TP, Carreno FR, Walch JD, Bathina CS, Cunningham JT. Region-specific changes in transient receptor potential vanilloid channel expression in the vasopressin magnocellular system in hepatic cirrhosis-induced hyponatraemia. J Neuroendocrinol 24: 642–652, 2012. [DOI] [PMC free article] [PubMed] [Google Scholar]
- 35.Nedungadi TP, Cunningham JT. Differential regulation of TRPC4 in the vasopressin magnocellular system by water deprivation and hepatic cirrhosis in the rat. Am J Physiol Regul Integr Comp Physiol 306: R304–R314, 2014. [DOI] [PMC free article] [PubMed] [Google Scholar]
- 36.Nedungadi TP, Dutta M, Bathina CS, Caterina MJ, Cunningham JT. Expression and distribution of TRPV2 in rat brain. Exp Neurol 237: 223–237, 2012. [DOI] [PMC free article] [PubMed] [Google Scholar]
- 37.Okcay A, Somers VK, Caples SM. Obstructive sleep apnea and hypertension. J Clin Hypertens (Greenwich) 10: 549–555, 2008. [DOI] [PMC free article] [PubMed] [Google Scholar]
- 38.Paxinos G, Watson C. The Rat Brain in Stereotaxic Coordinates. San Diego, CA: Academic, 1997. [Google Scholar]
- 39.Peng YJ, Overholt JL, Kline D, Kumar GK, Prabhakar NR. Induction of sensory long-term facilitation in the carotid body by intermittent hypoxia: implications for recurrent apneas. Proc Natl Acad Sci USA 100: 10073–10078, 2003. [DOI] [PMC free article] [PubMed] [Google Scholar]
- 40.Peng YJ, Prabhakar NR. Effect of two paradigms of chronic intermittent hypoxia on carotid body sensory activity. J Appl Physiol 96: 1236–1242; discussion 1196, 2004. [DOI] [PubMed] [Google Scholar]
- 41.Prabhakar NR, Jacono FJ. Cellular and molecular mechanisms associated with carotid body adaptations to chronic hypoxia. High Alt Med Biol 6: 112–120, 2005. [DOI] [PubMed] [Google Scholar]
- 42.Prabhakar NR, Kumar GK. Mechanisms of sympathetic activation and blood pressure elevation by intermittent hypoxia. Respir Physiol Neurobiol 174: 156–161, 2010. [DOI] [PMC free article] [PubMed] [Google Scholar]
- 43.Sakai K, Agassandian K, Morimoto S, Sinnayah P, Cassell MD, Davisson RL, Sigmund CD. Local production of angiotensin II in the subfornical organ causes elevated drinking. J Clin Invest 117: 1088–1095, 2007. [DOI] [PMC free article] [PubMed] [Google Scholar]
- 44.Salegio EA, Samaranch L, Kells AP, Mittermeyer G, San Sebastian W, Zhou S, Beyer J, Forsayeth J, Bankiewicz KS. Axonal transport of adeno-associated viral vectors is serotype-dependent. Gene Ther 20: 348–352, 2013. [DOI] [PMC free article] [PubMed] [Google Scholar]
- 45.Simpson JB, Routtenberg A. Subfornical organ: site of drinking elicitation by angiotensin II. Science 181: 1172–1175, 1973. [DOI] [PubMed] [Google Scholar]
- 46.Sinnayah P, Lazartigues E, Sakai K, Sharma RV, Sigmund CD, Davisson RL. Genetic ablation of angiotensinogen in the subfornical organ of the brain prevents the central angiotensinergic pressor response. Circ Res 99: 1125–1131, 2006. [DOI] [PubMed] [Google Scholar]
- 47.Sinnayah P, Lindley TE, Staber PD, Cassell MD, Davidson BL, Davisson RL. Selective gene transfer to key cardiovascular regions of the brain: comparison of two viral vector systems. Hypertension 39: 603–608, 2002. [DOI] [PubMed] [Google Scholar]
- 48.Sinnayah P, Lindley TE, Staber PD, Davidson BL, Cassell MD, Davisson RL. Targeted viral delivery of Cre recombinase induces conditional gene deletion in cardiovascular circuits of the mouse brain. Physiol Genomics 18: 25–32, 2004. [DOI] [PubMed] [Google Scholar]
- 49.Stocker SD, Cunningham JT, Toney GM. Water deprivation increases Fos immunoreactivity in PVN autonomic neurons with projections to the spinal cord and rostral ventrolateral medulla. Am J Physiol Regul Integr Comp Physiol 287: R1172–R1183, 2004. [DOI] [PubMed] [Google Scholar]
- 50.Stocker SD, Hunwick KJ, Toney GM. Hypothalamic paraventricular nucleus differentially supports lumbar and renal sympathetic outflow in water-deprived rats. J Physiol 563: 249–263, 2005. [DOI] [PMC free article] [PubMed] [Google Scholar]
- 51.Thomas WG, Qian H, Smith NJ. When 6 is 9: “uncoupled” AT1 receptors turn signalling on its head. Cell Mol Life Sci 61: 2687–2694, 2004. [DOI] [PMC free article] [PubMed] [Google Scholar]
- 52.Thomopoulos C, Michalopoulou H, Kasiakogias A, Kefala A, Makris T. Resistant hypertension and obstructive sleep apnea: the sparring partners. Int J Hypertens 2011: 947246, 2011. [DOI] [PMC free article] [PubMed] [Google Scholar]
- 53.Weisinger RS, Denton DA, Di Nicolantonio R, Hards DK, McKinley MJ, Oldfield B, Osborne PG. Subfornical organ lesion decreases sodium appetite in the sodium-depleted rat. Brain Res 526: 23–30, 1990. [DOI] [PubMed] [Google Scholar]
- 54.Yuan ZM, Chen BY, Wang PX, Li SY, Chen YL, Dong LX. [Changes of angiotensin II and its receptor during the development of chronic intermittent hypoxia-induced hypertension in rats]. Zhonghua Jie He He Hu Xi Za Zhi 27: 577–580, 2004. [PubMed] [Google Scholar]
- 55.Zimmerman MC, Lazartigues E, Sharma RV, Davisson RL. Hypertension caused by angiotensin II infusion involves increased superoxide production in the central nervous system. Circ Res 95: 210–216, 2004. [DOI] [PubMed] [Google Scholar]


