

Abstract
Electroencephalogram signals are time-varying complex electrophysiological signals. Existing studies show that approximate entropy, which is a nonlinear dynamics index, is not an ideal method for electroencephalogram analysis. Clinical electroencephalogram measurements usually contain electrical interference signals, creating additional challenges in terms of maintaining robustness of the analytic methods. There is an urgent need for a novel method of nonlinear dynamical analysis of the electroencephalogram that can characterize seizure-related changes in cerebral dynamics. The aim of this paper was to study the fluctuations of approximate entropy in preictal, ictal, and postictal electroencephalogram signals from a patient with absence seizures, and to improve the algorithm used to calculate the approximate entropy. The approximate entropy algorithm, especially our modified version, could accurately describe the dynamical changes of the brain during absence seizures. We could also demonstrate that the complexity of the brain was greater in the normal state than in the ictal state. The fluctuations of the approximate entropy before epileptic seizures observed in this study can form a good basis for further study on the prediction of seizures with nonlinear dynamics.
Keywords: epilepsy, electroencephalogram, approximate entropy, nonlinear dynamics
INTRODUCTION
Epilepsy is one of the most common serious neurological disorders[1,2]. Epileptic seizures are defined as transient signs or symptoms of abnormal, excessive, or synchronous neuronal activity in the brain[3]. Epilepsy is usually controlled, but not cured with medication, and surgery may be considered in difficult cases. The available medications are not effective in all patients, with 30% of epileptic people suffering from uncontrolled seizures[4]. Thus, there is a strong need for new curative treatments.
Neuronal networks manifest the property of multistable dynamics. It can be assumed that there are two possible states of the epileptic brain: the interictal state, characterized by normal, apparently random, steady-state activity, and the ictal state (seizure), characterized by the sudden onset of synchronous oscillations[5]. The transition between these two states can occur either as a continuous sequence of phases, or as a sudden change[5]. Seizures with the former type of ictal transition may be anticipated in their early, preclinical phases. In the latter case, where a sharp critical transition takes place, the seizures may be unpredictable. Electroencephalogram (EEG) signals reflect the electrical activity of the brain. At the onset of an ictal event, the EEG signal displays a complicated dynamic transition. Analysis of EEG changes in epileptic patients plays an important role in assessing the effects of treatment. Thus, new and more effective methods of EEG data analysis are urgently needed.
Using techniques developed for the analysis of complex nonlinear systems, specific spatiotemporal dynamical EEG changes that begin several seconds before, and end several seconds after, a seizure can be identified[6,7]. The cerebral activity during an epileptic seizure is significantly different from the normal state. It is low-dimensional during the seizure, and high-dimensional during the interval state[8]. Its dynamic characteristics, including chaotic fractal dimension, complexity, Lyapunov index, correlation dimension, and other indices, change significantly. A number of studies have investigated the EEG using one or several dynamic indices, sometimes including wavelet transformation[9]. During seizures, the EEG tends to become synchronized and cyclical[10,11,12], and the correlation dimension and complexity of the EEG are reduced[13]. It has been demonstrated that nonlinear dynamics methods are more sensitive in detecting seizures than traditional linear methods[14,15,16].
Complexity is an important characteristic of nonlinear dynamic systems. Approximate entropy (ApEn) is a nonlinear dynamic parameter that describes the complexity of a time series[17]. The ApEn is greater when the time series is more complex[18,19,20]. ApEn has the following advantages over other parameters: (1) it requires fewer data points (~100 - 5 000), (2) it is robust against noise and wild data points, and (3) it is appropriate for both deterministic chaotic and stochastic processes. Given N points and the similarity criterion r, ApEn (m, r, N) is approximately equal to the negative average natural logarithm of the conditional probability that vectors similar for m points remain similar at the next point, where the similarity of two vectors is judged in terms of their absolute coordinates[21]. ApEn and improved versions of this method have been used to analyze EEG signals of healthy individuals under different physiological and cognitive states[18,19,20,21,22].
In this paper, we used ApEn and an improved ApEn algorithm to characterize the dynamical properties of the ictal transition in subjects with absence epilepsy. We studied scalp EEG data recorded by video-EEG. Based on the observed variations in the ApEn during preictal, interictal and postictal states, we discuss the dynamic mechanisms of epileptic absence seizure.
RESULTS
ApEn algorithm and parameters
We first studied the impact of different values of the parameters r and N on ApEn.
The number of data points used to calculate ApEn in a time series can vary from hundreds to thousands. Due to the instability of EEG signals, we choose the first 70 seconds (14 000 points) of continuous EEG data. The amplitude of the EEG signal from T5 increased dramatically during the ictal period compared with the preictal period (Figure 1).
Figure 1.

Filtered electroencephalogram (EEG) segment from T5 electrode.
(A) Seventy-second segment of the EEG signal.
(B) Ten-second segment of the EEG signal shown in A.
First, we studied the effect of different values of r. Usually, the threshold r has been between 0.1 and 0.2 SD (SD is the standard deviation of the original data), so we calculated ApEn for r = 0.1 SD and r = 0.2 SD. The ApEn algorithm showed that the value of r affected the number of d[x(i),x≤r, and that the number of d [x(i),x(j)≤r for m must be greater than the number of d[x(i),x(j)≤ r for m + 1. Generally, the value of ApEn is nonnegative. This result indicates that ApEn cannot embody the complexity of epileptic seizures. Pincus[19] found that when ApEn (m = 2, r1) (A) ≤ApEn (m = 2, r1) (B), then ApEn (m = 2, r2) (A) ≤ApEn (m = 2, r2) (B) (for r larger than most of the noise). Therefore, we think that this r is too small to achieve fault tolerance, and that the interference of excessive noise is too great.
Second, we analyzed the effect of the value of N (number of data points) on ApEn. As shown in Figure 2, we can see that the value of N did not have a distinct effect on ApEn. However, increasing N will increase computation times.
Figure 2.

Approximate entropy (ApEn) curves of filtered electroencephalogram data from T5 for m = 2, r = 0.2 SD, and step= 300 (m: embedded dimension; r: tolerance; SD: the standard deviation of the original data).
(A) N = 500; (B) N = 800; (C) N = 1 200.
Finally, we determined the appropriate step length for calculating ApEn[23]. We compared the sliding window method with the jumping window method. We chose the data obtained from electrode F4, moved 400 points forwards to calculate a new ApEn value, and compared with the result of the jumping window method. Figure 3 shows the difference between the two methods. When the jumping window was applied, the curve jumped too much. This can obscure lots of detail, and can cause the loss of important information. Therefore, we adopted the sliding window method for the rest of this study. Since small time steps will require longer computation times in MATLAB, while large steps will cause the loss of information, we chose a step of 300 to get a reasonable result.
Figure 3.

Approximate entropy (ApEn) curves of filtered electroencephalogram data from T5 for m = 2, N = 800, and r = 0.2 SD (m: embedded dimension; r: tolerance; SD: the standard deviation of the original data).
(A) Jumping window; (B) slipping window (step: 400).
Changes in complexity in the presence of an external high-frequency disturbance
Dynamical changes in the brain during absence seizures can be characterized by the ApEn index calculated from an EEG signal filtered according to common clinical standards. Sometimes, environmental factors during recording can cause interference in EEG recordings. For instance, sudden high-frequency disturbances can severely affect EEG recordings.
We compared the ApEn of the original signal from electrode F4 with the filtered signal, to investigate the influence of external disturbances in the normal environment on ApEn. As shown in Figure 4, the amplitude of the ApEn of the original signal was larger than that of the filtered signal, but the overall shape was unchanged. This demonstrates that the ApEn algorithm has anti-jamming properties.
Figure 4.
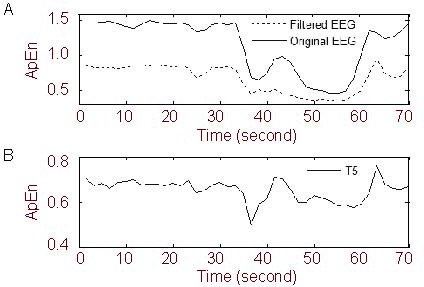
Approximate entropy (ApEn) curves for m = 2, N = 800, r = 0.2 SD, and step = 300 (m: embedded dimension; r: tolerance; SD: the standard deviation of the original data).
(A) Filtered and unfiltered electroencephalogram (EEG) from electrode F4; (B) filtered EEG from electrode T5.
An external high-frequency disturbance could be seen at electrode T5 between 40 and 45 seconds (Figure 1B). The ApEn curves from both the filtered and unfiltered data show an abrupt wave crest at 40-45 seconds (Figure 4).
This character of the curves does not reflect the actual situation during the ictal period, and ApEn can therefore not accurately reflect the dynamical changes in the biological EEG signal. The phenomenon suggests that abrupt high-frequency disturbances have great impact on the ApEn.
Algorithm improvement
For many experiments, Pincus[19] suggested m = 2 as an appropriate dimension to give reasonable statistical validity of the ApEn. However, because the EEG is a multivariable, nonlinear, non-stationary time series, the dimension is much larger than 2 or 3. Combining methods of False Nearest Neighbors, mutual information and C-C, we have found that the EEG data have a higher dimension[8]. In this study, we obtained an ApEn series that contained some negative values (Figure 5B), which disagrees with the definition of ApEn. We defined the original algorithm as Algorithm 0, and calculated the values of ϕm(r) that returned a value of 0 in formula 1.
Figure 5.
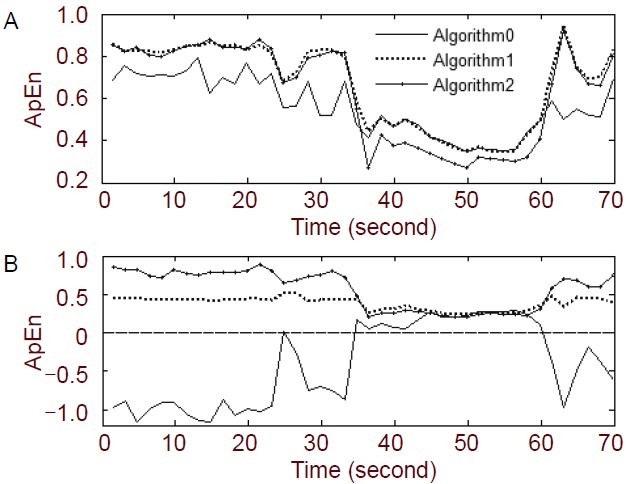
Comparison of three algorithms for calculation of approximate entropy (ApEn) for N = 800, r = 0.2 SD, and step = 300 (N: data length; r: tolerance; SD: the standard deviation of the original data).
When m was increased to 5, ApEn became negative. To avoid the zero value in Cmi(r) and Cm+1i(r), we made a small modification to the algorithm. By changing formula (1) to

we obtained a new algorithm (defined as Algorithm 1). Although the definition of ϕm(r) is different, ApEn (ϕm(r)-ϕm+1(r)) tends towards the same results as the original definition as N approaches infinity. However, when both Cmi(r) and Cm+1i(r) are extremely small (ϕm(r)≈ϕm+1(r)), ApEn can have a zero value. To avoid a non-reasonable zero value of ApEn, we modified formula (1) to

to obtain another new algorithm (defined as Algorithm 2). In experiments using increasing values of m, Algorithm 2 performed better than Algorithms 0 and 1.
Figure 5A shows the different ApEn results obtained by the different algorithms when m = 2, at electrode F4. We found that the ApEn calculated by all the algorithms could reflect the dynamical changes in the EEG signal over time. There was a larger difference between the preictal and ictal periods in the ApEn curves obtained using Algorithms 1 and 2, compared to Algorithm 0. Figure 5B shows the difference between the algorithms when m = 5. Part of the curve calculated by Algorithm 0 dropped below zero, which does not agree with the definition of ApEn. In addition, there was little difference between the preictal and ictal periods in the curve calculated by Algorithm 1. The curve of Algorithm 2 was the best curve for distinguishing between the preictal and ictal periods. By comparison, we found that Algorithm 2 was suitable for ApEn calculation of multi-dimensional data.
Figure 6 shows the ApEn curves for different values of m calculated by Algorithm 2. The difference between the ictal and preictal periods was greater at larger values of m. Thus, when m increased, ApEn described more clearly the dynamical change of the brain. In addition, the curve between 38 and 45 s was smoother at larger values of m. This shows that the ApEn algorithm performed better under conditions of interference by a sudden high-frequency disturbance when m = 7 in this experiment. In this figure, the ApEn tended to decrease progressively during the preictal period. However, the ApEn value increased before this decline. In the ictal period, the ApEn maintained a lower value, and after the seizure, the ApEn increased again and sometimes even exceeded the preictal values. In the ApEn curves, there was a trough between 20 and 30 seconds and that was co-incident with eye blink artifacts detected in the video.
Figure 6.
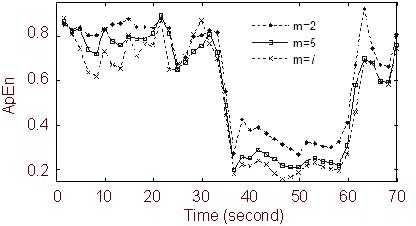
Approximate entropy (ApEn) curves for different values of m, calculated by Algorithm 2 for N = 800, r = 0.2 SD, and step = 300 (N: data length; r: tolerance, SD: the standard deviation of the original data).
Figure 7 shows that electrodes T3 and C3 are not suitable for using ApEn to distinguish between ictal and preictal periods in the EEG[24].
Figure 7.

Approximate entropy (ApEn) curves of four electrodes.
DISCUSSION
In this study, we report that the ApEn of an EEG signal during the ictal period is smaller than during the preictal period. This finding supports some hypotheses proposed in previous studies[5, 25]. The methods used to analyze biomedical signals have received increasing attention in recent years. Some scholars have improved the algorithms to increase computation speed, and other studies have tried to use ApEn to quantify changes in brain function[17,18,21,26]. In our study, we described the fluctuations of ApEn in preictal, ictal, and postictal EEG signals from a patient with absence seizures. The increasing value of ApEn in the preictal state indicated that the complexity of the brain changed before epileptic seizures. This implies that the increase in ApEn could be used to predict the onset of the epileptic seizure, when the parameters m, r, and N are chosen appropriately.
In this study, we have found that the EEG signal at certain electrode positions can be used to describe the dynamical changes during absence seizures. Detailed evaluation of the best choice of electrodes will require another study. We also found that ApEn sensitively reflects the biological signal. Common interference signals can have positive influences during computation and analysis. Since the sensitivity of the preictal and ictal periods to interference varies, the interference signals make the value of ApEn partially larger (Figure 4A). Consequently, the difference in ApEn between the interval and ictal periods is increased, making it easier to identify the change. The ApEn values for the filtered EEG signal decrease in total, with greater reductions for the interictal EEG and smaller reductions during the ictal phase. However, interference signals have little influence on the shape of the ApEn curve. Therefore, this ApEn algorithm is able to resist certain types of noise, because the chosen value of r is larger than most of the noise. However, irregular, sudden interference signals and myoelectricity during EEG monitoring, especially signals with frequency components within the recorded range, can have marked influences on the ApEn.
During the ApEn computation, we found that the definition excluded the condition Cmi(r)= 0. Because of this flaw, the algorithm is not applicable for multi-dimensional ApEn calculation[27]. To compute the ApEn in multiple dimensions, we put forward two modified algorithms. Algorithm 2 solved the problem in our study. As seen in Figure 6, the dynamical characteristics of the epileptic EEG signal were reflected more clearly when m increased. In addition, at increasing values of m, the impact of irregular, sudden interference signals decreased, while the impact of biological signals, blink artifacts, was retained.
Previous research suggests that ApEn may detect epileptic seizures and explain the dynamic behavior of the brain[9,14,22]. We here report that a modified algorithm (Algorithm 2) better describes multidimensional dynamical changes in the brain. This algorithm retains the important advantages of ApEn in the study of biological systems, including less stringent data set requirements, relatively robust results, and resistance to irregular external disturbances.
SUBJECTS AND METHODS
Design
A study of the nonlinear dynamics of neuroelectrophysiological data from human subjects.
Time and setting
This study was performed at the Department of Neurology, the First Affiliated Hospital of Sun Yat-sen University, China, from May 2004 to August 2005.
Subjects
Four patients (3 males, 1 female) with childhood absence epilepsy were recruited from the Department of Neurology, the First Affiliated Hospital of Sun Yat-sen University, China. These patients had an average age of 11.1 ± 3.7 years, and were enrolled with informed consent.
Inclusion criteria
-
(1)
4-18 years old.
-
(2)
Seizures characterized by sudden transient confusion without convulsions.
-
(3)
Typical 3 Hz spike-wave complex in EEG.
-
(4)
No family history of epilepsy.
-
(5)
Normal motor and cognitive development.
-
(6)
No anti-epileptic drug or sedative before and during the examinations.
Exclusion criteria
-
(1)
Progressive central nervous system diseases.
-
(2)
Acute infection during the examinations.
-
(3)
History of partial seizures.
Methods
The patients underwent a 24-hour video-EEG examination. Experimental scalp EEG data were obtained by a video electroencephalograph (Stellate Inc, Montréal, Canada) with 16 electrodes. Continuous EEG signals were typically analyzed for 70 seconds, and included one seizure episode (36 seconds preictally, 22 seconds ictally and 12 seconds postictally; Figure 1).
The signal was sampled at a frequency of 200 Hz and the number of data points was 14 000 points per electrode.
The scalp EEG data contained some interference signals or electrical noise. Before analyzing EEG signals, we filtered them according to standard clinical procedures. The signal was high-pass filtered to remove frequencies below 0.30 Hz, low-pass filtered at 35 Hz, and notch filtered at 50 Hz.
Complexity is a general concept with various definitions, which can be employed from different angles to evaluate biological signals[28,29,30]. Pincus[19] suggested the concept of ApEn as an index of complexity, and used it to quantify the randomness of complex systems. More irregular time series data correspond to greater values of ApEn. The algorithm is computed as follows:
First step: Given a time series of data u(1), u(2), …, u(N), from measurements equally spaced in time, form a sequence of vectors x(1), x(2), …, x(N − m + 1) in Rm, defined by x(i) = [u(i), u(i + 1), …, u(i + m − 1)] and x(j) = [u(j), … u(j + 1)] (define for each i, 1 ≤ i ≤ N − m + 1; and j, 1 ≤ j ≤ N − m + 1).
Second step: Calculate the distance between x(i) and x(j).

Third step: Define r, and for each i ≤ N − m + 1, calculate the number of d[x(i), x(j)] ≤ r and divide by N − m + 1.

Forth step: Define ϕm(r) as the average value of ln Cmi(r). Fifth step: for m+1, repeat steps 1–4, and note down ϕm+1(r).
Sixth step: Calculate ApEn.

In accordance with the definition and the algorithm of ApEn, we should establish an m-dimensional vector before analyzing time series. Usually, m = 1 or m = 2 have been used in previous studies. Due to the complicated nature of biological signals, m = 2 has often been chosen for myoelectricity and EEG signals, when N was about 800[20]. Generally, we adopt m = 2 and r = 0.1−0.2 SD [SD is the standard deviation of the original data u(i)].
Footnotes
Funding: This study was supported by the National Natural Science Foundation of China, No.10671213 and 11101440; the Natural Science Foundation of Guangdong Province; Fundamental Research Funds for the Central Universities.
Conflicts of interest: None declared.
Ethical approval: The project received full ethical approval from Zhongshan School of Medicine, Sun Yat-sen University in China.
(Edited by Vincenzo B/Yang Y/Song LP)
REFERENCES
- [1].Hirtz D, Thurman DJ, Gwinn-Hardy K, et al. How common are the “common” neurologic disorders? Neurology. 2007;68(5):326–337. doi: 10.1212/01.wnl.0000252807.38124.a3. [DOI] [PubMed] [Google Scholar]
- [2].Blume W, Lüders H, Mizrahi E, et al. Glossary of descriptive terminology for ictal semiology: report of the ILAE task force on classification and terminology. Epilepsia. 2001;42(9):1212–1218. doi: 10.1046/j.1528-1157.2001.22001.x. [DOI] [PubMed] [Google Scholar]
- [3].Fisher RS, van Emde Boas W, Blume W, et al. Epileptic seizures and epilepsy: definitions proposed by the International League Against Epilepsy (ILAE) and the International Bureau for Epilepsy (IBE) Epilepsia. 2005;46(4):470–472. doi: 10.1111/j.0013-9580.2005.66104.x. [DOI] [PubMed] [Google Scholar]
- [4].Cascino GD. Epilepsy: contemporary perspectives on evaluation and treatment. Mayo Clin Proc. 1994;69(12):1199–1211. doi: 10.1016/s0025-6196(12)65776-0. [DOI] [PubMed] [Google Scholar]
- [5].Lopes da Silva F, Blanes W, Kalitzin SN, et al. Epilepsies as dynamical diseases of brain systems: basic models of the transition between normal and epileptic activity. Epilepsia. 2003;44(Suppl 12):72–83. doi: 10.1111/j.0013-9580.2003.12005.x. [DOI] [PubMed] [Google Scholar]
- [6].Ocak H. Automatic detection of epileptic seizures in EEG using discrete wavelet transform and approximate entropy. Expert Syst Appl. 2009;36(2):2027–2036. [Google Scholar]
- [7].Stam CJ. Nonlinear dynamical analysis of EEG and MEG: Review of an emerging field. Clin Neurophysiol. 2005;116:2266–2301. doi: 10.1016/j.clinph.2005.06.011. [DOI] [PubMed] [Google Scholar]
- [8].Zhou Y, Zhao Y, Xie LG, et al. Computation and analysis of parameters in phase space reconstruction of epileptic EEG signal. Zhongshan Da Xue Xue Bao Zi Ran Ke Xue Ban. 2007;46(3):5–9. [Google Scholar]
- [9].Guo L, Rivero D, Pazos A. Epileptic seizure detection using multiwavelet transform based approximate entropy and artificial neural networks. J Neurosci Methods. 2010;193(1):156–163. doi: 10.1016/j.jneumeth.2010.08.030. [DOI] [PubMed] [Google Scholar]
- [10].Amor F, Baillet S, Navarro V, et al. Cortical local and long-range synchronization interplay in human absence seizure initiation. Neuroimage. 2009;45(3):950–962. doi: 10.1016/j.neuroimage.2008.12.011. [DOI] [PubMed] [Google Scholar]
- [11].Aarabia A, Walloisb F, Grebe R. Does spatiotemporal synchronization of EEG change prior to absence seizures? Brain Res. 2008;1188:207–221. doi: 10.1016/j.brainres.2007.10.048. [DOI] [PubMed] [Google Scholar]
- [12].Iasemidis LD, Shiau DS, Pardalos PM, et al. Long-term prospective on-line real-time seizure prediction. Clin Neurophysiol. 2005;116(3):532–544. doi: 10.1016/j.clinph.2004.10.013. [DOI] [PubMed] [Google Scholar]
- [13].Silva C, Pimentel IR, Andrade A, et al. Correlation dimension maps of EEG from epileptic absences. Brain Topogr. 1999;11(3):201–209. doi: 10.1023/a:1022281712161. [DOI] [PubMed] [Google Scholar]
- [14].Liu YS, XY, Xu HR, et al. Nonlinear analysis of clinical epileptic EEG by approximate entropy. Zhongguo Dianzi Keji. 2005;3(1):72–74. [Google Scholar]
- [15].Zhao LL, Wu WQ, Hu GS. Approximate entropy analysis of inctable epilepsy treated with EEG biofeedback. J Tsinghua Univ. 2009:411–415. [Google Scholar]
- [16].Martinerie J, Adam C, Le Van Quyen M. Epileptic seizures can be anticipated by non-linear analysis. Nat Med. 1998;4(10):1173–1176. doi: 10.1038/2667. [DOI] [PubMed] [Google Scholar]
- [17].Pan YH, Wang YH, Liang SF, et al. Fast computation of sample entropy and approximate entropy in biomedicine. Comput Methods Programs Biomed. 2011;104(3):382–396. doi: 10.1016/j.cmpb.2010.12.003. [DOI] [PubMed] [Google Scholar]
- [18].Manis G. Fast computation of approximate entropy. Comput Methods Programs Biomed. 2008;91(1):48–54. doi: 10.1016/j.cmpb.2008.02.008. [DOI] [PubMed] [Google Scholar]
- [19].Pincus SM. Approximate entropy as a measure of system complexity. Proc Natl Acad Sci U S A. 1991;88(6):2297–2301. doi: 10.1073/pnas.88.6.2297. [DOI] [PMC free article] [PubMed] [Google Scholar]
- [20].Pincus SM. Approximate entropy (ApEn) as a complexity measure. Chaos. 1995;5(1):110–117. doi: 10.1063/1.166092. [DOI] [PubMed] [Google Scholar]
- [21].Chen WT, Wang ZZ, Ren XM. Characterization of surface EMG signals using improved approximate entropy. J Zhejiang Univ Sci B. 2006;7(10):844–848. doi: 10.1631/jzus.2006.B0844. [DOI] [PMC free article] [PubMed] [Google Scholar]
- [22].Duclos Y, Burnet H, Schmied A, et al. Approximate entropy of motoneuron firing patterns during a motor preparation task. J Neurosci Methods. 2008;172(2):231–235. doi: 10.1016/j.jneumeth.2008.05.001. [DOI] [PubMed] [Google Scholar]
- [23].Pan YH, Lin WY, Wang YH, et al. Computing multiscale entropy with orthogonal range search. J Mar Sci Tech. 2011;19(1):107–113. [Google Scholar]
- [24].Andrzejak RG, Lehnertz K, Mormann F, et al. Indications of nonlinear deterministic and finite dimensional structures in time series of brain electrical activity: dependence on recording region and brain state. Phys Rev E. 2001;64(6):1–8. doi: 10.1103/PhysRevE.64.061907. [DOI] [PubMed] [Google Scholar]
- [25].Yuan Q, Zhou W, Li S, et al. Epileptic EEG classification based on extreme learning machine and nonlinear features. Epilepsy Res. 2011;96(1-2):29–38. doi: 10.1016/j.eplepsyres.2011.04.013. [DOI] [PubMed] [Google Scholar]
- [26].Wu DY, Cai G, Yuan Y, et al. Application of nonlinear dynamics analysis in assessing unconsciousness: a preliminary study. Clin Neurophysiol. 2011;122(3):490–498. doi: 10.1016/j.clinph.2010.05.036. [DOI] [PubMed] [Google Scholar]
- [27].Roopun AK, Traub RD, Baldeweg T, et al. Detecting seizure origin using basic, multiscale population dynamic measures: Preliminary findings. Epilepsy Behav. 2009;14(Suppl):39–46. doi: 10.1016/j.yebeh.2008.09.008. [DOI] [PMC free article] [PubMed] [Google Scholar]
- [28].Gu F, Meng X, Shen E, et al. Can we measure consciousness with EEG complexities. Int J Bifurcat Chaos. 2003;13(3):733–742. [Google Scholar]
- [29].Rapp PE, Schmah TI. Complexity measures in molecular psychiatry. Mol Psychiatry. 1996;1:408–416. [PubMed] [Google Scholar]
- [30].Rapp PE, Cellucci CJ, Korslund KE, et al. Effective normalization of complexity measurements for epoch length and sampling frequency. Phys Rev E Stat Nonlin Soft Matter Phys. 2001;64(1 Pt 2):016209. doi: 10.1103/PhysRevE.64.016209. [DOI] [PubMed] [Google Scholar]