Abstract
The signal-responsive E3 ubiquitin ligase pellino 1 (PELI1) regulates TLR and T cell receptor (TCR) signaling and contributes to the maintenance of autoimmunity; however, little is known about the consequence of mutations that result in upregulation of PELI1. Here, we developed transgenic mice that constitutively express human PELI1 and determined that these mice have a shorter lifespan due to tumor formation. Constitutive expression of PELI1 resulted in ligand-independent hyperactivation of B cells and facilitated the development of a wide range of lymphoid tumors, with prominent B cell infiltration observed across multiple organs. PELI1 directly interacted with the oncoprotein B cell chronic lymphocytic leukemia (BCL6) and induced lysine 63–mediated BCL6 polyubiquitination. In samples from patients with diffuse large B cell lymphomas (DLBCLs), PELI1 expression levels positively correlated with BCL6 expression, and PELI1 overexpression was closely associated with poor prognosis in DLBCLs. Together, these results suggest that increased PELI1 expression and subsequent induction of BCL6 promotes lymphomagenesis and that this pathway may be a potential target for therapeutic strategies to treat B cell lymphomas.
Introduction
The pellino (PELI) protein family is highly conserved in the course of evolution and contains C3HC4 RING-like motifs in its C-terminal domains, which may serve as scaffold proteins (1). PELI proteins catalyze ubiquitin (Ub) chains of several key molecules linked to lysine 48 (K48) or lysine 63 (K63) in B and T cell signaling, such as c-Rel and IL-1 receptor–associated kinase 1, respectively (2–5). Recent evidence from PELI1-deficient mice shows that PELI1 acts as a critical mediator of TRIF-dependent NF-κB activation in TLR3 and TLR4 pathways and is thus required for the induction of proinflammatory cytokine genes (2). Therefore, loss of PELI1 leads to hyperactivation and nuclear accumulation of c-Rel in response to T cell receptor–CD28 (TCR-CD28) signaling and facilitates the development of autoimmune diseases such as experimental autoimmune encephalomyelitis (6). In addition, evidence from PELI3-deficient mice reveals that PELI3 is not indispensable for the TLR-induced expression of proinflammatory cytokines and plays a negative regulatory role in TLR3- and virus-induced expression of type 1 IFNs and related genes (7). Overall, accumulated evidence suggests an important role for PELI proteins in regulating the proliferation and activation of B and T cells. However, their physiological roles remain unclear.
Activation of TCR-CD28–mediated signaling induces PELI1 expression (6, 8). In addition, TLR3 and TLR4 signaling activates the expression and E3 ligase activity of PELI proteins (7, 9). These observations suggest that PELI protein expression is strictly regulated by appropriate TCR or TLR signaling. Accordingly, expression of PELI proteins may be finely controlled, because their deregulation leads to diseases in murine models. Aberrant expression of these proteins may be closely associated with certain diseases, such as autoimmune diseases and cancer. Indeed, aberrant expression of receptor molecules in the immune system is frequently observed in many types of cancer in humans and is associated with cancer progression and poor outcomes (10, 11). Neoplastic and malignant B cells also show aberrant expression of receptor molecules such as TLRs (10). Notably, TLR3 and TLR4 are expressed by malignant B cells (10), which indicates that chronic active receptor-mediated signaling may facilitate the constitutive activation of PELI1 expression. In the present study, we demonstrated that PELI1 was overexpressed in numerous cells obtained from aggressive B cell lymphomas.
The transcriptional repressor BCL6 is highly expressed in germinal center (GC) B and T cells and is required for GC formation and antibody affinity maturation (12). Many B cell lymphomas originate at the GC of B cells and develop as a result of the deregulation of BCL6 expression; these include follicular lymphomas (FLs; almost 100%), Burkitt lymphomas (BLs; 100%), diffuse large B cell lymphomas (DLBCLs; >80%), and nodular lymphocyte-predominant Hodgkin lymphomas (>80%) (13). Notably, deregulation of BCL6 expression in lymphoid tumors occurs via some chromosomal rearrangement in 20%–40% of DLBCLs and 6%–14% of FLs (14, 15) and via some somatic mutation of the 5′-noncoding region of BCL6 in approximately 14% of DLBCLs (16). However, deregulation of BCL6 expression is not based solely on these genetic mutations. Recently, BCL6 has been found to be degraded by an SKP1-CUL1-F-box protein (SCF) Ub ligase complex containing the F-box protein FBXO11, but the FBXO11 protein is inactivated in DLBCLs (17). Therefore, the signaling pathway that regulates the ubiquitination of BCL6 may also contribute to B cell lymphomagenesis through BCL6 stabilization. However, little is known about the signals that stimulate commitment to B cells by activating BCL6 induction.
Results
PELI1 expression induces development of various lymphoid and solid tumors.
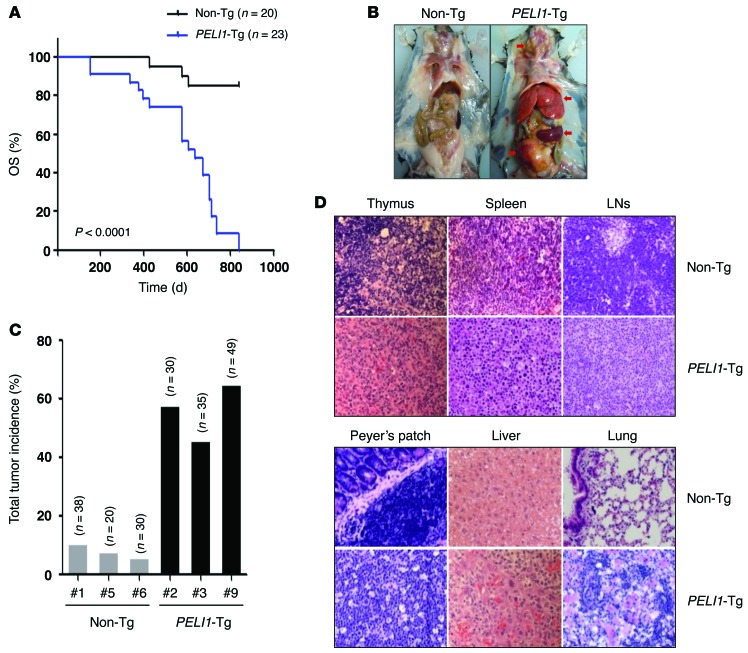
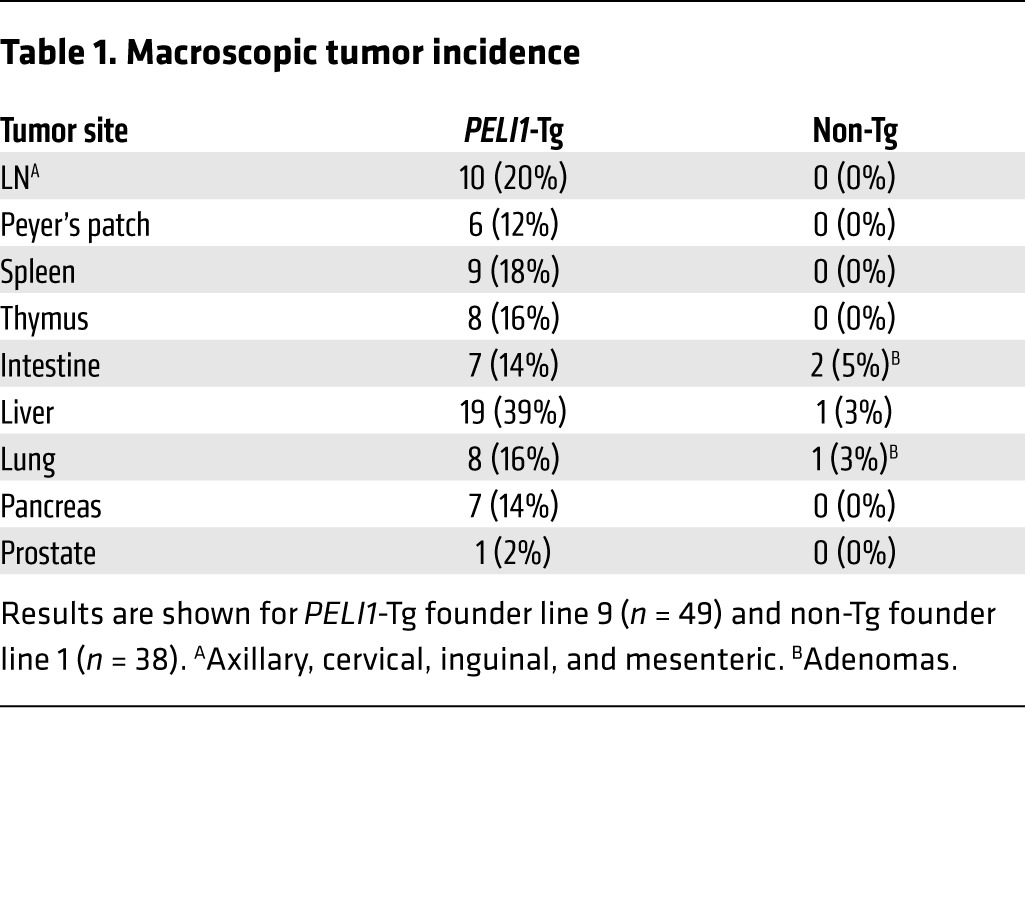
To assess the gain of function of PELI1, we generated transgenic mice containing a human PELI1 gene coding sequence under the control of the β-actin promoter and the human early CMV enhancer. In these mice (referred to herein as PELI1-Tg), the PELI1 transgene was verified to be expressed in numerous organs, including the liver, lungs, BM, spleen, and thymus (Supplemental Figure 1; supplemental material available online with this article; doi:10.1172/JCI75667DS1). PELI1-Tg mice of 3 lines derived from founder C57BL/6J mice showed accelerated mortality: median overall survival (OS) was about 560 days (~80 weeks), a significant reduction compared with non-Tg littermate control mice (P < 0.0001; Figure 1A). In addition, histopathological examination revealed that overall, 55% of adult PELI1-Tg mice developed a wide spectrum of tumors in the liver, lung, lymph nodes (LNs), pancreas, Peyer’s patch, spleen, and thymus (Figure 1, B and C). In particular, approximately 16%–20% of PELI1-Tg mice developed lymphoid tumors in spleen, thymus, LNs, and Peyer’s patches (Table 1). Most of the lymphoid organs of PELI1-Tg mice contained many cells showing plasmacytoid differentiation and some cells displaying histiocytic infiltration (Figure 1D). In addition to the high incidence of tumors in lymphoid organs, about 40% of PELI1-Tg mice also developed and showed different subtypes of tumors in liver, lung, intestine, pancreas, and prostate (Table 1 and Supplemental Table 1). Together, these results indicate that constitutive PELI1 expression contributes to the development of a wide range of tumors.
Figure 1. Development of tumors in mice expressing PELI1 protein.
(A) Kaplan-Meier curves of OS for PELI1-Tg mice (n = 23) and non-Tg littermates (n = 20) from 3 independent founder lines (PELI1-Tg lines 2, 3, and 9; non-Tg lines 1, 5, and 6). (B) Macroscopic images of non-Tg littermates (founder line 1) and PELI1-Tg mice (founder line 9). Arrows denote tumors. (C) Total tumor incidence for the indicated PELI1-Tg and littermate non-Tg founder lines, as determined by macroscopic analysis. (D) Representative micrographs of H&E-stained tissue samples from the thymus, spleen, cervical LN, Peyer’s patch, liver, and lungs of non-Tg and PELI1-Tg mice. Original magnification, ×400.
Table 1.
Macroscopic tumor incidence
PELI1 expression induces constitutive activation of B cell signaling and tumor infiltration by B220+ lymphocytes in PELI1-Tg mice.
Peripheral complete blood counts of PELI1-Tg mice showed significant increases in the number of white blood cells, lymphocytes, and monocytes (Supplemental Figure 2A), but there was no statistically meaningful sign of anemia compared with control non-Tg mice (data not shown). In addition, PELI1-Tg mice exhibited enhanced production of proinflammatory cytokines such as IL-6, IL-10, and TNF-α (Supplemental Figure 2B).
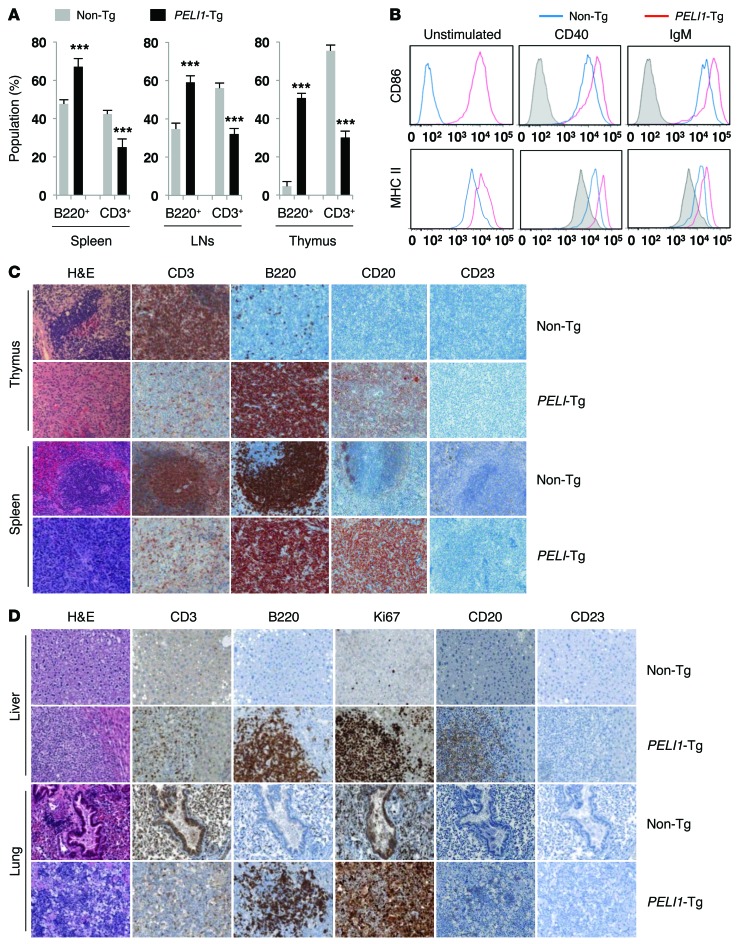
To further examine whether PELI1 overexpression would affect the aberrant proliferation and activation of B or T cells, or vice versa, lymphoid tissue samples were stained for B220 (proliferating B lymphocyte marker) and CD3 (T lymphocyte marker) antigens (Figure 2A). Flow cytometry showed that tumor-bearing lymphoid tissue samples of PELI1-Tg mice, including their LNs, spleen, and thymus, showed significantly increased proportions of B220+ lymphocytes compared with those in the same tissue of non-Tg mice of the same age (Figure 2A). The number of B220+ lymphocytes from the thymus was markedly larger in PELI1-Tg than non-Tg mice. In contrast, the number of CD3+ lymphocytes in the LNs, spleen, and thymus of some PELI1-Tg mice was smaller than that for non-Tg mice (Figure 2A).
Figure 2. Constitutive PELI1 expression promotes hematopoietic alterations and activates ligand-independent B cell signal transduction.
(A) Proportion of B220+ B cell and CD3+ T cell populations, measured by flow cytometry, in cells isolated from spleen, LN, and thymus of non-Tg and PELI1-Tg mice at 14–16 months of age. Data (mean ± SEM) are representative of 3 independent experiments, with 4 mice per experiment. ***P < 0.001. (B) Flow cytometry of CD86 and MHC class II surface expression in splenic cells derived from non-Tg and PELI1-Tg mice incubated in vitro for 24 hours in the presence of anti-CD40 and anti-IgM antibodies. Gray histograms represent untreated non-Tg cells (unstimulated control). (C) Representative images of H&E staining and IHC analyses for B220, CD3, CD20, and CD23 antigen expression in splenic and thymic tissue samples isolated from non-Tg and PELI1-Tg mice. Strong B220 and CD20 staining was observed in the spleen and thymus of PELI1-Tg mice, whereas B220 and CD20 staining was detectable only at the GC of control non-Tg mice. Original magnification, ×200. (D) Liver and lung tissue samples isolated from non-Tg littermates and PELI1-Tg mice were fixed and stained with anti-B220, anti-CD3, anti-CD20, anti-CD23, and anti-Ki67 antibodies in serial sections. Original magnification, ×200.
TLR signaling is an upstream activating signal of PELI proteins and plays an important role in B cell activation. In response to TLR-mediated signals, B cells activate the expression of MHC class II and costimulatory CD86 molecules, which enhances their ability to activate helper T cells (18, 19). To further investigate the effect of PELI1 gain of function on receptor-mediated signaling, splenic B220+ cells were prepared from non-Tg and PELI1-Tg mice of the same age. Induction of CD86 expression as well as MHC class II expression was clearly evident in the absence of receptor-mediated stimulation with a CD40 or IgM antibody in PELI1-Tg mice (Figure 2B), which suggests that constitutive expression of PELI1 activated its downstream signaling without triggering the receptor-mediated signal. Furthermore, although stimulation of splenic B220+ cells using CD40 or IgM antibody led to induction of CD86 and MHC class II expression in both control non-Tg and PELI1-Tg mice, such expression was substantially augmented in the PELI1-Tg group compared with the non-Tg group (Figure 2B). Together, these results indicate that constitutive PELI1 expression induces ligand-independent B cell signal transduction.
Lymphocythemia persisted in most PELI1-Tg mice, which might be due to B220+ cell activation or proliferation. Therefore, tumor tissue samples were stained for B220, CD3, and CD23 antigens. Interestingly, histopathological examination of PELI1-Tg mice revealed markedly increased B220+ and CD20+ cells, but decreased CD3+ cells, in the spleen and thymus of PELI1-Tg mice, whereas staining for B220 and CD20 antigens was detectable only at the GC of non-Tg mice of the same age (Figure 2C). In addition, more than half of PELI1-Tg tumors showed lymphoid infiltration into multiple organs, including liver and lungs, which was represented by irregular nuclei, scanty cytoplasm, and a diffuse growth pattern (Figure 2D). The overall architecture of the lungs and liver of PELI1-Tg mice was distorted by atypical proliferating cells. To test whether these tumors were associated with a malignant lymphoid population derived from the PELI1 transgene, expression of B220, CD3, CD20, CD23, and Ki67 was assessed. Notably, these nonlymphoid organs contained a massive population of the B cell phenotype (B220+CD20+) and some T cells (CD3+) (Figure 2D). In addition, Ki67 signal in liver and lung tissue was robust in PELI1-Tg mice, but not in non-Tg mice (Figure 2D). Taken together, these observations indicate that tumors developing in PELI1-Tg mice are likely associated with B cell activation and infiltration.
BM transplantation of hematopoietic stem cells expressing PELI1 leads to development of lymphoid tumors with B cell infiltration.
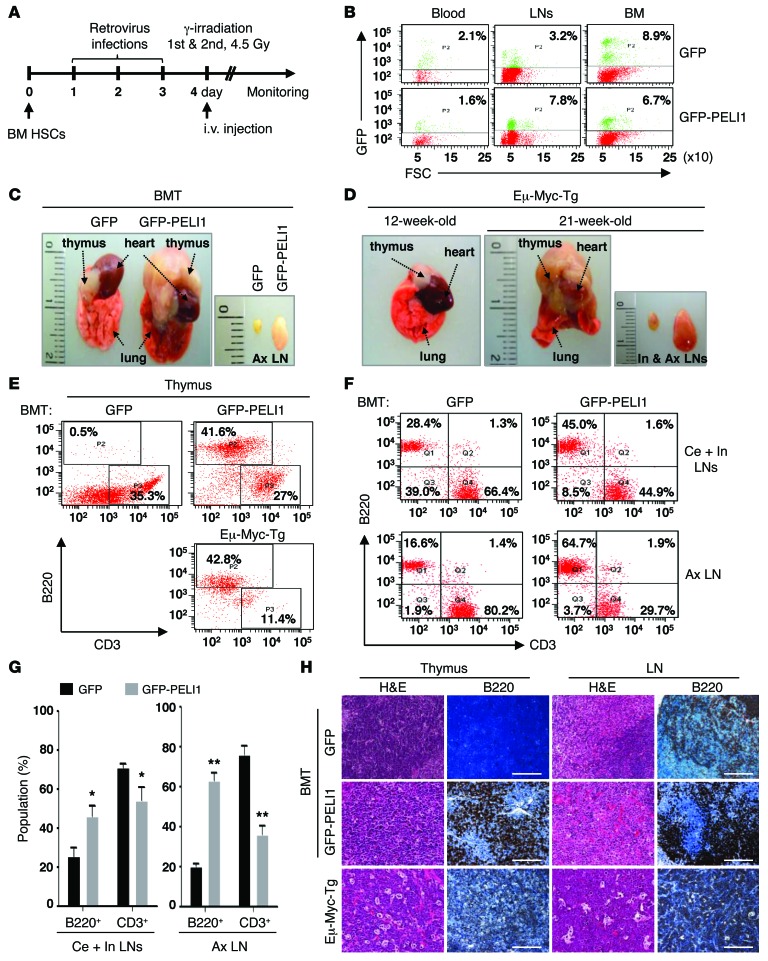
Because PELI1 overexpression contributed to immunological defects and B cell–positive tumor development in PELI1-Tg mice, we next sought to determine whether this tumor development occurs autonomously in the hematopoietic system. BM transplantation (BMT) was performed using hematopoietic stem cells (HSCs) infected with retroviruses encoding human PELI1 plus GFP (Figure 3A). Significant populations of transduced HSCs were maintained in the peripheral blood, LNs, and BM for approximately 30 weeks after transduction (Figure 3B). Notably, GFP-PELI1 recipient mice exhibited severe hematopoietic alterations, as reflected by dramatic increases in LN and spleen size as well as by thymic and lymphoid tumors similar to those frequently observed in Eμ-Myc-Tg mice (Figure 3, C and D, and Supplemental Figure 3), which exhibit a high incidence of spontaneous lymphomas and early B cell leukemia (20). These immunophenotypes became distinct at approximately 25 weeks after BMT.
Figure 3. BMT of HSCs expressing PELI1 results in development of lymphoid tumors with B cell infiltration.
(A) BMT protocol. HSCs derived from primary murine BM were retrovirally transduced with GFP or GFP-PELI1, subjected to 3 consecutive rounds of transduction, and transplanted into sublethally irradiated recipient mice (see Supplemental Methods for details). (B) Flow cytometric quantification of the GFP+ cell population in blood, LN, and BM of GFP or GFP-PELI1 recipient mice 25–30 weeks after BMT. (C and D) Representative macroscopic images showing thymic tumors and enlarged LNs of GFP-PELI1 recipient mice. Eμ-Myc-Tg mice were used as a positive control for lymphomagenesis. Ax, axillary; In, inguinal. (E) Representative flow cytometric analysis results for B220+ and CD3+ cell populations in the thymus of GFP and GFP-PELI1 recipient mice as well as Eμ-Myc-Tg mice. (F) Representative flow cytometric analysis for B220+ and CD3+ cell populations in LNs of GFP and GFP-PELI1 recipient mice. Ce, cervical. (G) Flow cytometric quantification of B220+ and CD3+ cell populations in LNs of control GFP (n = 4) and GFP-PELI1 (n = 5) recipient mice at 30 weeks after BMT (data represent mean ± SEM). *P < 0.05, **P < 0.01. (H) Representative images of IHC analyses for B220 antigen expression in LN and thymic tissue samples isolated from GFP and GFP-PELI1 recipient mice as well as Eμ-Myc-Tg mice. Original magnification, ×200; Scale bars: 200 μm.
Flow cytometry analysis using anti-B220 and anti-CD3 antibodies revealed that GFP-PELI1 recipient mice had a sharply increased proportion of B220+ lymphocytes in the thymus compared with that in GFP recipient controls. Notably, the proportion of B220+ lymphocytes in GFP-PELI1 recipient mice increased to almost as much as that in Eμ-Myc-Tg mice at approximately 21 weeks of age (Figure 3E). The proportion of B220+ lymphocytes also showed a significant increase in cervical, inguinal, and axillary LNs of GFP-PELI1 recipient mice relative to that in the GFP recipient control; conversely, the proportion of CD3+ lymphocytes was lower in GFP-PELI1 recipient LNs (Figure 3, F and G). In addition, immunohistochemical (IHC) analysis revealed that the lymphoid tissue of GFP-PELI1 recipient mice showed a marked increase in B220+ lymphocytes compared with GFP recipient and Eμ-Myc-Tg mice (Figure 3H). Together, these results demonstrate that PELI1 expression triggered B220+ lymphocyte infiltration, which was likely associated with lymphomagenesis and hematopoietic malignancy in these mice. However, GFP-PELI1 recipient mice developed apparent signs of some lymphoblastic (and potentially leukemic) disorder (e.g., rear-limb paresis) at >40 weeks after transduction, which indicates that PELI1-induced hematopoietic malignancies had a long latency period or were dose dependent. Taken together, these results suggest that PELI1 overexpression leads to malignant expansion of B cells and has some tumorigenic potential in vitro and in vivo.
PELI1 interacts with and promotes BCL6 induction by K63-mediated polyubiquitination.
In our initial approach to examining the molecular mechanism underlying PELI1 gain of function, we determined the expression profile of a series of representative marker molecules involved in the signaling pathway in B cell lymphomagenesis using splenic B220+ cells isolated from PELI1-Tg and littermate non-Tg mice (Supplemental Figure 4). Surprisingly, there was a major difference between control and PELI1-overexpressing B220+ cells with respect to induction of BCL6, the master regulator of mature B cells that is frequently overexpressed in B cell lymphomas.
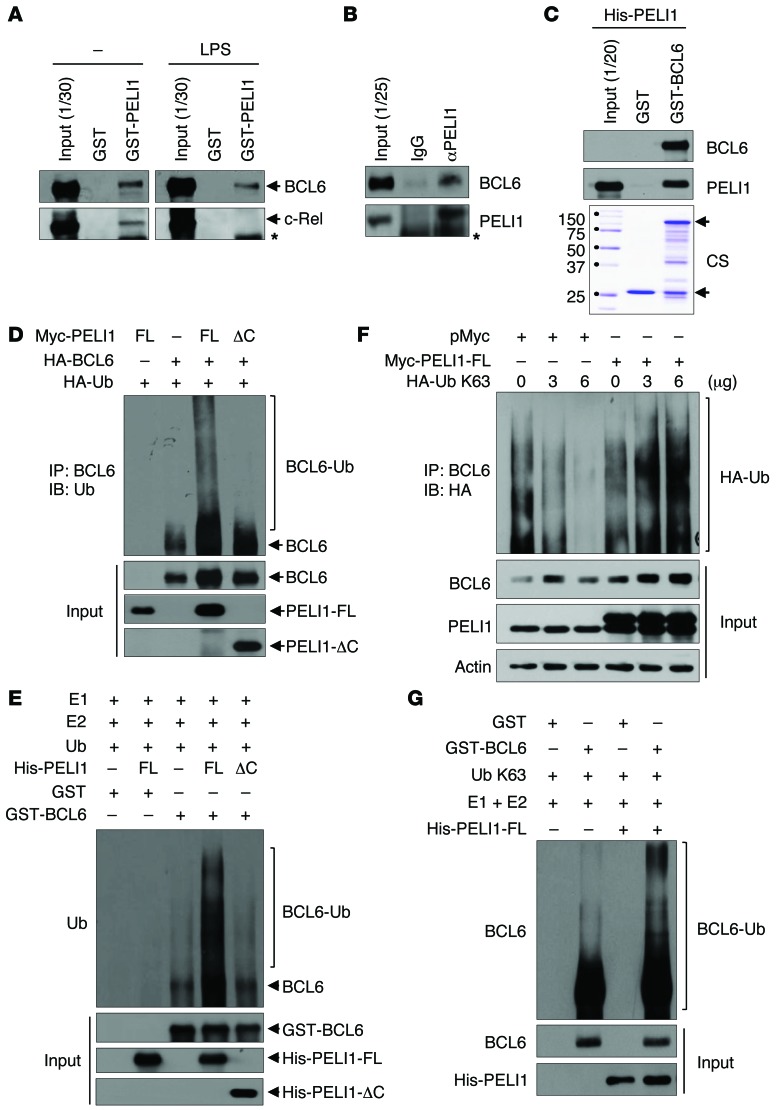
To determine how PELI1 regulates the stability of BCL6, the protein-protein interaction between PELI1 and BCL6 was examined. B lymphoblastic RL7 cells were cultured in the absence or presence of LPS, and cellular extracts were incubated with GST or GST-PELI1 (Figure 4A). Notably, the interaction between GST-PELI1 and endogenous BCL6 was detectable in both untreated and LPS-treated RL7 cells, which indicated that PELI1 formed a complex with BCL6. Cellular extracts were further immunoprecipitated with an anti-PELI1 antibody or normal IgG and through immunoblotting with an anti-BCL6 antibody. Higher PELI1 levels were consistently observed in the complex formed with BCL6 in LPS-treated RL7 cells (Figure 4B). A subsequent in vitro binding assay using purified His-tagged PELI1 (His-PELI1) and GST-BCL6 revealed that PELI1 interacted directly with BCL6 (Figure 4C).
Figure 4. PELI1 interacts with and induces K63-mediated BCL6 polyubiquitination.
(A) RL7 cells were stimulated or not with LPS for 24 hours, and lysates were incubated with GST or GST-PELI1. Bound proteins were resolved by SDS-PAGE and immunoblotted with anti-BCL6 and anti–c-Rel antibodies. Asterisk denotes nonspecific band. (B) RL7 cell lysates were immunoprecipitated with anti-PELI1 antibody and immunoblotted with anti-BCL6 and anti-PELI1 antibodies. Asterisk denotes nonspecific band. (C) GST (lower arrow) or GST-BCL6 (upper arrow) was incubated with purified His-PELI1 and subjected to immunoblotting with anti-BCL6 and anti-PELI1 antibodies. CS, Coomassie brilliant blue staining. (D) HeLa cells were transfected with Myc-PELI1-FL or Myc-PELI1-ΔC in combination with HA-Ub and HA-BCL6 expression plasmids. At 24 hours after transfection, cells were treated with LPS for 24 hours and harvested for immunoprecipitation with an anti-BCL6 antibody. The BCL6 protein complex was subjected to immunoblotting with an anti-Ub antibody. (E) Purified GST or GST-BCL6 was incubated with purified His-PELI1-FL or His-PELI1-ΔC in conjunction with E1, E2, and HA-Ub enzymes. Reaction mixtures were immunoblotted with an anti-BCL6 antibody. (F) RL7 cells were transfected with Myc-PELI1 or pMyc and HA-Ub K63 expression plasmids. At 24 hours after transfection, cells were treated with LPS and harvested for immunoprecipitation with an anti-BCL6 antibody. The BCL6 protein complex was subjected to immunoblotting with an anti-HA antibody. (G) Purified GST or GST-BCL6 was incubated with purified His-PELI1 in conjunction with E1, E2, and HA-Ub K63 enzymes. Reaction mixtures were immunoblotted with an anti-BCL6 antibody.
Expression plasmids encoding Myc-tagged full-length PELI1 (Myc-PELI1-FL) or a PELI1 C-terminal RING domain deletion mutant (amino acids 1–280; Myc-PELI1-ΔC) were transfected in combination with HA-tagged BCL6 (HA-BCL6) and HA-Ub expression plasmids into HeLa cells. Whereas overexpression of PELI1-FL clearly induced high-molecular-mass species of BCL6 polypeptides, namely a polyubiquitinated form of BCL6 (BCL6-Ub), overexpression of PELI1-ΔC did not (Figure 4D). Next, BCL6 ubiquitination was reconstituted in vitro. The purified His-PELI1-FL or His-PELI1-ΔC protein was incubated with GST or GST-BCL6 in the presence of purified E1, E2, and HA-Ub. The polyubiquitinated form of GST-BCL6 became evident after incubation with PELI1-FL, but not with PELI1-ΔC (Figure 4E). To further verify the K63-mediated ubiquitination of BCL6 by PELI1, expression plasmids encoding HA-Ub K63 were transfected in combination with the Myc-PELI1 expression plasmid into RL7 and HeLa cells (Figure 4F and Supplemental Figure 5). Overexpression of PELI1 with increasing amounts of HA-Ub K63 incrementally elevated the polyubiquitination level and stability of endogenous BCL6. We next reconstituted the polyubiquitination of BCL6 in vitro and found that the purified His-PELI1 protein promoted polyubiquitination of the GST-BCL6 protein in the presence of purified E1, E2, and HA-Ub K63 (Figure 4G). Taken together, these results indicate that PELI1 directly regulates the K63-mediated polyubiquitination of BCL6.
Correlation between PELI1 and BCL6 expression.
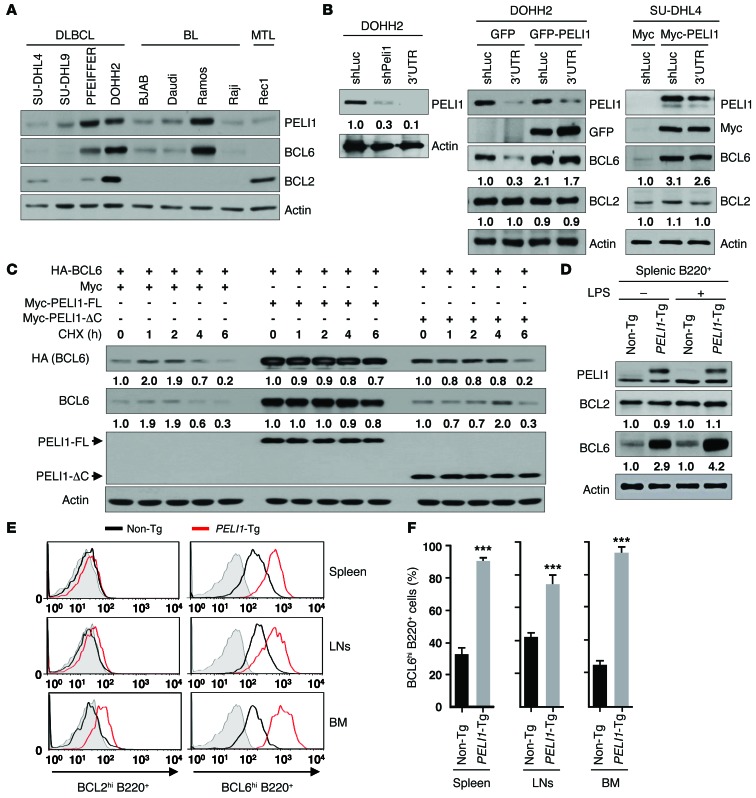
BCL6, a proto-oncogene implicated in the pathogenesis of B cell lymphomas, controls the transcription of various genes involved in B cell development, differentiation, and activation (11, 12). To clarify the relationship between PELI1 expression and BCL6 expression in human cancer, PELI1 and BCL6 expression levels in B cell lymphoma cells were examined. Immunoblot analysis using 9 B cell lymphoma cell lines — 4 DLBCL, 4 BL, and 1 mantle cell lymphoma (MTL) — unexpectedly revealed that most showed substantial positive correlations between PELI1 and BCL6 protein levels. More specifically, both PELI1 and BCL6 were expressed at high levels in PFEIFFER, DOHH2, and Ramos cells and at low levels in SU-DHL4, SU-DHL9, BJAB, Daudi, Raji, and Rec1 cells (Figure 5A). As expected, PELI1 expression was not significantly correlated with BCL2 expression in these cell lines. Furthermore, when PELI1 was depleted in DOHH2 cells or overexpressed in SU-DHL4 cells, PELI1 protein expression directly affected BCL6 expression or stability (Figure 5B). In addition, further overexpression of PELI1 in PELI1-depleted DOHH2 cells significantly recovered BCL6 protein levels, and further depletion of PELI1 in PELI1-overexpressed SU-DHL4 cells reduced them (Figure 5B).
Figure 5. PELI1 expression promotes BCL6 stabilization.
(A) Cellular extracts from 9 B cell lymphoma cell lines were immunoblotted with the indicated antibodies. (B) DOHH2 cells were transfected with control luciferase shRNA (shLuc), PELI1 shRNA (shPELI1; targeting PELI1 ORF), or 3′ untranslated region PELI1 shRNA (3′UTR; targeting PELI1 3′UTR) encoding construct in combination with the GFP or GFP-PELI1 expression plasmid, and SU-DHL4 cells were transfected with the pMyc or pMyc-PELI1 expression plasmid in combination with the shLuc or 3′UTR encoding construct. (C) HeLa cells were transfected with control pMyc, pMyc-PELI1-FL, or pMyc-PELI1-ΔC and HA-BCL6. At 24 hours after transfection, cells were cultured in the presence of LPS, further treated with cycloheximide (CHX), and lysed at the indicated times. (D) Splenic B220+ cells were isolated from non-Tg and PELI1-Tg mice and maintained in the absence or presence of LPS. At 24 hours after treatment, splenic B220+ cells were lysed and subjected to immunoblotting. In B–D, expression levels relative to the respective control are shown below blots. (E) B220+ cells were isolated from BM, LNs, and spleen of non-Tg and PELI1-Tg mice and maintained in the presence of LPS. B220+ cells were subjected to the intracellular staining of BCL2hi cells and BCL6hi cells. Gray area indicates isotype control staining. (F) Quantification of the BCL6hi cell population in the BM, LNs, and spleen by intracellular staining of non-Tg and PELI1-Tg mouse–derived B220+ cells. Data (mean ± SEM) are representative of 2 experiments with 3 mice per experiment. ***P < 0.001.
Given that BCL6 was highly upregulated in lymphoid tumors induced by PELI1 overexpression, the question of whether PELI1 would affect the stability of BCL6, potentially through its Ub ligase activity, was addressed. Immunoblot analysis of cellular lysates from HeLa cells transfected with Myc-PELI1-FL or Myc-PELI1-ΔC and HA-BCL6 expression plasmids revealed that PELI1-FL overexpression induced a marked increase in the level and stability of BCL6 compared with the control vector transfectant and PELI1-ΔC overexpression (Figure 5C). In addition, in the presence of cycloheximide, overexpression of PELI1-FL markedly maintained BCL6 steady-state levels, whereas control vector and PELI1-ΔC overexpression reduced them. However, the level or stability of BCL2 was almost unaffected by PELI1 overexpression (data not shown).
Surprisingly, the BCL6 level was more elevated in PELI1-overexpressing B cells than in control B cells. PELI1 and BCL6 expression levels were compared using purified splenic B220+ cells of PELI1-Tg and non-Tg mice. Again, immunoblot analysis revealed that BCL6 expression was more elevated in PELI1-overexpressing than control B220+ cells (Figure 5D). Intracellular staining of B220+ cells isolated from various lymphoid organs of PELI1-Tg mice, including BM, LNs, and spleen, revealed that the population of B220+ cells with elevated BCL6 levels (BCL6hiB220+) was about 1.5- to 5-fold higher than that in non-Tg lymphoid organs (Figure 5, E and F). However, there was no substantial difference between non-Tg and PELI1-Tg mice with respect to the BCL2hiB220+ cell population. These results indicate that PELI1 expression activated the induction of BCL6 and that the PELI1-mediated deregulation of BCL6 was associated with lymphoid malignancy.
B cell development in PELI1-Tg mice.
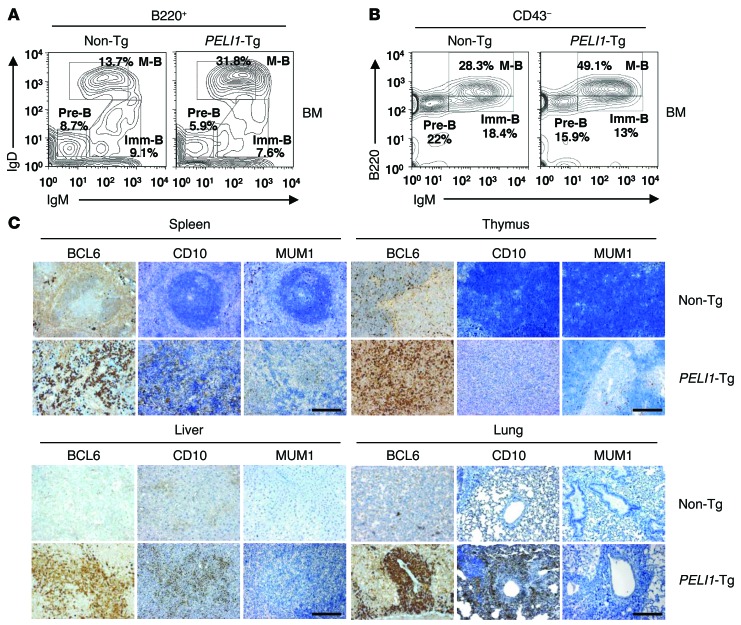
B cell development in the BM and spleen was analyzed using flow cytometry. There was no obvious difference in B220+ and CD3+ lymphocyte subpopulations in the BM and spleen between young PELI1-Tg and non-Tg mice (Supplemental Figure 6). However, old PELI1-Tg mice exhibited significant increases (average 2.4-fold increase compared with non-Tg) in B220-gated mature B cell populations (B220+IgMloIgD+) and decreases in pre-B cell (B220+IgM–IgD–) and/or immature B cell (B220+IgM+IgD–) populations (Figure 6A). Similarly, the population of CD43-gated mature B cells (B220hiCD43–IgM+) showed a substantial increase in PELI1-Tg versus non-Tg mice, whereas pre-B cell (B220+CD43–IgM–) and immature B cell (B220loCD43–IgM+) populations decreased (Figure 6B). These findings indicate that B cell–related tumor development in PELI1-overexpressing mice is related mainly to an increase in mature B cells.
Figure 6. Characterization of B cell lymphomas generated in PELI1-Tg mice.
(A) Flow cytometric analysis of B220, IgM, and IgD surface expression in BM cells isolated from 14-month-old non-Tg and PELI1-Tg mice. B220+-gated pre–B cell (Pre-B; IgM–IgD–), immature B cell (Imm-B; IgM+IgD–), and mature B cell (M-B; IgMloIgD+) cell populations are shown. (B) Flow cytometric analysis of B220, IgM, and CD43 surface expression in BM cells from non-Tg and PELI1-Tg mice. CD43–-gated pre–B cell (B220+IgM–), immature B cell (B220loIgM+), and mature B cell (B220hiIgM+) populations are shown. Data are representative of 3 independent experiments. (C) Representative images of IHC analyses for BCL6, CD10, and MUM1 antigen expression in splenic, thymic, liver, and lung tissue samples isolated from non-Tg and PELI1-Tg mice. Original magnification, ×200; Scale bars: 200 μm.
In lymphoid tissue, expression of the membrane metalloproteinase CD10 was largely restricted to GCB cells, but that of MUM1/IRF4 was limited to post-GCB cells (used herein to refer to both post-GCB cells and/or ABC-like malignancies) (11). Many studies have suggested a positive correlation between CD10 and BCL6 expression and a negative correlation between CD10 and MUM1/IRF4 expression (21). However, expression of BCL6 was associated with both GCB and post-GCB subtypes, which indicated that BCL6 expression was not completely restricted to GCB cells. IHC analysis revealed that most PELI1-Tg tumors stained positive for BCL6 and that there was a positive correlation between BCL6 and CD10 expression (Figure 6C). However, some PELI1-Tg tumors were also positive for MUM1 expression (with weaker nuclear staining), and others showed almost undetectable levels of MUM1 as a control non-Tg sample. Overall, the populations of the GCB phenotype (CD10+BCL6+MUM1– or CD10–BCL6+MUM1–) far exceeded those of the post-GCB phenotype (CD10–BCL6–MUM1+) in PELI1-Tg mice. In addition, quantitative PCR analysis on the PELI1-induced lymphoid tumors revealed increased expression of GCB versus post-GCB transcripts (Supplemental Figure 7). Collectively, these results indicate that tumors related to B cells arising in PELI1-overexpressing mice have multivariate features attributable to GCB- and post-GCB-malignancies, although these tumors appear to be allocated more to the GCB subset than to the post-GCB subset.
Correlation between PELI1 and BCL6 expression in human DLBCLs.
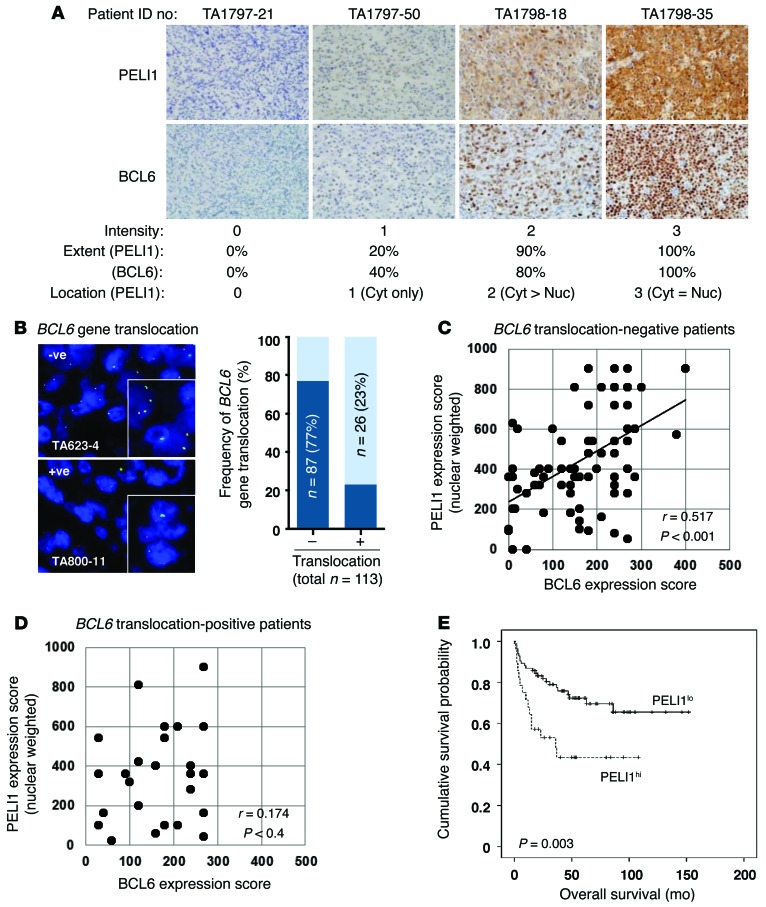
To further examine the relationship between PELI1 expression and BCL6 expression in human cancer, PELI1 and BCL6 levels were assessed in 113 patients with DLBCLs classified according to World Health Organization guidelines (Figure 7). DLBCLs represent the most common form of non-Hodgkin lymphomas (NHLs) worldwide, accounting for approximately 40% of all new cases of lymphomas and 68% of all NHL cases among adult patients in Korea (13, 22). In addition, BCL6 is known to facilitate lymphomagenesis of DLBCLs (12). The intensity of PELI1 expression was highly correlated with BCL6 expression, particularly in these 4 cases of DLBCL patients. Specifically, DLBCL patients with intense cytoplasmic and nuclear PELI1 expression showed high BCL6 expression (Figure 7A). In addition, DLBCL patients with moderate and weak expression of cytoplasmic and/or nuclear PELI1 protein showed parallel moderate and weak induction, respectively, of BCL6 protein. These results are indicative of an important positive correlation between PELI1 and BCL6 expression levels in DLBCLs.
Figure 7. Correlation between PELI1 and BCL6 expression, and OS according to PELI1 expression, in DLBCL patients.
(A) Representative images of IHC staining for PELI1 and BCL6 in the same DLBCL specimens. Original magnification, ×400. IHC staining results for PELI1 and BCL6 levels were scored according to the staining intensity, extent, and location of positive tumor cells (calculated only for PELI1). The PELI1hi group was defined as >10% tumor cells showing moderate to strong PELI1 expression equally in cytoplasm and nuclei. (B) Representative images of FISH using the BCL6 break-apart probe on paraffin sections of 113 DLBCL specimens. Each nucleus showed 2 yellow signals (no translocation signal) as well as 1 green signal and 1 red signal, indicative of a translocation signal at the BCL6 locus. Original magnification, ×1,000; ×1,500 (insets). (C and D) Scatter plot representations of correlation between PELI1 and BCL6 expression in BCL6 translocation–negative (n = 87) and BCL6 translocation–positive (n = 26) DLBCL cases. Spearman r and P values are indicated. (E) IHC staining for PELI1 proteins in 113 patients with DLBCLs. PELI1hi cases were defined by intensity (score of 2–3), extent (>10%), and location (score of 3) of PELI1 expression in tumor cells. Kaplan-Meier curve shows OS of PELI1hi (n = 85; 75% of cases) versus PELI1lo (n = 28; 25%) DLBCL patients (P = 0.003, log-rank test).
Notably, overexpression of BCL6 is frequently associated with some chromosomal rearrangement (20%–40% frequency) and somatic mutation (~14% frequency) in DLBCLs (12, 13). Among the 113 patients studied, 26 (23%) showed some BCL6 gene rearrangement by FISH (Figure 7B). Somatic mutation of the 5′-noncoding region of BCL6 was also examined: about 4.5% of BCL6 translocation–negative DLBCL patients showed some mutation at G170, G229, and C236 bases of the 5′-noncoding region of BCL6 (Supplemental Figure 8). However, it remains unclear whether these mutations affect BCL6 transcriptional activity.
IHC staining for PELI1 and BCL6 was scored according to staining intensity (scores ranging 0–3) and the extent of positive tumor cells (10% increments). In the case of PELI1, the localization of expression was also incorporated with weighting on nuclear expression, because BCL6 is exclusively expressed in the nucleus. IHC scores were obtained by multiplying the staining intensity, extent, and expression location of PELI1 and BCL6 (Figure 7C). We found that PELI1 expression scores positively correlated with those for BCL6 in BCL6 translocation–negative DLBCL patients, but not in BCL6 translocation–positive patients (Figure 7, C and D). That is, DLBCL patients without BCL6 translocation who exhibited intense cytoplasmic and nuclear PELI1 expression also showed a high level of BCL6 expression (Spearman r, 0.517; P < 0.001). These results demonstrate a significant positive correlation between PELI1 and BCL6 levels in DLBCLs. However, with DLBCL cases classified into GCB and non-GCB types using the Hans algorithm, PELI1 expression showed a positive correlation with BCL6 expression for both groups (Supplemental Tables 2 and 3).
PELI1 overexpression closely associates with poor prognosis in DLBCL patients.
We next examined the prognostic implications of PELI1 expression in DLBCLs. DLBCL patients were assigned to 2 groups based on their PELI1 expression. A receiver operating characteristic (ROC) curve analysis was conducted to determine the optimal cutoff point for 10% positive cells for PELI1 staining indices. Here, a patient was deemed PELI1hi if at least 10% of tumor cells expressed PELI1 with moderate to strong intensity and nuclear expression (Figure 7A and Supplemental Table 2); all other patients were PELI1lo. OS was compared between PELI1lo (up to 12.5 years) and PELI1hi (up to 9 years) groups (Figure 7E). Notably, OS reached almost 68%–70% in the PELI1lo group (at 60–120 months) after chemotherapy with cyclophosphamide, doxorubicin, vincristine, and prednisone (CHOP) or with combined CHOP plus rituximab (R-CHOP) therapy. Conversely, OS in the PELI1hi group gradually decreased over the long-term 120-month follow-up period (almost 42% decrease at approximately 36 months; P = 0.003; Figure 7E).
Among the 71 patients with R-CHOP treatment, PELI1hi status was also significantly associated with decreased OS (P = 0.045), similar to that of all 113 DLBCL patients in Kaplan-Meier survival analysis (Supplemental Figure 9). These observations are indicative of a relationship between PELI1 expression and poor survival rate in DLBCL patients, implying the prognostic value of PELI1 expression. According to a multivariate Cox regression analysis integrating various risk factors, including age, sex, stages, B symptoms, bulky diseases, BM involvement, BCL6 translocation, EBV in situ hybridization, number of extranodal sites, and PELI1 expression, PELI1hi status was an independent prognostic predictor of low OS (HR, 3.745; P = 0.001; Supplemental Table 4). In addition, PELI1hi was an independent prognostic indicator of international prognostic index score (hazard ratio, 2.443; P = 0.010). Together, these results indicate that PELI1 expression serves as a novel oncogenic signal and that PELI1 facilitates lymphomagenesis through BCL6 stabilization.
Discussion
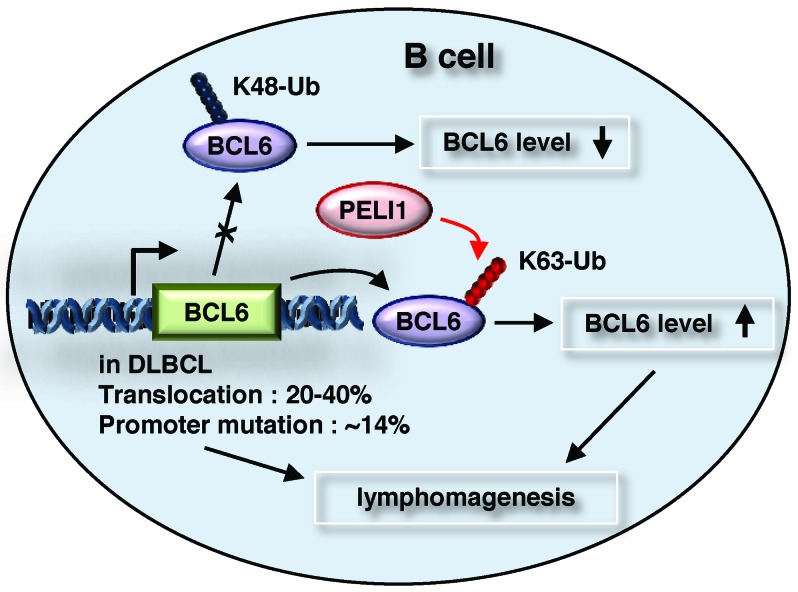
Many B cell lymphomas begin at the GC of B cells and by deregulation of BCL6 expression, which is induced by some chromosomal rearrangement (14, 15) and point mutation of the BCL6 promoter region (16). However, deregulation of BCL6 expression is not based solely on these genetic alterations. Recently, BCL6 has been found to be degraded by an SCF Ub ligase complex containing FBXO11, which is inactivated in DLBCLs (17). In the present study, PELI1 was found to upregulate oncogenic BCL6 by K63-linked polyubiquitination, and its expression constitutively activated ligand-independent B cell signal transduction and developed a variety of lymphoid tumors with prominent B cell infiltration. These results suggest that PELI1 expression may confer increased proliferative and tumorigenic advantages to B cells by activating BCL6 (Figure 8).
Figure 8. PELI1 induces B cell lymphomagenesis by activating BCL6 induction.
See Discussion for details.
PELI1 is a signal-responsive E3 Ub ligase that promotes the K48-linked polyubiquitination of c-Rel for ATP-dependent proteolysis by the proteasome (23), whereas K63-linked Ub chains mediate nonclassical, degradation-independent modifications (24), such as TRAF-6 activation (25). Recent studies suggested that the stimulation of BCR signaling in response to TLR3 and TLR4 agonists activates the expression and E3 ligase activity of PELI1 (6, 8, 9). Notably, the ligand-independent activation of receptor-mediated signal transduction plays an active role in the tumorigenic process in humans. In our current study, constitutive expression of PELI1 induced the ligand-independent hyperactivation of B cell signal transduction. In turn, PELI1 induced BCL6 upregulation and activated the proliferation and survival signaling of B cells. These findings suggest that PELI1 expression may be an important mechanism underlying oncogenic BCL6 overexpression in human B cell lymphomas. PELI2 and PELI3 are known to serve as E3 Ub ligases that catalyze K63-linked polyubiquitination (25); thus, it is likely that all PELI family proteins interact with and promote BCL6 induction by K63-mediated polyubiquitination.
The chronic or constitutive activation of signaling mediated by the BCR is a key process in lymphomagenesis induced by the activation of cell survival signals (26, 27). Therefore, the ability to induce this signaling is compatible with the survival of B cells and the development of a B cell tumor. The constitutive stimulation of BCR, CD40, and BAFF receptors and various TLRs activates the NF-κB pathway in B cells. Activation of NF-κB induces the expression of IRF4 and subsequently that of the master regulator of plasmacytic differentiation, BLIMP-1 (27, 28). In particular, BLIMP-1 inhibits BCL6 expression and vice versa, allowing the plasmacytic differentiation of B cells into a postmitotic state (28). In the present study, however, we found no significant correlation between BLIMP-1 and BCL6 expression levels in PELI1-overexpressing B cell lymphomas, which indicates that PELI1-mediated stabilization of BCL6 may be independent of IRF4–BLIMP-1 signaling and that constitutive expression of PELI1 may maintain BCL6 signaling activation, thereby providing B cells with the capacity to survive and proliferate.
BCL6 has emerged as a crucial GC regulator and is a frequently activated oncogene in the pathogenesis of DLBCLs arising from GC B cells (12). However, both GCB and post-GCB DLBCLs can harbor genetic and epigenetic mutations of BCL6, leading to BCL6 overexpression (29). The constitutive expression of BCL6 — which frequently depends on translocation in post-GCB DLBCLs that would normally be downregulating BCL6 (11) — is observed in the post-GCB subtype (21). This verifies that the distinct roles of BCL6 in the pathogenesis of DLBCLs may not be limited to specific cell-of-origin subtypes. Therefore, B cell lymphomagenesis induced by PELI1 overexpression may be linked to a variety of lymphoma subtypes expressing BCL6. Indeed, our present results revealed that PELI1 expression positively correlated with BCL6 expression not only in the GCB subtype, but also in the post-GCB subtype. In addition, a few PELI1-induced tumor samples had a “starry sky” appearance characteristic of BL, which suggests that PELI1 expression may be also associated with different lymphoma subtypes, including BL, that depend on specific cell-of-origin subtypes.
Activation of the transcription factor NF-κB is a central signaling event in TLR-mediated gene induction in B cells, but is significantly attenuated by PELI1 deficiency (2). Lack of NF-κB is associated with immune deficiencies, and abnormal NF-κB activation is associated with autoimmune diseases and cancer. In particular, activation of NF-κB signaling is susceptible to the avoidance of apoptotic cell death in the pathogenesis of certain B cell lymphomas, such as the ABC subtype of B cell lymphomas, Hodgkin’s lymphoma, primary mediastinal B cell lymphomas, lymphoid tissue lymphomas associated with the gastric mucosa, and multiple myeloma (11). However, aberrant activation of NF-κB signaling occurs in fewer than 10% of cases involving the GCB subtype (11), which indicates that constitutive activation of NF-κB signaling is not a common pathway by which GC B cell lymphoid malignancies avoid cell death. In the present study, mice constitutively expressing PELI1 displayed significant downregulation of upstream inhibitory (e.g., pIκBα and IKKα) and inactive precursor (e.g., NF-κB1 p105) molecules involved in classical NF-κB signaling (Supplemental Figure 4). However, we did not observe induction of active forms of NF-κB signaling, such as p65, in B cells of PELI1-Tg mice. This suggests that the lymphogenic survival signaling induced by constitutive PELI1 expression may be independent of the NF-κB pathway.
PELI1 expression is attenuated in normal B and T cells, but is activated in response to signaling mediated by BCRs, TCRs, and TLRs (2, 5, 6). In the current study, PELI1 expression was attenuated in various cell lines, except for some hematopoietic and immune cells, which is consistent with previous research (6) and suggests that PELI1 overexpression may occur in a cell type– or tissue-specific manner. The acquisition of genetic mutations that directly affect PELI1 transcription may not be the only mechanism used by B cells to regulate PELI1 expression. Indirect regulation of PELI1 expression may be achieved by targeting protein events involved in the posttranscriptional regulation of PELI1. In addition, the expression and activation of PELI1, which occurs in B cell lymphomas, may be induced by some chromosomal rearrangement joining the coding region of PELI1 to an Ig gene enhancer. This combination may result in PELI1 overexpression, which keeps cancer cells alive when they would otherwise die from a massive chromosome imbalance induced by PELI1 overexpression. Notably, molecular analysis of the rearranged IGH gene from lymphoma-bearing PELI1-Tg spleens revealed the presence of specific V(D)J rearrangements in 25% of cases (2 of 8; Supplemental Figure 10). In summary, our present findings suggest that tumors developing in PELI1-Tg mice are associated mainly with the activation and infiltration of B cells, possibly as a result of BCL6 induction, and with some lymphoid malignancy arising from the clonal malignant expansion of B cells. These results have important implications for understanding B cell lymphomagenesis through BCL6 induction by PELI1 and for developing effective therapeutic strategies for B cell lymphomas.
Methods
Further information can be found in Supplemental Methods.
Samples.
Patient samples of resected DLBCLs (113 total) were consecutively collected from the archive of the Department of Pathology at Seoul National University Hospital between 1997 and 2010. Clinical data were obtained from medical records, and approval was obtained from the Institutional Review Board of Seoul National University Hospital (H-1012-052-344). A tissue microarray (TMA) with a core 2 mm in diameter was constructed using FFPE tumor blocks and submitted to IHC and FISH.
Statistics.
Data were analyzed using GraphPad Prism (version 4.5; GraphPad Software) and presented as mean ± SEM. Statistical analysis was conducted using SPSS 12.0 and the IBM-SPSS Statistics software package (version 19.0; IBM Corp.). A P value less than 0.05 was considered significant.
Study approval.
All animal experiments were conducted in accordance with the guidelines of the IACUC of Sungkyunkwan University School of Medicine, which is accredited by the Association for Assessment and Accreditation of Laboratory Animal Care International (AAALAC International) and abides by Institute of Laboratory Animal Resources (ILAR) guidelines.
Supplementary Material
Acknowledgments
We thank Tae-Jin Kim, Myung Soo Kang, and Hong Tae Kim (Sungkyunkwan University) for providing materials and the Samsung Biomedical Research Institute for providing equipment, technical assistance, and financial support. This study was supported by National Research Foundation grants funded by the Korean government (MEST; 2011-0030043 and 2012M3A9A8053102) and by research grant no. 1220220 from the National R&D Program for Cancer Control, Ministry of Health and Welfare, Republic of Korea.
Footnotes
Conflict of interest: The authors have declared that no conflict of interest exists.
Reference information:J Clin Invest. 2014;124(11):4976–4988. doi:10.1172/JCI75667.
References
- 1.Schauvliege R, Janssens S, Beyaert R. Pellino proteins: Novel players in TLR and IL-1R signalling. J Cell Mol Med. 2007;11(3):453–461. doi: 10.1111/j.1582-4934.2007.00040.x. [DOI] [PMC free article] [PubMed] [Google Scholar]
- 2.Chang M, Jin W, Sun SC. Peli1 facilitates TRIF-dependent Toll-like receptor signaling and proinflammatory cytokine production. Nat Immunol. 2009;10(10):1089–1095. doi: 10.1038/ni.1777. [DOI] [PMC free article] [PubMed] [Google Scholar]
- 3.Conze DB, Wu CJ, Thomas JA, Landstrom A, Ashwell JD. Lys63-linked polyubiquitination of IRAK-1 is required for interleukin-1 receptor- and toll-like receptor-mediated NF-κB activation. Mol Cell Biol. 2008;28(10):3538–3547. doi: 10.1128/MCB.02098-07. [DOI] [PMC free article] [PubMed] [Google Scholar]
- 4.Moynagh PN. The Pellino family: IRAK E3 ligases with emerging roles in innate immune signalling. Trends Immunol. 2009;30(1):33–42. doi: 10.1016/j.it.2008.10.001. [DOI] [PubMed] [Google Scholar]
- 5.Schauvliege R, Janssens S, Beyaert R. Pellino proteins are more than scaffold proteins in TLR/IL-1R signalling: a role as novel RING E3-ubiquitin-ligases. FEBS Lett. 2006;580(19):4697–4702. doi: 10.1016/j.febslet.2006.07.046. [DOI] [PubMed] [Google Scholar]
- 6.Chang M, et al. The ubiquitin ligase Peli1 negatively regulates T cell activation and prevents autoimmunity. Nat Immunol. 2011;12(10):1002–1009. doi: 10.1038/ni.2090. [DOI] [PMC free article] [PubMed] [Google Scholar]
- 7.Siednienko J, et al. Pellino3 targets the IRF7 pathway and facilitates autoregulation of TLR3- and viral-induced expression of type I interferons. Nat Immunol. 2012;13(11):1055–1062. doi: 10.1038/ni.2429. [DOI] [PubMed] [Google Scholar]
- 8.Moynagh PN. Peli1 (rel)ieves autoimmunity. Nat Immunol. 2011;12(10):927–929. doi: 10.1038/ni.2108. [DOI] [PubMed] [Google Scholar]
- 9.Smith H, et al. The role of TBK1 and IKKepsilon in the expression and activation of Pellino 1. Biochem J. 2011;434(3):537–548. doi: 10.1042/BJ20101421. [DOI] [PMC free article] [PubMed] [Google Scholar]
- 10.Chiron D, Bekeredjian-Ding I, Pellat-Deceunynck C, Bataille R, Jego G. Toll-like receptors: Lessons to learn from normal and malignant human B cells. Blood. 2008;112(6):2205–2213. doi: 10.1182/blood-2008-02-140673. [DOI] [PMC free article] [PubMed] [Google Scholar]
- 11.Shaffer AL, 3rd, Young RM, Staudt LM. Pathogenesis of human B cell lymphomas. Annu Rev Immunol. 2012;30:565–610. doi: 10.1146/annurev-immunol-020711-075027. [DOI] [PMC free article] [PubMed] [Google Scholar]
- 12.Basso K, Dalla-Favera R. BCL6: master regulator of the germinal center reaction and key oncogene in B cell lymphomagenesis. Adv Immunol. 2010;105:193–210. doi: 10.1016/S0065-2776(10)05007-8. [DOI] [PubMed] [Google Scholar]
- 13.Sanchez-Beato M, Sanchez-Aguilera A, Piris MA. Cell cycle deregulation in B-cell lymphomas. Blood. 2003;101(4):1220–1235. doi: 10.1182/blood-2002-07-2009. [DOI] [PubMed] [Google Scholar]
- 14.Bastard C, et al. LAZ3 rearrangements in non-Hodgkin’s lymphoma: Correlation with histology, immunophenotype, karyotype, and clinical outcome in 217 patients. Blood. 1994;83(9):2423–2427. [PubMed] [Google Scholar]
- 15.Offit K, et al. Rearrangement of the bcl-6 gene as a prognostic marker in diffuse large-cell lymphoma. N Engl J Med. 1994;331(2):74–80. doi: 10.1056/NEJM199407143310202. [DOI] [PubMed] [Google Scholar]
- 16.Pasqualucci L, et al. Molecular pathogenesis of non-Hodgkin’s lymphoma: the role of Bcl-6. Leuk Lymphoma. 2003;44(suppl 3):S5–S12. doi: 10.1080/10428190310001621588. [DOI] [PubMed] [Google Scholar]
- 17.Duan S, et al. FBXO11 targets BCL6 for degradation and is inactivated in diffuse large B-cell lymphomas. Nature. 2012;481(7379):90–93. doi: 10.1038/nature10688. [DOI] [PMC free article] [PubMed] [Google Scholar]
- 18.Gerondakis S, Grumont RJ, Banerjee A. Regulating B-cell activation and survival in response to TLR signals. Immunol Cell Biol. 2007;85(6):471–475. doi: 10.1038/sj.icb.7100097. [DOI] [PubMed] [Google Scholar]
- 19.Pasare C, Medzhitov R. Control of B-cell responses by Toll-like receptors. Nature. 2005;438(7066):364–368. doi: 10.1038/nature04267. [DOI] [PubMed] [Google Scholar]
- 20.Harris AW, Pinkert CA, Crawford M, Langdon WY, Brinster RL, Adams JM. The E mu-myc transgenic mouse. A model for high-incidence spontaneous lymphoma and leukemia of early B cells. J Exp Med. 1988;167(2):353–371. doi: 10.1084/jem.167.2.353. [DOI] [PMC free article] [PubMed] [Google Scholar]
- 21.Coutinho R, et al. Poor concordance among nine immunohistochemistry classifiers of cell-of-origin for diffuse large B-cell lymphoma: implications for therapeutic strategies. Clin Cancer Res. 2013;19(24):6686–6695. doi: 10.1158/1078-0432.CCR-13-1482. [DOI] [PMC free article] [PubMed] [Google Scholar]
- 22.Park YH, et al. Improved therapeutic outcomes of DLBCL after introduction of rituximab in Korean patients. Ann Hematol. 2006;85(4):257–262. doi: 10.1007/s00277-005-0060-6. [DOI] [PubMed] [Google Scholar]
- 23.Chau V, et al. A multiubiquitin chain is confined to specific lysine in a targeted short-lived protein. Science. 1989;243(4898):1576–1583. doi: 10.1126/science.2538923. [DOI] [PubMed] [Google Scholar]
- 24.Hofmann RM, Pickart CM. Noncanonical MMS2-encoded ubiquitin-conjugating enzyme functions in assembly of novel polyubiquitin chains for DNA repair. Cell. 1999;96(5):645–653. doi: 10.1016/S0092-8674(00)80575-9. [DOI] [PubMed] [Google Scholar]
- 25.Butler MP, Hanly JA, Moynagh PN. Kinase-active interleukin-1 receptor-associated kinases promote polyubiquitination and degradation of the Pellino family: direct evidence for PELLINO proteins being ubiquitin-protein isopeptide ligases. J Biol Chem. 2007;282(41):29729–29737. doi: 10.1074/jbc.M704558200. [DOI] [PubMed] [Google Scholar]
- 26.Browne EP. Regulation of B-cell responses by Toll-like receptors. Immunology. 2012;136(4):370–379. doi: 10.1111/j.1365-2567.2012.03587.x. [DOI] [PMC free article] [PubMed] [Google Scholar]
- 27.Davis RE, et al. Chronic active B-cell-receptor signalling in diffuse large B-cell lymphoma. Nature. 2010;463(7277):88–92. doi: 10.1038/nature08638. [DOI] [PMC free article] [PubMed] [Google Scholar]
- 28.Crotty S, Johnston RJ, Schoenberger SP. Effectors and memories: Bcl-6 and Blimp-1 in T and B lymphocyte differentiation. Nat Immunol. 2010;11(2):114–120. doi: 10.1038/ni.1837. [DOI] [PMC free article] [PubMed] [Google Scholar]
- 29.Iqbal J, et al. Distinctive patterns of BCL6 molecular alterations and their functional consequences in different subgroups of diffuse large B-cell lymphoma. Leukemia. 2007;21(11):2332–2343. doi: 10.1038/sj.leu.2404856. [DOI] [PMC free article] [PubMed] [Google Scholar]
Associated Data
This section collects any data citations, data availability statements, or supplementary materials included in this article.


