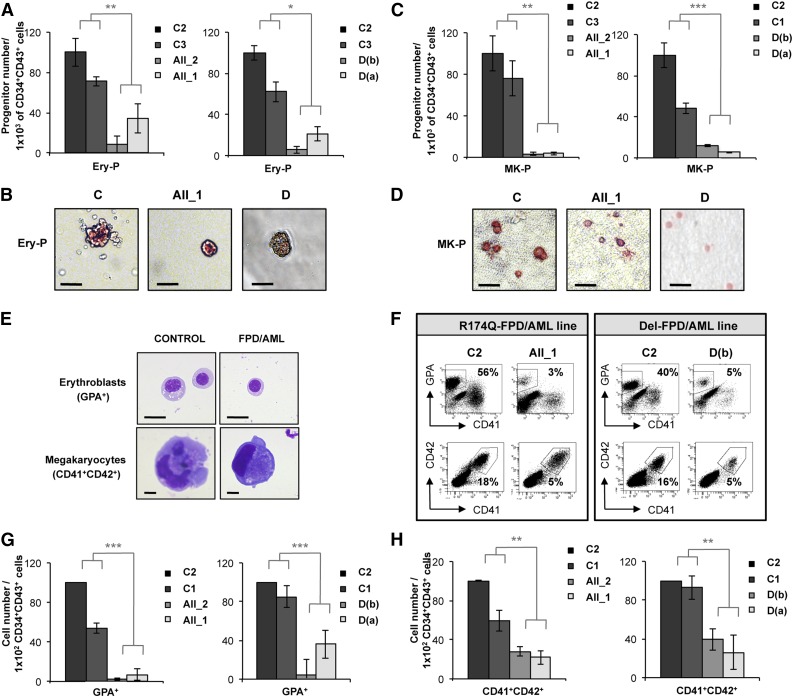
Figure 1.
Deep decrease in erythroid and MK potential of progenitors derived from FPD/AML iPSC lines. AII_1 and AII_2 are iPSC clones of 2 patients from pedigree A; D(a) and D(b) are 2 clones of 1 patient from pedigree D; and C1, C2, and C3 are control iPSC lines. Cell numbers were normalized in all experiments to those produced by the C2 clone, which was reported in each experiment as a fixed value of 100. (A-D) CD34+CD43+ cells sorted at day 11 and tested for their colony-forming potential. (A-B) Methylcellulose assay. (A) The histograms present the numbers of erythroid progenitors (Ery-P) in 1 representative experiment of 3, each in triplicate. (B) Pictures of primitive erythroid colonies (Ery-P). (C-D) Fibrin clot culture. (C) The histograms present the numbers of MK progenitors (MK-P) in 1 representative experiment of 4, each in triplicate. (D) Pictures of primitive MK colonies (MK-P) after CD41 immunostaining. (A,C) Error bars represent ± standard deviation (SD) of triplicate. (B,D) Scale bar = 50 μm. (E-H) Analysis of hematopoietic populations at day 18 from progenitors sorted at day 11. (E) May-Grünwald-Giemsa staining of erythroblasts (GPA+) and MKs (CD41+CD42+) derived from iPSC lines. Scale bar = 10 μm. (F) Fluorescence-activated cell sorter (FACS) analysis of erythroid cells and MKs from FPD/AML iPSC lines in 1 representative experiment. (G) Absolute number of generated erythroid cells normalized to 1 × 10² plated progenitors. The histograms show average of the cell number obtained in 5 independent experiments for pedigree A and 3 for pedigree D. (H) Absolute number of generated MKs normalized to 1 × 10² plated progenitors. The histograms show average of the cell number obtained in 3 independent experiments for both pedigrees. (G-H) Error bars represent ± SD of the average. *P < .05; **P < .01; ***P < .001; Student t test.

