Abstract
Inflammation plays a critical role in the pathology of obesity-linked insulin resistance and is mechanistically linked to the effects of macrophage-derived cytokines on adipocyte energy metabolism, particularly that of the mitochondrial branched-chain amino acid (BCAA) and tricarboxylic acid (TCA) pathways. To address the role of inflammation on energy metabolism in adipocytes, we used high fat-fed C57BL/6J mice and lean controls and measured the down-regulation of genes linked to BCAA and TCA cycle metabolism selectively in visceral but not in subcutaneous adipose tissue, brown fat, liver, or muscle. Using 3T3-L1 cells, TNFα, and other proinflammatory cytokine treatments reduced the expression of the genes linked to BCAA transport and oxidation. Consistent with this, [14C]-leucine uptake and conversion to triglycerides was markedly attenuated in TNFα-treated adipocytes, whereas the conversion to protein was relatively unaffected. Because inflammatory cytokines lead to the induction of endoplasmic reticulum stress, we evaluated the effects of tunicamycin or thapsigargin treatment of 3T3-L1 cells and measured a similar down-regulation in the BCAA/TCA cycle pathway. Moreover, transgenic mice overexpressing X-box binding protein 1 in adipocytes similarly down-regulated genes of BCAA and TCA metabolism in vivo. These results indicate that inflammation and endoplasmic reticulum stress attenuate lipogenesis in visceral adipose depots by down-regulating the BCAA/TCA metabolism pathway and are consistent with a model whereby the accumulation of serum BCAA in the obese insulin-resistant state is linked to adipose inflammation.
Obesity-linked type 2 diabetes and its associated health complications are major health care concerns worldwide and at the molecular level are linked to increased abundance and activity of classically activated macrophages and other immune cells in adipose tissue (1–3). Increased immune cells produce a chronic low-grade inflammatory state exemplified by elevated adipose TNFα, IL-6, IL-1β, and interferon (IFN)-γ primarily in visceral, and to a lesser extent, subcutaneous depots (4). The positive inflammatory poise of adipose tissue leads to the down-regulation of adipocyte genes linked to the antiinflammatory response system and an increase in mitochondrial reactive oxygen species (ROS), increased endoplasmic reticulum (ER) stress, and loss of electron transport activity (3, 5). Although the exact molecular mechanisms that tie ROS to insulin resistance are complex, the ROS-dependent activation of the unfolded protein response and the nuclear factor-κB (NF-κB)/c-Jun N-terminal kinase signaling pathways have been implicated by a variety of in situ and in vivo models (6–8).
Recent work has identified adipose tissue and adipocytes as a major contributor to whole-body, branched-chain amino acid catabolism (9). The branched-chain amino acids leucine, isoleucine, and valine are transported into adipocytes and metabolized in the mitochondria to form the anapleurotic intermediates acetyl-CoA and succinyl-CoA, thereby enabling maximal pyruvate metabolism to citrate and subsequent lipogenesis (10). Work by Herman et al. (9) have shown that adipocytes readily metabolize branched-chain amino acid (BCAA) to lipogenic precursors and that the maximal lipogenic rate requires replenishment of the TCA cycle. Recently metabolomic studies of human obesity and metabolic dysfunction have revealed a connection between circulating BCAAs and insulin resistance, and a variety of analyses have demonstrated that the accumulation of serum BCAA is a molecular biomarker of the insulin-resistant state (11–17). Moreover, Bcat2 knockout mice that are insulin resistant have elevated circulating BCAAs (18). In addition, elevated serum BCAA in the setting of a high-fat diet may activate the mammalian target of rapamycin-dependent serine phosphorylation of insulin receptor substrate-1 (19, 20). Although a variety of rodent and human studies have shown the branched-chain keto-acid dehydrogenase complex plays a pivotal role in BCAA metabolism, there is much still unknown about adipose tissue regulation of the BCAA pathway and the role of depot-specific functions (17). Herein we report a role of inflammation in controlling the BCAA/tricarboxylic acid (TCA) metabolism pathway, suggesting that the accumulation of leucine, isoleucine, and valine in the serum is, at least in part, a result of decreased BCAA and TCA cycle metabolism selectively in inflamed visceral adipose tissue.
Research Design and Methods
Animals
Male C57BL/6J mice were placed on a normal chow (∼4% fat by weight) or a high-fat (∼35% fat by weight; Bio-Serv F3282) diet at weaning (21). At 12–15 weeks of age, mice were killed by cervical dislocation, and tissues were harvested, frozen in liquid nitrogen, and stored at −80°C until further processing. The University of Minnesota Institutional Animal Care and Use Committee approved all experiments. The male thyroid response element-X-box binding protein 1 (Xbp1) and adipocyte-specific adiponectinP-rtTA transgenic mice (referred to as FIXs mice) were generated by the transgenic core facility at the University of Texas Southwestern Medical Center and described elsewhere (22, 23). Mice were maintained on a 12-hour dark, 12-hour light cycle from 6:00 am to 6:00 pm and housed in groups of no more than five with unlimited access to water and chow (2916; Teklad) or doxycycline-containing (600 mg/kg) chow diets (Bio-Serv) and induced with doxycycline for 48 hours.
Chemical reagents
Recombinant mouse TNFα, IL-6, IL-1β, and IFNγ were purchased from R&D Systems. Antibodies were obtained from commercial sources: β-actin from Sigma; and Bcat2, Sdha, Bckdha, and Atp5a from Abcam. Isotopes of leucine were purchased from PerkinElmer. Bay11–7085 was purchased from Cayman Chemical.
Quantitative RT-PCR
Expression of mRNA was measured by quantitative RT-PCR. Briefly, total RNA was isolated from tissue or 3T3-L1 adipocytes using Trizol reagent (Invitrogen Corp) according to the manufacturer's protocol. RNA was treated with deoxyribonuclease I, and cDNA was synthesized using an iScript cDNA synthesis kit (Bio-Rad Laboratories). Amplification was monitored with iQ SYBR Green Supermix and the MyiQ detection system (BioRad Laboratories). Data were analyzed using the –ΔΔcycle threshold method and normalized to transcription factor II element expression. Supplemental Table 1 contains the gene names, symbols, accession numbers, and primer sequences used to amplify and detect the target transcripts.
Cell culture
3T3-L1 fibroblasts were maintained and differentiated into adipocytes as described previously (24). Differentiation was induced by the addition of DMEM containing 10% fetal bovine serum, 0.5 mM methylisobutylxanthine, 0.25 μM dexamethasone, and 170 μM insulin. The methylisobutylxanthine and dexamethasone were removed after 2 days, and the insulin was removed after 4 days. The differentiated 3T3-L1 cells were maintained in DMEM with 10% fetal bovine serum and used in experiments 6–12 days after induction.
Leucine uptake and fractionation
Briefly, day 8 differentiated adipocytes were treated with 1 nM TNFα for 24 hours, serum starved for 2 hours in DMEM, and radioactive leucine added for 5–180 minutes. Total cellular uptake was measured using [3H(3,4)]-leucine, whereas incorporation into lipid and protein pools were measured using [14C(U)]-leucine. Fractionation of incorporated 14C-leucine was accomplished using a hexane-isopropanol-water (3:2:1) extraction in which lipids portioned into the organic phase, whereas radioactive protein was collected into the precipitate.
Metabolite extraction and analysis
Polar metabolites were extracted from cells or mouse serum using a chloroform-methanol extraction procedure. Serum was added to a 1.5-mL centrifuge tube containing 500 μL chloroform, 250 μL methanol, and 150 μL 0.9% sodium chloride. The mixture was vortexed and centrifuged at 13 000 × g for 10 minutes. The upper aqueous/methanol layer was removed to a new tube, and the chloroform layer was washed with 1:1 0.9% sodium chloride-methanol. Three milliliters of methanol were added to the aqueous phase to facilitate drying under nitrogen. The dried samples were stored at −80°C until nuclear magnetic resonance (NMR) analysis. Immediately prior to the NMR analysis, the dried powder/film was resuspended in 100 μL 100 mM sodium phosphate in D2O (pH 7.4) containing 20 μM trimethylsilyl propionic-2,2,3,3-day4 acid as a calibration standard.
NMR metabolite analysis
NMR experiments were performed at 25°C on a Bruker Avance III 700 MHz spectrometer with a 1.7 mm CryoProbe. One-dimensional noesy spectra were acquired with 128 transients using 65 536 data points under fully relaxed conditions. Assignments were made using Chenomx version 7.5. Spectra were exponentially line broadened by 1 Hz, Fourier transformed, and phase and baseline corrected. Spectra were calibrated to an internal 20 μM trimethylsilyl-tetradeuterosodium propionate standard to establish metabolite concentrations and as a chemical shift reference. Metabolite assignments were made according to the chemical shifts and pattern of coupling constants using the Chenomx compound library (Chenomx).
Immunoblot analysis
3T3-L1 adipocytes treated with and without TNFα were homogenized using a glass-teflon homogizer in homogenization buffer (20 mM Tris-HCl; 220 mM mannitol; 70 mM sucrose; 1 mM EDTA; 0.1 mM EGTA, pH 7.4) supplemented with protease inhibitors (Calbiochem). For Bcat2 analysis, homogenates were centrifuged at 700 × g to remove nuclei, unbroken cells, and the lipid cake and mitochondria recovered by further centrifugation at 12 000 × g. Equal amounts of protein were separated by SDS-PAGE, transferred to polyvinyl difluoride immobilon-FL (Millipore) membranes and blocked in Odyssey blocking buffer (LI-COR Biosciences). Membranes were incubated with infrared-conjugated secondary antibodies and visualized using Odyssey Infrared Imager (LI-COR Biosciences).
Statistical analysis
All values are expressed as mean ± SEM. Statistical significance was determined using the two-tailed Student t test assuming unequal variances, or where appropriate, a two-way ANOVA with Bonferroni post hoc analysis. Values of P < .05 are considered significant (*) with an increased significance of a value of P < .01 indicated (**).
Results
Obesity and inflammation down-regulate expression of genes linked to BCAA metabolism selectively in adipose tissue and cultured adipocytes
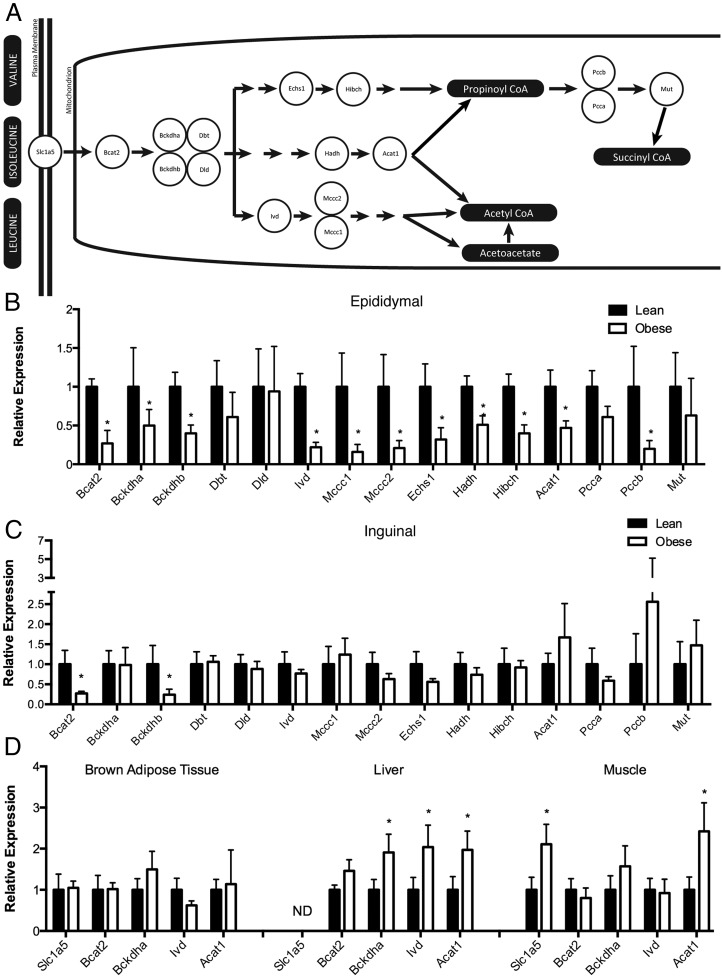
Our laboratory has recently demonstrated that macrophage-derived inflammatory factors down-regulate the expression of genes linked to antioxidant biology in adipocytes and lead to mitochondrial dysfunction (25). Moreover, in mouse models, oxidative stress is strongly biased toward the visceral relative to the subcutaneous depot in which inflammation is the greatest, antioxidant genes are down-regulated, reactive aldehydes accumulate, and protein carbonylation is increased (26). During the course of our studies, we also evaluated the expression of genes linked to BCAA metabolism in adipose tissue of high-fat-fed C57BL/6J mice and compared it with lean littermates. Figure 1A shows a schematic representation of the proteins involved in BCAA uptake and mitochondrial metabolism. Figure 1, B and C, show that relative to lean controls, the mRNA level of essentially every BCAA metabolism pathway protein was down-regulated in the epididymal adipose tissue of high-fat-fed mice but not in inguinal fat. To assess whether the down-regulation of the BCAA pathway gene expression was adipose specific, a panel of enzymes was profiled in brown fat, muscle, and liver, and expression was found to not be affected and, in the case of liver, was increased (Figure 1D). These results demonstrate the pathway-specific down regulation of the BCAA metabolism enzymes in visceral adipose tissue.
Figure 1.
Obesity down-regulates the expression of genes of BCAA metabolism. Schematic diagram of cellular BCAA metabolism (A) and expression of BCAA metabolism genes in epididymal (B) or inguinal white adipose tissue (C) in C57BL/6J mice maintained on a low-fat (filled bars) or high-fat (open bars) diet. D, Expression of BCAA metabolism genes in brown adipose tissue, liver, and gastrocnemius skeletal muscle tissue. Error bars represent SEM. *, P < .05 (n equals 6–12 per group).
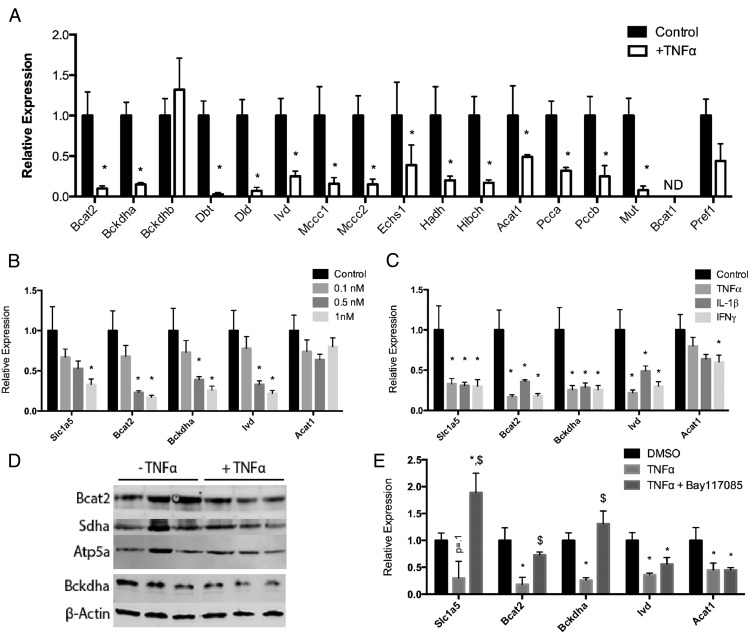
Immune cell-derived inflammatory factors have been shown to down-regulate many metabolic genes, and to determine the effect of cytokines on BCAA metabolism, we treated 3T3-L1 adipocytes with TNFα and measured the mRNA levels of genes linked to BCAA metabolism. Figure 2A shows that essentially the entire BCAA pathway is coordinately down-regulated in response to TNFα. In addition, the expression of preadipocyte markers, branched-chain amino acid transaminase 1 and preadipocyte factor 1, were not increased by TNFα treatment, indicating that dedifferentiation is not occurring (Figure 2A). We also observed a dose-dependent down-regulation with varying concentrations of TNFα (Figure 2B) and that other inflammatory factors (IL-6, IL-1β, and IFNγ) similarly down-regulated BCAA gene expression (Figure 2C). Furthermore, the expression of branched-chain amino-acid transaminase 2 (Bcat2), the enzyme responsible for the conversion of the BCAAs to their respective α-ketoacids, and the branched chain keto-acid dehydrogenase-α subunit were also reduced similarly at the protein level in response to TNFα (Figure 2D). Because TNFα activates the canonical NF-κΒ pathway, we evaluated whether restriction of the NF-κB pathway by inhibiting IκBα phosphorylation with Bay11–7085 would affect the expression of BCAA genes in response to TNFα. Figure 2E shows that for Slc1a5, Bcat2, and Bckdha, treatment of day 8 3T3-L1 adipocytes with Bay11–7085 attenuated the TNFα-driven down-regulation, suggesting that NF-κΒ plays a primary role in the decreased expression of the BCAA genes.
Figure 2.
Inflammatory factors down-regulate the expression of genes of BCAA metabolism. A, Expression of BCAA metabolism genes in 3T3-L1 adipocytes treated on day 8 after differentiation for 24 hours with 1 nM TNFα. B, Expression of BCAA metabolism genes in 3T3-L1 adipocytes treated on day 8 after differentiation for 24 hours with varying concentrations of TNFα. C, Expression of BCAA metabolism genes in 3T3-L1 adipocytes treated on day 8 after differentiation for 24 hours with 1 nM of the indicated cytokine. D, Expression of Bcat2, Sdha, Bckdha, Atp5a, and β-actin in 3T3-L1 adipocytes treated for 24 hours on day 8 after differentiation with 1 nM TNFα. E, Expression of BCAA metabolism genes in 3T3-L1s treated on day 8 after differentiation for 24 hours with 1 nM TNFα and 10 μM Bay11–7085. $, P < .05 compared with TNFα treatment. ND, not detectable. Error bars represent SEM. *, P < .05 compared with control (n = 6 per treatment group).
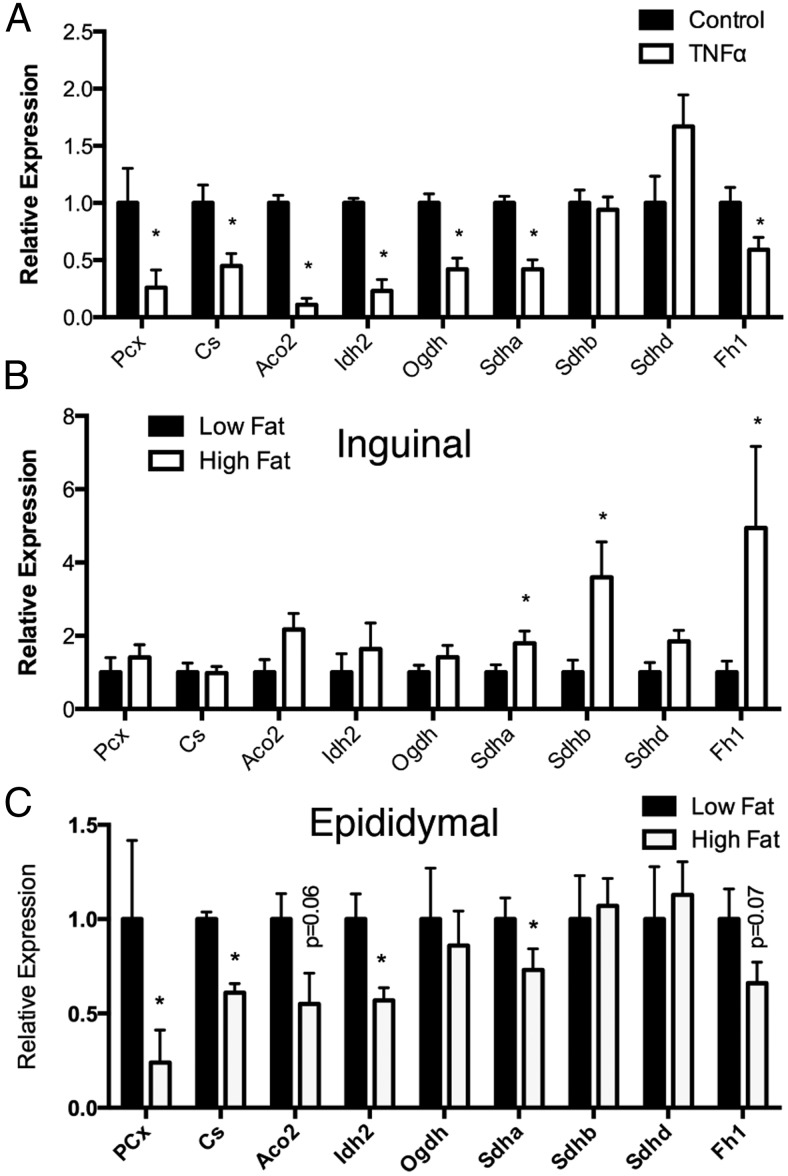
Because BCAA metabolism serves as a source of anaplerotic replenishment for the TCA cycle because leucine is metabolized to acetyl-CoA, isoleucine to acetyl-CoA, and succinyl-CoA and valine to succinyl-CoA, we characterized the mRNA expression of enzymes linked to the TCA cycle enzymes in TNFα treated 3T3-L1 adipocytes and similarly found nearly the entire pathway down-regulated in response to cytokine treatment (Figure 3A). Importantly, pyruvate carboxylase, the primary source of anaplerotic oxaloacetate, was similarly down-regulated. Similarly, succinate dehydrogenase α-subunit (Sdha) protein levels were also decreased after TNFα treatment (Figure 2D). Furthermore, we investigated the expression of the same panel of TCA enzymes in inguinal (Figure 3B) and epididymal (Figure 3C) white adipose tissue from chow and high-fat-fed mice and again found epididymal fat to have reduced levels of expression, whereas inguinal fat remained largely unaffected, if not increased. These results support the general consideration that inflammation drives the expansion of the subcutaneous depot while limiting the visceral depot through the targeted regulation of the BCAA and TCA cycle pathways.
Figure 3.
Obesity and inflammation down-regulate TCA cycle and anaplerotic reaction enzyme gene expression. A, Expression of TCA cycle metabolism genes in 3T3-L1 adipocytes treated with or without 1 nM TNFα for 24 hours. Expression of TCA cycle genes in inguinal white adipose tissue (B) and epididymal white adipose tissue (C) from low-fat or high-fat fed C57BL/6J mice. Error bars represent SEM. *, P < .05 (n = 6–12 per group).
Transport of BCAAs and the metabolic effect of enzyme down-regulation
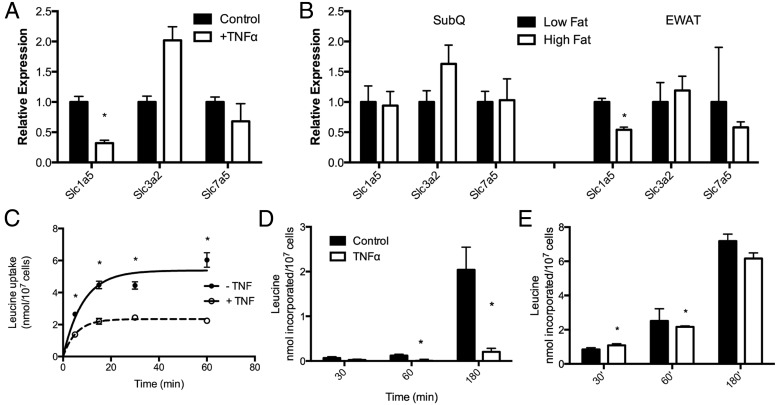
To parallel the analysis of gene expression in the BCAA pathway with metabolic processes, we evaluated BCAA transport. Two systems facilitate BCAA uptake into adipocytes. Slc1a5 mediates direct BCAA transport of leucine, isoleucine, and valine, whereas Slc3a2 and Slc7a5 form a heterodimeric plasma membrane complex exchanging internal glutamine and asparagine for external BCAA (27–30). As shown in Figure 4A, TNFα treatment of 3T3-L1 adipocytes down-regulated the expression of Slc1a5 but did not affect the expression of either Slc3a2 or Slc7a5. Furthermore, expression of Slc1a5 was selectively down-regulated in the epididymal, but not subcutaneous depot, of high-fat-fed mice (Figure 4B). To parallel the down-regulation of Slc1a5 with transport, we evaluated the [3H]-leucine uptake in response to TNFα treatment using the 3T3-L1 adipocyte system. Figure 3C shows that influx was diminished approximately 50% in TNFα-treated adipocytes. To further investigate the fate of the internalized leucine, we extracted the metabolites and monitored the metabolism of [14-C]-leucine into protein and lipid. Consistent with the down-regulation of the entire BCAA pathway, the conversion of the leucine into triglyceride was markedly attenuated (Figure 4D) whereas the conversion of the internalized leucine into protein was largely unaffected (Figure 4E).
Figure 4.
Leucine transport and metabolism in 3T3-L1 adipocytes. A, Expression of leucine transport proteins in 3T3-L1 adipocytes treated for 24 hours with 1 nM TNFα. B, Expression of leucine transport proteins in inguinal and epididymal white adipose tissue from mice maintained on chow (black bars) or high-fat diet (white bars) for 12 weeks. C, Total [3H]-leucine uptake in 3T3-L1 adipocytes treated with 1 nM TNFα. [14C]-leucine fractioned into lipid (D) or protein (E) after 24 hours TNFα treatment. Error bars represent SEM. *, P < .05 (n = 6 per group).
Intracellular metabolomics of TNFα-treated 3T3-L1 adipocytes
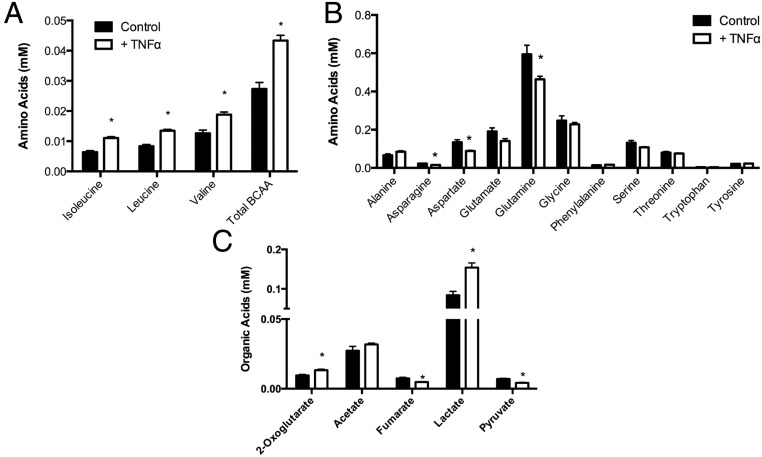
Because the metabolism of [14C]-leucine to lipid, but not protein, was markedly attenuated, we analyzed the steady-state level of intracellular metabolites as a mechanism toward understanding BCAA and TCA cycle metabolism. As shown in Figure 5A, we measured an accumulation of intracellular BCAAs in TNFα-treated 3T3-L1s compared with controls. Furthermore, intracellular glutamine and asparagine levels were reduced after TNFα treatment (Figure 5B), suggesting that the exchange of glutamine/asparagine for BCAAs through the Slc7a5/Slc3a2 transport system may be compensating for reduced transport through Slc1a5. Furthermore, a reduction asparagine synthetase, which is observed in adipose tissue of ob/ob mice, could explain the reduction in asparagine in TNFα-treated 3T3-L1 cells (31). In addition, we evaluated organic acid intermediates and measured an increase of 2-oxoglutarate, a decrease in fumarate and pyruvate, and increased lactate levels (Figure 5C), consistent with decreased activity of the TCA cycle.
Figure 5.
Metabolomics analysis of 3T3-L1 cells. 3T3-L1 adipocytes were treated for 24 hours with 1 nM TNFα and the intracellular levels of branched chain amino acids (A), amino acids (B), and organic acids (C) analyzed. Error bars represent SEM. *, P < .05 (n = 6 per group).
ER stress and the BCAA pathway
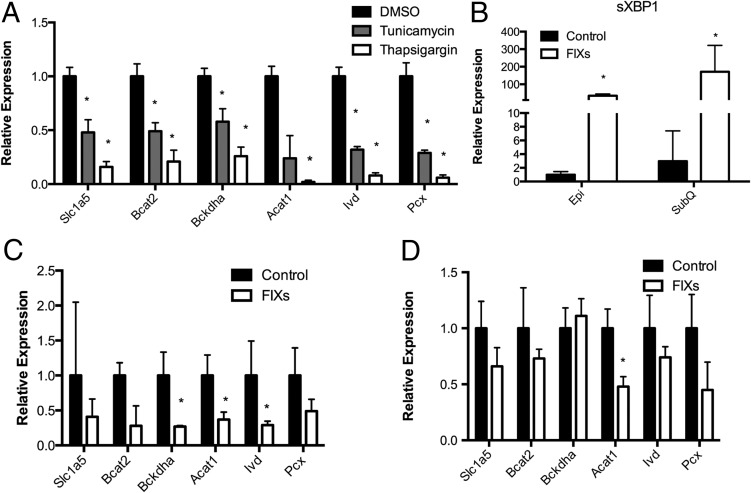
Because inflammatory cytokines induce ER stress in vivo and TNFα treatment of 3T3-L1 adipocytes similarly induces the unfolded protein response and activation of Jnk (32, 33), we evaluated the effect of ER stress on the BCAA pathway. Two experimental systems were used to probe the role of ER stress on the BCAA pathway. First, 3T3-L1 cells were treated with either tunicamycin or thapsigargin to induce an accumulation of nonglycosylated and therefore unfolded proteins or inhibit the sarcoendoplasmic reticulum Ca2+-ATPase, respectively. As shown in Figure 6A, treatment with either tunicamycin or thapsigargin led to the down-regulation of genes linked to the BCAA pathway. This result suggested that increased ER stress, or the ER stress response pathway, affects gene expression of targets linked to mitochondrial BCAA metabolism. Extending these observations, tunicamycin or thapsigargin also down-regulated several key antioxidant genes including Prdx3 and Gsta4 as well as the key mitochondrial transcriptional coactivator peroxisomal proliferator-activated receptor-γ coactivator 1α and mitochondrial biogenesis signal regulator endothelial nitric oxide synthase (data not shown). These results imply that ER stress reprograms mitochondrial systems broadly at the level of both mitochondrial biogenesis and metabolism. However, both tunicamycin and thapsigargin treatment may lead to secondary effects unrelated to ER stress, and as such we used a molecular genetic method specific to ER stress: the selective expression of spliced Xbp1 in adipose tissue.
Figure 6.
ER stress down-regulates BCAA metabolism genes. A, 3T3-L1 adipocytes were treated for 24 hours with 5 μM tunicamycin, 1 μM thapsigargin, or dimethylsulfoxide (DMSO), and the expression of BCAA/TCA genes were analyzed. B, Expression of spliced XBP1 in epididymal and subcutaneous fat of wild-type and FIXs mice. Expression of BCAA/TCA metabolism genes in wild-type and transgenic mice overexpressing spliced XBP1 maintained on a chow diet in the inguinal (C) or epididymal (D) depot are shown. Error bars represent SEM. *, P < .05 (n equals 4–8 per group).
Using transgenic mice expressing Xbp1s inducibly driven by the adiponectin promoter (referred to as FIXs mice), we evaluated subcutaneous and visceral adipose tissue from low-fat-fed FIXs and wild-type C57BL/6J mice for the regulation of genes linked to the BCAA pathway. Because adiponectin is expressed to high levels in subcutaneous adipose tissue as well as visceral depot, we assessed the expression of spliced and total Xbp1 in the two locales. As shown in Figure 6B, Xbp1s was expressed in both depots but to the highest levels in the subcutaneous site. Possibly with high level of Xbp1s mRNA in the subcutaneous depot, the expression of genes linked to the BCAA pathway was markedly decreased in subcutaneous fat (Figure 6C) while only moderately decreased in the visceral depot (Figure 6D). Similar to the results with tunicamycin and thapsigargin, the expression of key antioxidants Prdx3 and Gsta4 were markedly down-regulated in subcutaneous fat from the FIXs mouse as were the mitochondrial biogenesis regulators endothelial nitric oxide synthase and peroxisomal proliferator-activated receptor-γ coactivator 1α (data not shown). These results suggest that even under conditions of low-fat feeding during which ER stress is not developed, transgenic expression of Xbp1s drives the down-regulation of the BCAA pathway. These results suggest that ER stress can lead to the BCAA pathway down-regulation but does not demonstrate that ER stress is required for BCAA pathway control.
Discussion
The work described here profiles a previously unappreciated regulatory system controlling the branched-chain amino acid metabolism pathway and a potential explanation for the observation of elevated circulating BCAAs in insulin resistance and type 2 diabetes. It has been previously shown that elevated circulating BCAAs are one of the best predictive biomarkers for the development of type 2 diabetes, but it has been unclear as to the mechanistic basis of this observation (9, 13, 14). Previous work from Herman et al (9) has shown that reduced uptake of BCAA by adipose tissue may be sufficient to elevate circulating BCAA. However, it is not likely that mitochondrial dysfunction per se leads to insulin resistance because in many cases, mitochondrial dysfunction is compensated for by increased glycolysis and substrate-level phosphorylation that in turn reduces the serum glucose level (34).
To investigate the effect of inflammation on the BCAA pathway, we first assessed the expression of BCAA metabolism enzymes in adipose tissue from lean and obese mice. The expression of BCAA genes in the epididymal depots of mice maintained on high-fat diets were significantly down-regulated relative to lean control mice, whereas those in the inguinal depot were largely unaffected (Figure 1, B and C). The subcutaneous depot exhibited a trend toward the down-regulation of BCAA genes but clearly not to the same extent as does visceral fat. Similarly, 3T3-L1 adipocytes treated with the proinflammatory cytokine, TNFα, and demonstrated a coordinate down-regulation of essentially the entire pathway (Figure 2A), and the down-regulation was measured in response to other inflammatory factors, suggesting that inflammation broadly affects BCAA metabolism (Figure 2C). This effect was largely ablated when 3T3-L1s were cotreated with TNFα and Bay11–7085, suggesting the observed down-regulation is at least in part dependent on the NF-κB pathway (Figure 2E). Interestingly, IFNγ that is made by T cells also down-regulated adipocyte BCAA metabolism genes, indicating that cells other than inflammatory macrophages may play a role in affecting adipocyte lipid metabolism (Figure 2C). Functional analysis of BCAA metabolism using [14C]-leucine incorporation into lipid pools corroborated the loss of BCAA metabolism with essentially no effect on amino acid incorporation into protein (Figure 4, D and E). [3H]-leucine uptake is reduced approximately 50% due to the down-regulation of Slc1a5, but even when the data are normalized to uptake, conversion of leucine to lipid is dramatically reduced (Figure 4C). Moreover, because increased oxidative stress leads to potentiated carbonylation of BCAA pathway enzymes (34), the mechanism of decreased BCAA metabolism is likely a combination of both reduced expression and carbonylation of pathway enzymes. Consistent with reduced BCAA uptake but essentially no BCAA metabolism, the intracellular pool of BCAA was increased in TNFα-treated adipocytes (Figure 5A).
The TNFα-mediated down-regulation of mitochondrial metabolism was not restricted to the BCAA pathway. Indeed, our metabolomic analysis of TNFα-treated 3T3-L1 adipocytes also revealed changes in the TCA cycle intermediates (Figure 5C). Moreover, the expression of several TCA cycle enzymes was down-regulated at the mRNA level after TNFα treatment (Figure 3A), and each of the TCA cycle enzymes is carbonylated under conditions of increased oxidative stress (34). The same pattern of TCA cycle enzymes being down-regulated was evident in visceral adipose tissue. It should also be stressed that the key enzyme controlling mitochondrial oxaloacetate, pyruvate carboxylase, is significantly down-regulated in epididymal fat and TNFα treated adipocytes (Figure 3A and 3C). Because pyruvate carboxylase is a key lipogenic enzyme mediating the metabolism of glucose-derived pyruvate, the results are also consistent with a decreased flux of glucose into triglyceride in response to inflammation. However, TCA cycle enzyme gene expression is increased in subcutaneous adipose tissue (Figure 3B), implying that inflammation biases nutrient uptake and metabolism away from the visceral depot and toward the sc depot due to the attenuation of de novo lipogenesis.
In many systems mitochondrial dysfunction is correlated with an increase in ER stress (35, 36). To determine whether ER stress could influence mitochondrial dysfunction, specifically BCAA metabolism, via regulation of the BCAA metabolism pathway, we used both pharmacological and molecular genetic methods to induce ER stress. Figure 6 shows that the pharmacological activation of ER stress either via inhbition of glycosylation (tunicamycin) or by inhibition of calcium reuptake (thapsigargin) resulted in a down-regulation of BCAA metabolism genes in the 3T3-L1 cell culture system. Extending this analysis in vivo, adipose-specific overexpression of spliced XBP1 (FIXs) resulted in a down-regulation of BCAA genes largely in subcutaneous adipose depots in which XBP1s is expressed at the mRNA level to the greatest extent (Figure 6B). Interestingly, such mice also exhibit increased plasma leucine levels (Deng, Y., and P. E. Scherer, manuscript in preparation), suggesting that ER stress is sufficient to cause adipose mitochondrial dysfunction as well as decreased BCAA metabolism.
In summary, our results suggest that inflammation regulates BCAA metabolism and lipogenesis in visceral adipose tissue. Furthermore, the results presented suggest that within the context of adult fat pad expansion, inflammation limits visceral adipose tissue while allowing for continued expansion of the subcutaneous depot via depot-specific regulation of mitochondrial metabolism.
Acknowledgments
We thank the members of the Bernlohr research group, who provided helpful suggestions regarding this work, as well as the Minnesota Supercomputing Institute for support in the data analysis. We also thank Todd Rappe and the Minnesota NMR Center for assistance with the data collection and metabolomic analyses. We also thank Drs Fredric Kraemer (Stanford University) and Christopher Lynch (Penn State University) for helpful discussions.
This work was supported by National Institutes of Health Grants R01 DK084669 (to D.A.B.), P01 DK088761 (to P.E.S.) and the Minnesota Obesity Center (National Institutes of Health Grant P30 DK050456).
Disclosure Summary: The authors have nothing to disclose.
Footnotes
- BCAA
- branched-chain amino acid
- Bcat2
- branched-chain amino-acid transaminase 2
- ER
- endoplasmic reticulum
- IFN
- interferon
- NF-κB
- nuclear factor-κB
- NMR
- nuclear magnetic resonance
- ROS
- reactive oxygen species
- Sdha
- succinate dehydrogenase α-subunit
- TCA
- tricarboxylic acid
- Xbp1
- X-box binding protein 1.
References
- 1. Ogden CL, Carroll MD, Kit BK, Flegal KM. Prevalence of obesity and trends in body mass index among US children and adolescents, 1999–2010. JAMA. 2012;307(5):483–490. [DOI] [PMC free article] [PubMed] [Google Scholar]
- 2. Matsuzawa Y. The metabolic syndrome and adipocytokines. FEBS Lett. 2006;580(12):2917–2921. [DOI] [PubMed] [Google Scholar]
- 3. Schipper HS, Prakken B, Kalkhoven E, Boes M. Adipose tissue-resident immune cells: key players in immunometabolism. Trends Endocrinol Metab. 2012;23(8):407–415. [DOI] [PubMed] [Google Scholar]
- 4. Maury E, Brichard SM. Adipokine dysregulation, adipose tissue inflammation and metabolic syndrome. Mol Cell Endocrinol. 2010;314(1):1–16. [DOI] [PubMed] [Google Scholar]
- 5. Guilherme A, Virbasius JV, Puri V, Czech MP. Adipocyte dysfunctions linking obesity to insulin resistance and type 2 diabetes. Nat Rev Mol Cell Biol. 2008;9(5):367–377. [DOI] [PMC free article] [PubMed] [Google Scholar]
- 6. Houstis N, Rosen ED, Lander ES. Reactive oxygen species have a causal role in multiple forms of insulin resistance. Nature. 2006;440(7086):944–948. [DOI] [PubMed] [Google Scholar]
- 7. Furukawa S, Fujita T, Shimabukuro M, et al. Increased oxidative stress in obesity and its impact on metabolic syndrome. J Clin Invest. 2004;114(12):1752–1761. [DOI] [PMC free article] [PubMed] [Google Scholar]
- 8. Anderson EJ, Lustig ME, Boyle KE, et al. Mitochondrial H2O2 emission and cellular redox state link excess fat intake to insulin resistance in both rodents and humans. J Clin Invest. 2009;119(3):573–581. [DOI] [PMC free article] [PubMed] [Google Scholar]
- 9. Herman MA, She P, Peroni OD, Lynch CJ, Kahn BB. Adipose tissue branched chain amino acid (BCAA) metabolism modulates circulating BCAA levels. J Biol Chem. 2010;285(15):11348–11356. [DOI] [PMC free article] [PubMed] [Google Scholar]
- 10. Newgard CB. Interplay between lipids and branched-chain amino acids in development of insulin resistance. Cell Metab. 2012;15(5):606–614. [DOI] [PMC free article] [PubMed] [Google Scholar]
- 11. Batch BC, Shah SH, Newgard CB, et al. Branched chain amino acids are novel biomarkers for discrimination of metabolic wellness. Metab Clin Exp. 2013;62(7):961–969. [DOI] [PMC free article] [PubMed] [Google Scholar]
- 12. Sears DD, Hsiao G, Hsiao A, et al. Mechanisms of human insulin resistance and thiazolidinedione-mediated insulin sensitization. Proc Natl Acad Sci USA. 2009;106(44):18745–18750. [DOI] [PMC free article] [PubMed] [Google Scholar]
- 13. Newgard CB, An J, Bain JR, et al. A branched-chain amino acid-related metabolic signature that differentiates obese and lean humans and contributes to insulin resistance. Cell Metab. 2009;9(4):311–326. [DOI] [PMC free article] [PubMed] [Google Scholar]
- 14. Wang TJ, Larson MG, Vasan RS, et al. Metabolite profiles and the risk of developing diabetes. Nat Med. 2011;17(4):448–453. [DOI] [PMC free article] [PubMed] [Google Scholar]
- 15. Magkos F, Bradley D, Schweitzer GG, et al. Effect of Roux-en-Y gastric bypass and laparoscopic adjustable gastric banding on branched-chain amino acid metabolism. 2013;62(8):2757–2761. [DOI] [PMC free article] [PubMed] [Google Scholar]
- 16. McCormack SE, Shaham O, McCarthy MA, et al. Circulating branched-chain amino acid concentrations are associated with obesity and future insulin resistance in children and adolescents. Pediatr Obes. 2013;8(1):52–61. [DOI] [PMC free article] [PubMed] [Google Scholar]
- 17. Lackey DE, Lynch CJ, Olson KC, et al. Regulation of adipose branched-chain amino acid catabolism enzyme expression and cross-adipose amino acid flux in human obesity. Am J Physiol Endocrinol Metab. 2013;304(11):E1175–E1187. [DOI] [PMC free article] [PubMed] [Google Scholar]
- 18. Zhou Y, Jetton TL, Goshorn S, Lynch CJ, She P. Transamination is required for α-ketoisocaproate but not leucine to stimulate insulin secretion. J Biol Chem. 2010;285(44):33718–33726. [DOI] [PMC free article] [PubMed] [Google Scholar]
- 19. She P, Zhou Y, Zhang Z, Griffin K, Gowda K, Lynch CJ. Disruption of BCAA metabolism in mice impairs exercise metabolism and endurance. J Appl Physiol. 2010;108(4):941–949. [DOI] [PMC free article] [PubMed] [Google Scholar]
- 20. She P, Reid TM, Bronson SK, et al. Disruption of BCATm in mice leads to increased energy expenditure associated with the activation of a futile protein turnover cycle. Cell Metab. 2007;6(3):181–194. [DOI] [PMC free article] [PubMed] [Google Scholar]
- 21. Surwit RS, Kuhn CM, Cochrane C, McCubbin JA, Feinglos MN. Diet-induced type II diabetes in C57BL/6J mice. Diabetes. 1988;37(9):1163. [DOI] [PubMed] [Google Scholar]
- 22. Sun K, Wernstedt Asterholm I, et al. Dichotomous effects of VEGF-A on adipose tissue dysfunction. Proc Natl Acad Sci USA. 2012;109(15):5874–5879. [DOI] [PMC free article] [PubMed] [Google Scholar]
- 23. Deng Y, Wang ZV, Tao C, et al. The Xbp1s/GalE axis links ER stress to postprandial hepatic metabolism. J Clin Invest. 2012;123(1):455–468. [DOI] [PMC free article] [PubMed] [Google Scholar]
- 24. Student AK, Hsu RY, Lane MD. Induction of fatty acid synthetase synthesis in differentiating 3T3-L1 preadipocytes. J Biol Chem. 1980;255(10):4745. [PubMed] [Google Scholar]
- 25. Hahn WS, Kuzmicic J, Burrill JS, et al. Proinflammatory cytokines differentially regulate adipocyte mitochondrial metabolism, oxidative stress, and dynamics. Am J Physiol Endocrinol Metab. 2014;306(9):E1033–E1045. [DOI] [PMC free article] [PubMed] [Google Scholar]
- 26. Long EK, Olson DM, Bernlohr DA. High-fat diet induces changes in adipose tissue trans-4-oxo-2-nonenal and trans-4-hydroxy-2-nonenal levels in a depot-specific manner. Free Radic Biol Med. 2013;63:390–398. [DOI] [PMC free article] [PubMed] [Google Scholar]
- 27. Segawa H, Fukasawa Y, Miyamoto K, Takeda E, Endou H, Kanai Y. Identification and functional characterization of a Na+-independent neutral amino acid transporter with broad substrate selectivity. J Biol Chem. 1999;274(28):19745–19751. [DOI] [PubMed] [Google Scholar]
- 28. Utsunomiya-Tate N, Endou H, Kanai Y. Cloning and functional characterization of a system ASC-like Na+-dependent neutral amino acid transporter. J Biol Chem. 1996;271(25):14883–14890. [DOI] [PubMed] [Google Scholar]
- 29. Kanai Y, Segawa H, Miyamoto KI, Uchino H, Takeda E, Endou H. Expression cloning and characterization of a transporter for large neutral amino acids activated by the heavy chain of 4F2 antigen (CD98). J Biol Chem. 1998;273(37):23629–23632. [DOI] [PubMed] [Google Scholar]
- 30. Fuchs BC, Bode BP. Amino acid transporters ASCT2 and LAT1 in cancer: partners in crime? Semin Cancer Biol. 2005;15(4):254–266. [DOI] [PubMed] [Google Scholar]
- 31. Keller MP, Choi Y, Wang P, et al. A gene expression network model of type 2 diabetes links cell cycle regulation in islets with diabetes susceptibility. Genome Res. 2008;18(5):706–716. [DOI] [PMC free article] [PubMed] [Google Scholar]
- 32. Xue X, Piao J-H, Nakajima A, et al. Tumor necrosis factor α (TNFα) induces the unfolded protein response (UPR) in a reactive oxygen species (ROS)-dependent fashion, and the UPR counteracts ROS accumulation by TNFα. J Biol Chem. 2005;280(40):33917–33925. [DOI] [PubMed] [Google Scholar]
- 33. Baregamian N, Song J, Bailey CE, Papaconstantinou J, Evers BM, Chung DH. Tumor necrosis factor-α and apoptosis signal-regulating kinase 1 control reactive oxygen species release, mitochondrial autophagy and c-Jun N-terminal kinase/p38 phosphorylation during necrotizing enterocolitis. Oxid Med Cell Longev. 2009;2(5):297–306. [DOI] [PMC free article] [PubMed] [Google Scholar]
- 34. Curtis JM, Hahn WS, Stone MD, et al. Protein carbonylation and adipocyte mitochondrial function. J Biol Chem. 2012;287(39):32967–32980. [DOI] [PMC free article] [PubMed] [Google Scholar]
- 35. Yuzefovych LV, Musiyenko SI, Wilson GL, Rachek LI. Mitochondrial DNA damage and dysfunction, and oxidative stress are associated with endoplasmic reticulum stress, protein degradation and apoptosis in high fat diet-induced insulin resistance mice. Santos J, ed. PLoS One. 2013;8(1):e54059. [DOI] [PMC free article] [PubMed] [Google Scholar]
- 36. Lim JH, Lee HJ, Ho Jung M, Song J. Coupling mitochondrial dysfunction to endoplasmic reticulum stress response: a molecular mechanism leading to hepatic insulin resistance. Cell Signal. 2009;21(1):169–177. [DOI] [PubMed] [Google Scholar]


