

Abstract
Pancreatic β-cells with severely knocked down cytosolic malic enzyme (ME1) and mitochondrial NAD(P) malic enzyme (ME2) show normal insulin secretion. The mitochondrial NADP malic enzyme (ME3) is very low in pancreatic β-cells, and ME3 was previously thought unimportant for insulin secretion. Using short hairpin RNAs that targeted one or more malic enzyme mRNAs in the same cell, we generated more than 25 stable INS-1 832/13-derived insulin cell lines expressing extremely low levels of ME1, ME2, and ME3 alone or low levels of two of these enzymes in the same cell line. We also used double targeting of the same Me gene to achieve even more severe reduction in Me1 and Me2 mRNAs and enzyme activities than we reported previously. Knockdown of ME3, but not ME1 or ME2 alone or together, inhibited insulin release stimulated by glucose, pyruvate or 2-aminobicyclo [2,2,1]heptane-2-carboxylic acid-plus-glutamine. The data suggest that ME3, far more than ME1 or ME2, is necessary for insulin release. Because ME3 enzyme activity is low in β-cells, its role in insulin secretion may involve a function other than its ME catalytic activity.
Malic enzymes catalyze the oxidative decarboxylation of malate to produce pyruvate and a reduced pyridine nucleotide cofactor. Pancreatic β-cells contain three malic enzyme (ME) activities that show a high degree of amino acid identity. One malic enzyme is located in the cytosol (ME1) and two are located in the mitochondria (ME2 and ME3). ME1 and ME3 both are maximally active at a low concentration of their substrate malate and require nicotinamide adenine dinucleotide phosphate (NADP) as a cofactor. Their amino acid sequences are 68% identical. ME2 can use either nicotinamide adenine dinucleotide (NAD) or NADP as a cofactor and for maximal activity requires a high concentration of malate as well as fumarate as an allosteric activator. Its amino acid sequence is 56% identical to ME1 and 53% identical to ME3. The enzyme activities of ME1 and ME2 are abundant in pancreatic islets and insulin cell lines and the mRNA and enzyme activity of ME3 are low (1–4). Although ME3 protein can be detected in pancreatic β-cells with immunoblotting, its enzyme activity is so low in three-times-washed preparations of mitochondria that it cannot even be distinguished from ME2 activity at a very low concentration of malate or possible slight contamination of mitochondria with ME1 (3).
The cytosolic malic enzyme (ME1) has been proposed to play an important role in insulin secretion. However, there are conflicting reports on the role of ME1 and ME2 in insulin secretion in the rat insulinoma INS-1 832/13 cell line and rat and mouse pancreatic islets (2, 4–11). Although, the mouse strain Mod-1 lacks the cytosolic malic enzyme (ME1) in all tissues, its blood glucose and insulin levels are normal and glucose-stimulated insulin release in the islets of this mouse is normal (8, 9). It was reported that lowering ME1 activity in INS-1 832/13 cells decreased insulin secretion in response to stimulation with glucose or glutamine plus leucine (4). It was also reported that knockdown of Me1 mRNA decreased glucose-stimulated insulin secretion in the INS-1 832/13 cell line but not in rat pancreatic islets (9). Moreover, Me2 mRNA knockdown was reported by one group to affect amino acid-stimulated insulin secretion but not glucose-stimulated insulin secretion (4) and by another group to affect glucose-stimulated secretion due to an inhibition of cell growth in INS-1 derived cell lines (9). We previously used stably short hairpin RNA (shRNA) plasmids integrated into the INS-1 832/13 cell line genome to generate cell lines with permanent severe reduction of ME1 or ME2 enzyme activities. These cell lines with stable knockdown of either ME1 or ME2 enzyme activities had normal levels of Me3 mRNA relative to control cell lines and showed no evidence of altered insulin release (1). This led us to conclude that neither the ME1 nor the ME2 enzyme was important for insulin secretion; otherwise, there is considerable redundancy among functions of these enzymes and other enzymes.
In the current study, we further investigated the role of the cytosolic ME1 and the mitochondrial malic enzymes ME2 and ME3 on insulin secretion by generating more than 25 cell lines from pure β-cells (INS-1 832/13 cell line). We also used double targeting of single Me1 or Me2 mRNAs to even more severely lower these mRNAs than was achieved with single targeting of these mRNAs [that was already in itself quite severe (1)]. Furthermore, we studied the effect of knockdown of two or more of the malic enzymes in the same cell. We found that severe knockdown of both Me1 and Me2 mRNAs in the same cell line did not affect secretagogue-induced insulin release. However, in one cell line in which ME1 alone was targeted, insulin release was inhibited. We then noticed that the targeted Me1 mRNA sequence of this cell line was homologous (with only one nucleotide mismatch) to the Me3 mRNA sequence. Because very severe knockdown of either ME1 or ME2 alone did not inhibit insulin release at all or only very lightly inhibited insulin release, depending on the cell line, this suggested that ME3 might be important for insulin secretion. This led us to study the effect of ME3 knockdown alone on insulin secretion in more detail. We generated four cell lines with severely knocked down Me3 mRNA and ME3 protein. Glucose- and 2-aminobicyclo [2,2,1]heptane-2-carboxylic acid (BCH)-plus-glutamine-stimulated insulin release were inhibited in these cell lines. Because the mRNA and malic enzyme activity of ME3 are very low in normal pancreatic β-cells, the inhibition of insulin release with ME3 knockdown might suggest that inhibition is caused by the interference with an activity of ME3 other than or in addition to lowering its malic enzyme catalytic activity.
Materials and Methods
Materials
Chemicals, in the highest purity available, were from Sigma Chemical. pSilencer hygro and pSilencer puro were from Ambion. The parental INS-1832/13 cell line was a gift from Chris Newgard (12). The CHS cell line contains a nontargeting vector as was described previously (13). The Me1–753 and Me2–2124 and Me2–654 knockdown cell lines that are resistant to hygromycin were described previously (1). Polyclonal rabbit anti-ME2 antibody (HPA008880) was from Sigma. Monoclonal rabbit anti-ME3 (EPR10378) antibody (ab172972) was from Abcam. The sources of other antibodies, cell culture reagents, and specialty reagents are indicated in the appropriate experimental section. Other reagents were from standard suppliers.
Generation of Me1 and Me2 single- and double-knockdown cell lines
Stable single- and double-knockdown cell lines were generated as previously described (13). Briefly, the single-knockdown cell lines were generated first by cloning either 64- or 65-bp BamHI-HindIII DNA inserts that code for the specified shRNAs into the BamHI and the HindIII sites of either plasmid pSilencer2.1-U6/Hygro or plasmid pSilencer2.1-U6/Puro downstream of the U6 promoter (see Supplemental Table 1). Subsequently, INS-1 832/13 cells were transfected with either of these targeting vectors that express the shRNA that targets one specific mRNA target sequence and the cell lines were selected for resistance to either 150 μg/mL hygromycin or 250 ng/mL puromycin, depending on the targeting vector used to express the shRNA. Examples of Me1 and Me2 single targeted cell lines are Me1-753(P), Me2-2124(P); Me3-628(P), Me1-753(H).
We generated several stable double-knockdown cell lines that target either the same sequence of the mRNA or two different sequences of the same mRNA in the same cell. For example, the double-knockdown Me2 cell line Me2-2124(H)/Me2-2124(P) was generated by transfecting the hygromycin-resistant cell line Me2-2124(H) (1) that expresses shRNA that targets Me2 mRNA with a pSilencer2.1-U6/ Puro vector [Me2-2124(P)] containing puromycin resistance gene and expressed shRNA against the same Me2 mRNA target. In contrast, the double-knockdown Me2 cell line Me2-2124(H)/Me2-654(P) was generated by transfecting the hygromycin-resistant cell line Me2-2124(H) with a pSilencer2.1-U6/ Puro vector [Me2-654(P)] that expressed shRNA that targets a different site on the Me2-mRNA. Furthermore, several stable double-knockdown cell lines were generated by targeting the mRNA of two different Me genes in the same cell. For example, the cell line Me1-753(H)/Me2-2124(P) is a double knockdown in which both Me1 mRNA and Me2 mRNA were targeted in the same cell. Unless otherwise indicated, the starting host for generating the double-knockdown cell lines was the hygromycin-resistant cell line that was transfected with the pSilencer2.1-U6/Puro vector containing the puromycin-resistant gene and an shRNA. The passage number for all cell lines used was less than 25 passages.
Lowering of Me1 enzyme activity using shRNA targeting Me1 mRNA in Me1-753(H) cell line
To rule out the possibility that the residual ME1 enzyme activity in the cell line Me1-753(H) was sufficient for insulin secretion, we generated a construct intended to increase the small interfering RNA (siRNA) levels that more severely knocked down ME1 activity. The new Me1 knockdown cell line was generated by transfecting the hygromycin resistant cell line Me1-753(H) (1) with a vector containing a puromycin resistant gene Me1–753(P) that expresses the same shRNA as in the Me1-753(H) vector (1). We selected the hygromycin plus puromycin-resistant stable cell lines that we designated Me1-753(H)/Me1-753(P) (the double knockdown cell lines are named so that the host cell line vector name is indicated first followed by the name of the vector used for transfection into the host to generate the double knockdown. The letters H and P refer to hygromycin and puromycin, respectively), as previously described (13).
Lowering of ME2 enzyme activity using shRNA targeting Me2 mRNA in the Me2-2124(H) cell line
To further lower the level of Me2 mRNA and ME2 activity, we constructed Me2 double-knockdown cell lines. The cell line Me2-2124(H) (1) was used as the starting host and was transfected with either the Me2-2124(P) vector that targets the same mRNA sequence or the Me2–654(P) vector that targets a different mRNA sequence to generate the cell lines Me2-2124(H)/Me2-2124(P) and Me2-2124(H)/Me2-654(P), respectively.
Generation of Me1/Me2 knockdown cell lines that express shRNA that targets both Me1 and Me2 mRNA in the same cell
The Me1 and Me2 stable double-knockdown cell lines that are hygromycin and puromycin resistant were generated using the targeting vectors Me1-753(P) and Me2-2124(P) as described in previous section. We generated two types of double-knockdown cell lines. In one type of double knockdown, we introduced the shRNA expressing a plasmid containing a puromycin marker into the hygromycin-resistant cell lines, Me1-753(H) and Me2-2124(H), reported previously (1) and selected cell lines resistant to both hygromycin and puromycin. For example, the name Me1-753(H)/Me2-2124(P) refers to Me1 shRNA that targets nucleotides starting at nt 753 of the Me1 mRNA with the vector that contains the hygromycin-resistant gene and Me2 shRNA that targets nucleotides starting at nt 2124 of the Me2 mRNA with the vector that contains the puromycin-resistant gene. To eliminate any possible interference from the resident shRNA expression vector, we generated cell lines using the hygromycin-resistant cell line, Me2-2124(H), that was transfected with the Me1-753(P) vector to generate the cell line, Me2-2124(H)/Me1-753(P). Similarly, Me2-725(H)/Me1-753(P) and Me1-753(H)-Me2-725(P) were generated.
Me1/Me2/Me3 knockdown cell lines
Using a single shRNA vector, we were able to target all three of Me1, Me2, and Me3 mRNAs in the same cell. The target sequence is shown in Supplemental Table 1. Generation of Me1/Me2/Me3 knockdown cell lines Me*-449(H) (Me*-449 is a single shRNA that knocks down Me1, Me2, and Me3 mRNA and/or activity) and Me*-449(P) (2) and their double knockdown derivatives were as described for Me1 and Me2 knockdown cell lines described above. These cell lines include Me*449(H)/Me2–2124(P), Me2–2124(H)/Me*-449(P), Me*-449(H)/Me*-449(P), Me*449(H)/Me1–753(P), Me2–725(H)/Me*-449(P), and Me*-449(H)/Me2–725(P). In addition, three other cell lines that express shRNA targeting different 19 nucleotides of the Me3 mRNA were generated including Me3-628(P), Me3-1672(P), and Me3-875(P) using pSilencer2.1-U6/Puro (Supplemental Table 1). Double knockdown of Me3 and either Me1 or Me2 in a single cell line was also generated using some of the puromycin-resistant Me3 cell lines as hosts for transfection with the desired shRNA and the hygromycin-containing vector as described in Results. Puromycin- and hygromycin-resistant stable cell lines were isolated as described previously (13).
Enzyme assays
The cells from a single 150-mm tissue culture plate grown as described (13) were washed once with PBS and treated with 0.05% trypsin and 0.5 mM EDTA in HEPES-buffered saline and suspended in a solution of 220 mM mannitol, 70 mM sucrose, and 5 mM potassium HEPES buffer (pH 7.5) containing protease inhibitor mixture (Thermo-Scientific Pierce). The cell homogenate was obtained by two cycles of freezing at −80ºC and thawing. The cell homogenate was centrifuged at 20 000 × g for 10 minutes, and the supernatant fraction was collected and used for assays of enzymes using a SpectraMaxM2 spectrophotometer (Molecular Devices). The activity of NADP isocitrate dehydrogenase was measured as described (1, 14).
The mitochondrial fraction was used for the assay of ME2, ME3, and mitochondrial glycerol-3-phosphate dehydrogenase (mGPD) enzyme activities (3). Cells from two 150-mm tissue culture plates were trypsinized, collected, and resuspended in 1 mL of a solution of 220 mM mannitol, 70 mM sucrose, and 5 mM potassium HEPES buffer (pH 7.5) as described above. The cells were homogenized with 40 strokes of a Potter-Elvehjem homogenizer. The homogenate was centrifuged at 600 × g for 10 minutes at 4ºC, and the supernatant fraction placed in a new tube and centrifuged a second time at 10 000 × g. The second supernatant fraction was carefully removed and centrifuged at 10 000 × g for 10 minutes. The 10 000 × g supernatant (cytosolic fraction) was removed and was used for the assay of the cytosolic ME1 activity (1, 8). The pellet (mitochondrial fraction) was washed three times by centrifugation at 10 000 × g for 10 minutes and suspended in 150 μL of homogenization buffer, vortexed vigorously, and frozen at −20ºC. Mitochondrial malic enzyme activity was measured in the presence of 1 mM malate that would measure maximal activity of any ME1 contaminating the mitochondrial fraction and near maximal activity of ME3. The enzyme activity was also measured in the presence of 10 mM malate plus 5 mM fumarate, an allosteric activator of ME2, to maximize ME2 activity (3). This gave the total mitochondrial malic enzyme activity representing the combined activity of ME2 (mostly) and ME3 (very, very little of the total) plus any contamination from cytosolic malic enzyme (ME1) adhering to the mitochondria after three washes (3).
To obtain the value attributable to ME2 enzyme activity, the rate obtained in the presence of 1 mM malate was subtracted from the rate measured in the presence 10 mM malate plus 5 mM fumarate. Because the enzyme activity of ME3 is so low it cannot be accurately distinguished from a low activity of ME2 in mitochondria present at a low concentration of malate or a low amount of ME1 contaminating the mitochondria, the relative level of ME3 in the knockdown cell lines was estimated with immunoblotting.
Immunoblotting
Whole-cell lysates containing protease inhibitors were boiled in sample buffer (1% sodium dodecyl sulfate; 5% glycerol; 65 mM Tris-chloride, pH 6.8; 0.01% bromphenol blue; and 2.5% β-mercaptoethanol). Proteins were separated by electrophoresis on 7.5% polyacrylamide sodium dodecyl sulfate gels and electrotransferred to nitrocellulose membranes. After transfer, the membrane was blocked with buffer containing 10 mM Tris buffer (pH 8.0), 150 mM NaCl, and 5% nonfat powdered dry milk. ME2 was detected with the polyclonal rabbit anti-ME2 antibody (HPA008880; Sigma) and was detected with a horseradish peroxidase-conjugated goat antirabbit IgG (Thermo Scientific). The signal was detected using the Immobilon Western chemiluminescent horseradish peroxidase developer (Millipore). The blot was stripped with Restore Western blot stripping buffer (Thermo Scientific) prior to reprobing with a polyclonal antiserum to mGPD (15) with detection as above.
Real-time PCR mRNA quantification
Cells grown on 100-mm plates as described above were harvested at 60%–80% confluence and washed twice with 10 mL of PBS. The cells were then lysed and the total RNA was prepared using the Rneasy minikit (QIAGEN), with on-column deoxyribonuclease digestion (ribonuclease free deoxyribonuclease set; QIAGEN). cDNA was prepared using 1.5 μg of total RNA using the RETROscript kit (Ambion/Applied Biosystems) with oligodeoxythymidine primers. Real-time PCR was performed on a MyiQ single-color real-time PCR detection system (Bio-Rad Laboratories). A standard curve prepared from INS-1 832/13 or CHS cDNA was included on each run for relative quantitation. Glutamate dehydrogenase mRNA was used as an internal control. Real-time quantification of Me1, Me2, Me3, and the glutamate dehydrogenase gene (Glud1) cDNAs was performed as previously reported (1).
Insulin release
Insulin release experiments were performed as described previously (13). For each insulin release experiment, each cell line was grown in replicate of either four wells or multiples of four wells in 24-well tissue culture plates. In the current study, all of the knockdown cell lines and the control cell lines, when plated at a high density, grew at rates similar to one another and to the parent INS-1 832/13 cell line. Before an experiment all cell lines were subcultured at 90% confluence or confluence, usually at a cell protein concentration of 75–85 μg protein per well. Insulin release was determined by calculating the average value of all replicate wells for each cell line and compared with that of the control cell lines. Insulin release experiments for each cell line were repeated four to eight times using cells at different passage numbers. The values of the average for each condition obtained from each experiment on a single day were then compared with values of average values for the control cell lines to calculate statistical significance of differences.
Results
Double targeting of Me1 and Me2 mRNA to severely decrease their expression does not significantly inhibit insulin release
Previous work from our laboratory indicated that greater than 80% knockdown of ME1 alone or ME2 alone did not affect glucose- or BCH-plus-glutamine-stimulated insulin release in the rat insulinoma cell line INS-1 832/13 (1). Small residual ME1 and ME2 enzyme activities were detected in the cell lines Me1–753(H), Me2–2124(H), and Me2–654(H) (reference 1 and this study). To exclude the possibility that the residual ME1 and ME2 enzyme activities in the knockdown cell lines were sufficient to generate a signal needed for insulin secretion, we generated stable double-knockdown cell lines that express siRNA that targets either the same mRNA sequence (in Me1 or Me2) or two different mRNA target sequences within the same mRNA (Me2) to further lower the levels of expression of the Me1 or Me2 gene.
For Me1 knockdown, we generated the cell line Me1-753(H)/Me1-753(P) (Figure 1); and for Me2 knockdown, we generated two cell lines: Me2–2124(H)/Me2–2124(P) and Me2–2124(H)/Me2–654(P) (Figure 2). This resulted in further lowering of the mRNAs and activity of the targeted enzyme(s). Compared with the CHS control cell line, the level of Me1 mRNA in the double-knockdown cell line Me1-753(H)/Me1-753(P) was decreased to 2% as compared with 14% in the single knockdown Me1-753(H) cell line (Figure 1A). The level of Me2 mRNA was lowered by only 10% in the Me1-753(H) cell line and Me3 mRNA was lowered by only 27% in the Me1–753(H) cell line and lowered by only 35% in the Me1-753(H)/Me1-753(P) cell line (Figure 1A). The level of ME1 enzyme activity in the Me1-double knockdown cell line Me1–753(H)/Me1-753(P) was lowered to 4% compared with 20% obtained in the single knockdown Me1-753(H) as compared with CHS control (Figure 1B). The level of ME2 enzyme activity in the single-knockdown cell line Me1-753(H) and in the double-knockdown cell line Me1-753(H)/Me1-753(P) was not significantly different from the CHS control (Figure 1C). Furthermore, immunoblot analysis of the mitochondrial preparation obtained from the knockdown cell lines indicated that the level of ME3 protein was decreased in the double knockdown of Me1-753(H)/Me1-753(P) as shown in Figure 1D. NADP isocitrate dehydrogenase activity that was measured as a control was only slightly lower as compared with the CHS control in the single Me1 knockdown cell line Me1-753(H) and in the Me1 double-knockdown cell line Me1-753(H)/Me1-753(P) (Figure 1E). This slight decrease was not enough to affect glucose-stimulated insulin release (16, 17). Despite the more severe reduction in Me1 mRNA and enzyme activity (Figure 1, A and B) in the Me1 double-knockdown cell line, glucose-stimulated insulin release was decreased by only 28% in the Me1-753(H)/Me1-753(P) cell line (Figure 1F). Interestingly, this cell line showed a moderate decrease in Me3 mRNA (32%) and ME3 protein (Figure 1) that was probably due to similarities between the targeted Me1 nucleotide sequence and the Me3 nucleotide sequence: Me1-753 target sequence (753–771): TGCaTTtCGTCTcCTgAAC; and Me3 mRNA sequence (932–950): TGCcTTcCGTCTaCTcAAC.
Figure 1.

Decreases in Me1 mRNA and ME1 activity do not or only slightly inhibit insulin secretion. A, Quantitative RT-PCR of Me1, Me2, and Me3 mRNA are expressed as the ratio of each mRNA to that of glutamate dehydrogenase mRNA as an internal standard. The results represent the means ± SE of three independent experiments, each run in duplicate and are expressed as percentage of the CHS control equal to 100% using CHS cDNA to prepare a standard curve. The cDNA was prepared from total RNA obtained from CHS cells grown under the same condition as the experimental cell lines. B, ME1 enzyme activity in CHS control, Me1-753(H), and Me1-753(H)/Me1-753(P) cell lines. C, ME2 enzyme activity in the mitochondria of the previous cell lines. D, Immunoblot of ME3 protein in the mitochondria of the indicated cell lines. There was 35 μg of the mitochondrial protein samples per lane. E, NADP-dependent IDH enzyme activity as a control. Enzyme activities are expressed as the means ± SE of four different enzyme activity measurements using cells with different passage numbers. Numbers in parentheses show activity as a percentage of the CHS control. a, P < .05; b, P < .01; c, P < .001 compared with CHS control. F, Slight inhibition of glucose-stimulated insulin release in the Me1 double-knockdown cell line. Glucose (11.1 mM)-stimulated and unstimulated insulin release. G, Ten millimoles BCH plus 10 mM glutamine stimulated and unstimulated insulin release. Insulin release values are expressed as the means ± SE of four different insulin release measurements for each cell line with different passage numbers and the values are expressed in milliunits of insulin per milligram protein. Numbers in parentheses show the percentage of insulin release relative to the control CHS cell line. a, P < .05 compared with CHS control.
Figure 2.

Lowering of Me2 gene expression slightly inhibits insulin secretion. Double targeting of the Me2 gene further lowers Me2 mRNA and mitochondrial malic enzyme activity compared with single targeting of Me2 without lowering Me1 mRNA or ME1 enzyme activity. A, Malic enzyme mRNA levels in Me2 control and single- and double-targeting cell lines. The results represent the means ± SE of three independent experiments, each run in duplicate as indicated in the legend of Figure 1A. B, Mitochondrial ME2 activity of the indicated cell lines. C, ME1 enzyme activity of the indicated cell lines. D, Level of NADP-dependent IDH activity as an untargeted control of the same cell lines. E, Level of mGPD activity as an untargeted control. Results are the means ± SE of four (ME2 and mGPD) and six (ME1 and IDH) enzyme measurements for each cell line with different passage numbers. Numbers in parentheses show values as a percentage of the CHS control. a, P < .05; b, P < .001 compared with CHS control. F, Glucose (11.1 mM)-stimulated insulin and unstimulated insulin release. G, 10 mM BCH-plus-10 mM glutamine-stimulated insulin release. Insulin release results are the means ± SE of four different insulin release measurements for each cell line with different passage numbers. Numbers in parentheses show percentage of insulin release relative to the control CHS cell line. a, P < .05; b, P < .01 compared with CHS control.
In the rat Me3 mRNA sequence shown above, there are only four nucleotide mismatches (lower case and underlined) compared with the 19 nucleotide sequence of the Me1–753 target sequence. As discussed later, this level of inhibition of insulin release in this cell line could very well have been due to a decrease in Me3 mRNA and ME3 protein rather than due to the severe knockdown of ME1. Insulin release stimulated by BCH plus glutamine was decreased only 29% in the Me1-753(H) cell line and not significantly affected in the (Me1-753(H)/Me1-753(P) cell line, as compared with the CHS control (Figure 1G).
Me2 mRNA (Figure 2A) and ME2 enzyme activity (Figure 2B) were drastically reduced in the double-knockdown cell lines Me2-2124(H)/Me2-2124(P) and Me2-2124(H)/Me2-456(P). Me3 mRNA was slightly reduced in these two cell lines (Figure 2A), whereas Me1 mRNA (Figure 2A) and ME1 enzyme activity (Figure 2C) were not affected. The low levels of ME2 enzyme activity in the single-knockdown Me2-2124(H) cell line and the double-knockdown cell lines Me2-2124(H)/Me2-2124(P) and Me2-2124(H)/Me2-654(P) were confirmed with immunoblot analysis of ME2 protein (Figure 3A). The ME2 protein signal was barely detectable in immunoblot of either cell line. The activities of control enzymes NADP isocitrate dehydrogenase and the mitochondrial glycerol phosphate dehydrogenase were not significantly changed in the single- and double-Me2-knockdown cell lines compared with the control CHS cell line (Figure 2, D and E).
Figure 3.
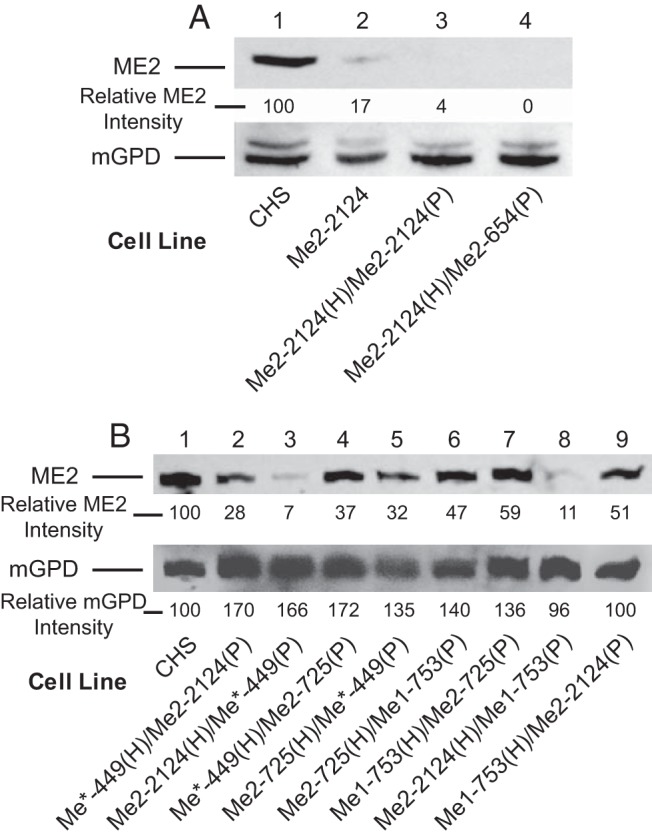
Knockdown of ME2 protein as judged from immunoblot analysis. There was 24 μg whole-cell protein per lane. A, Immunoblot of ME2 protein levels in control and single- and double-knockdown cell lines indicated. Immunoblotting did not detect ME2 protein in the Me2 double-knockdown cell lines Me2-2124(H)/Me2-2124(P) and Me2-2124(H)/Me2-654(P), and only a trace of ME2 was detected in the single-knockdown cell line Me2-2124(H). B, Immunoblot of ME2 protein in CHS and double-knockdown cell lines indicated. The level of ME2 protein detected was found to depend on the resident shRNA. The blots were stripped and reprobed for the mGPD protein as an internal control to show equal loading of protein across the lanes. The intensity of ME2 protein is shown as a percentage of the CHS and normalized to the intensity of mGPD relative to CHS control to correct for variation in protein in each lane.
The glucose-stimulated insulin release in the single-knockdown cell line Me2-2124(H) and in the Me2 double-targeted cell lines Me2-2124(H)/Me2-2124(P) and Me2-2124(H)/Me2-654(P) was 85%, 70%, and 59% of the CHS control, respectively (Figure 2F). BCH-plus-glutamate-stimulated insulin secretion in the cell lines Me2-2124, Me2-2124(H)/Me2-2124(P), and Me2-2124(H)/Me2-654(P) was 98%, 70%, and 68% of the CHS control, respectively (Figure 2G). The reduction in secretagogue-stimulated insulin release in the ME2 knockdown cell lines is small compared with the severe lowering of Me2 activity. Both ME2 protein and enzyme activity were almost completely absent in the ME2 double-targeted-knockdown Me2-2124(H)/Me2-2124(P) and Me2-2124(H)/Me2-654(P) cell lines (Figures 2B and 3A). Therefore, the decrease in insulin release could not be attributed entirely to the severe lowering of ME2 protein and enzyme activity and thus may indicate it could be due to the 30% decrease in Me3 mRNA alone or in combination with the reduction in ME2 (Figure 2, A, F, and G).
Knockdown of Me1 and Me2 in the same cell line does not inhibit insulin release
Because drastic lowering of the enzyme activities of either ME1 or ME2 alone in separate cell lines only slightly inhibited secretagogue-stimulated insulin release as described earlier (Figures 1 and 2), we generated cell lines with lowered Me1 and Me2 mRNAs and enzyme activity in the same cell. These Me1/Me2 double-knockdown cell lines, Me1–753(H)/Me2-2124(P), Me2-2124(H)/Me1-753(P), and Me2-725(H)/Me1-753(P), were found to contain low Me1 and Me2 mRNAs (Figure 4A) and low ME1 enzyme activity (Figure 4B) and ME2 enzyme activity (Figure 4C). In these cell lines, we observed that the levels of Me1 and Me2 knockdown were dependent on whether Me1-753(H) or Me2-2124(H) was used as the starting host cell line. The cell line Me1-753(H)/Me2-2124(P) contained 9% Me1 mRNA, whereas the cell line Me2-2124(H)/Me1-753(P) contained 30% Me1 mRNA as compared with the CHS control cell line. The levels of Me2-mRNA in Me1-753(H)/Me2-2124(P) and in Me2-2124(H)/Me1-753(P) were 21% and 25%, respectively, as compared with the CHS control (Figure 4A). The ME1 enzyme activity in the cell line Me1-753(H)/Me2-2124(P) was 19% of the CHS control and that of the cell line Me2-2124(H)/Me1-753(P) was 37% of the CHS control (Figure 4B).
Figure 4.

Knockdown of Me1 and Me2 in the same cell line lowers Me1 and Me2 mRNA and enzyme activities and does not inhibit insulin release. A, Relative Me1 and Me2 mRNA levels. The results represent the means ± SE of three independent experiments each run in duplicate as described in the legend of Figure 1A. B, ME1 enzyme activity. C, Mitochondrial ME2 enzyme activity. D, NADP-IDH activity as an untargeted control. E, mGPD enzyme activity as an untargeted control. Results are the means ± SE of four experiments for ME2 and mGPD measurement and six experiments for ME1 and IDH enzyme activity measurements for each cell line with different passage numbers, and knockdown of Me2 alone [Me2-725(H)] is for comparison. Numbers in parentheses indicate percentage of the CHS control. a, P < .01; b, P < .001 compared with CHS control. F, Glucose (11.1 mM)-stimulated insulin and unstimulated insulin release. G, BCH-plus-glutamine (10.0 mM each)-stimulated and unstimulated insulin release. Insulin release results are the means ± SE of four different insulin release measurements for each cell line with different passage numbers, and the values are expressed in milliunits of insulin per milligram of protein. Numbers in parentheses above each bar show insulin release as a percentage of the control CHS cell line. a, P < .05 compared with CHS control. Gln, glutamine.
The mitochondrial ME2 enzyme activity in the cell line Me1-753(H)/Me2-2124(P) was 50% of the CHS control and that of Me2–2124(H)/Me1-753(P) cell line was 21% of the CHS control. Furthermore, ME2 enzyme activity in the cell lines Me2-725(H)/Me1-753(P) and Me1-753(H)/Me2-725(P) were 42% and 68%, respectively, of the CHS control (Figure 4C). ME1 enzyme activity in the cell line Me2-725(H)/Me1-753(P) was twice that in the cell line Me1-753(H)/Me2-725(P) (Figure 4B). On the other hand, the enzyme activities of NADP-dependent isocitrate dehydrogenase (IDH)-1 and mGPD measured as controls were only slightly affected or unaffected in these cell lines (Figure 4, D and E). The low ME2 protein levels in these cell lines were confirmed by immunoblot analysis of ME2 protein in the whole cell homogenates (Figure 3B). The intensity of the ME2 protein band was almost 5-fold higher in the cell line Me1-753(H)/Me2-2124(P) than Me2-2124(H)/Me1-753(P) (55% of control vs 11% of control) (Figure 3B, lanes 9 and 8). As described later, similar results were obtained with different Me1 and Me2 knockdown cell lines shown in Figure 3B (see lanes 2 and 3 for Me*-449(H)/Me2-2124(P) and Me2-2124(H)/Me*-449(P); and lanes 4 and 5 for the cell lines Me*-449(H)/Me2-725(P) and Me2-725(H)/Me*-449(P).
A less pronounced effect was observed with the cell lines Me2-725(H)/Me1-753(P) and Me1-753(H)/Me2-725(P) as shown in lanes 6 and 7 of Figure 3B. These data are in agreement with the enzyme activity data and the quantitative RT-PCR (Figure 4, A and C). The data also suggest that the resident siRNA might interfere with the expression of the siRNA expressed from the second vector. Insulin release in the presence of glucose or BCH-plus-glutamine in Me1-753(H)/Me2-2124(P), Me2-2124(H)/Me1-753(P), Me2-725(H)/Me1-753(P) and Me1-753(H)/Me2-725(P) cell lines was not significantly affected (Figure 4, F and G).
Knockdown of Me1, Me2, and Me3 in the cell line Me*-449(H) inhibits insulin release due to knockdown of ME3
While studying the siRNA knockdown of the rat cytosolic NADP-dependent Me1, we observed that one particular cell line Me*-449(H), generated by stable transfection with a plasmid containing an shRNA that deliberately targeted Me1 mRNA, consistently showed decreased insulin release in the presence of glucose as a secretagogue (Figure 5A). As shown below, this was due to coincidental knockdown of ME3. The Me*-449(H) 19-nucleotide target sequence TGACTGATGGAGAGCGAAT corresponded to nucleotides 449–467 of the Me1 mRNA (GenBank accession number NM_012600). The insulin release data obtained with Me*-449(H) were surprising (Figure 5A). Real-time PCR showed that the level of Me1 mRNA in Me*-449(H) was decreased by 70% compared with the CHS control (Figure 5D), and the level of ME1 activity in Me*-449(H) was lowered by 69% of the CHS control (Figure 6A). This contrasts with the Me1–753(H) and Me1-753(H)/Me1-753(P) cell lines that possessed ME1 enzyme activity of 20% and 4% of the CHS control, respectively, that showed no inhibition or modest inhibition of glucose-stimulated insulin release as described above (Figure 1F).
Figure 5.

Decreased insulin release in response to glucose, BCH-plus-glutamine, or leucine-plus-glutamine in the single Me*-449 and its double-knockdown cell line derivatives with decreased ME1, ME2, and ME3. A, Glucose-stimulated insulin release. B, BCH-plus-glutamine-stimulated insulin release. C, Leucine-plus-glutamine-stimulated insulin release. Insulin release results are the mean ± SE of 7–12 experiments using cell preparations of different passage number for each cell line. The concentration of glucose was 11.1 mM and that of the other secretagogues was 10 mM each. The percentage of values relative to the CHS control are shown in parentheses above each bar. All values of 42% of the CHS control or lower were significantly different from the control to the level of P < .001. D, Lower Me1 and Me2 and/or Me3 mRNAs in Me3 single Me*-449 and double-knockdown cells. The quantitative RT-PCR values are expressed as a percentage of the CHS control cell line (means ± SE of four experiments, each run in duplicate using cell preparations of different passage numbers). a, P < .05; b, P < .01; c, P < .001 compared with CHS control. Gln, glutamine.
Figure 6.

Lower ME1 and ME2 enzyme activities in Me*-449 single- and double-knockdown cell lines without significant lowering of control enzyme activities of NADP-IDH and mGPD. A, ME1 activity. B, Mitochondrial ME2 activity. C, Activity of NADP-dependent IDH as an untargeted control. D, mGPD activity as an untargeted control. Activities as a percentage of the CHS control are shown in parentheses. Results are the means ± SE of 4–10 experiments. a, P < .05; b, P < .01; c, P < .001 compared with CHS control.
Examination of the sequence of the 19-nucleotide target in the Me*-449(H) cell line showed that this sequence is homologous to the nucleotide sequence corresponding to 578–596 of Me2 mRNA (GenBank accession number NM_001107376) and 628–646 of Me3 mRNA (GenBank accession number NM_001108491) and that both Me2 and Me3 have only one nucleotide mismatch from the Me1 449–467 target sequence. In this sequence these occur at positions 463 and 465 of the Me1 mRNA. The two mismatches are located within the seed region of the siRNA (Table 1), and this suggested that Me*-449(H) could target Me2 and Me3 mRNAs (18–21) in addition to targeting of Me1 mRNA. This was indeed the case as discussed extensively in the next section. We measured Me2 and Me3 mRNA levels in the Me*-449(H) cell line and found that the level of Me3 mRNA was decreased more than 60% compared with the CHS control cell line, whereas the Me2 mRNA level was only 22% lower than in the CHS control (Figure 5D). Furthermore, the level of ME2 enzyme activity in Me*-449(H) was decreased 36% (Figure 6B), and ME3 protein was drastically lower in this cell line (Figure 7).
Table 1.
Nucleotide sequence of Me1 target in Me*-449 shRNA vector and the homologous sequence in rat Me2 and Me3 mRNAs
| Target | Nucleotide sequence |
|---|---|
| Me*-449 | TGACTGATGGAGAGCGAAT(nt 449-467 of NM_012600) |
| Me2 target | TGACTGATGGAGAGAGAAT(nt 578-596 of NM_001107376) |
| Me3 target | TGACTGATGGAGAGCGCAT(nt 628-646 of NM_001108491) |
Nucleotide mismatches are bold and underlined.
Figure 7.
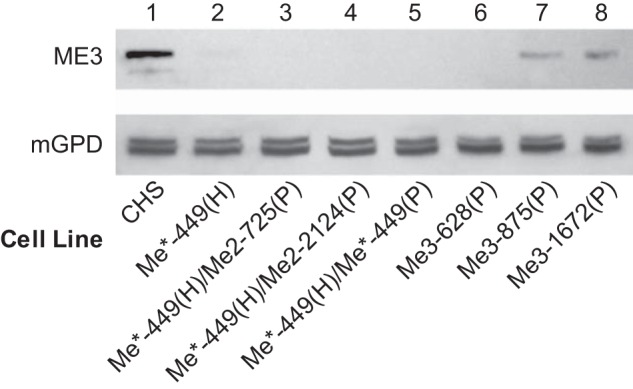
Knockdown of ME3 protein as judged from immunoblot analysis. There was 35 μg of mitochondrial protein per lane. Immunoblot of ME3 protein levels in control and single- and double-knockdown cell lines as indicated. Lane 1 shows the CHS control. Lanes 2–5 are mitochondrial samples of single Me*-449 and double-knockdown cell lines derived from Me*-449 as indicated. Lanes 6–8 are mitochondrial protein samples of Me3 knockdown cells Me3-628, Me3-875, and Me3-1672, respectively.
The present results and the results reported previously (1) indicated that the single knockdown of Me1 and Me2 alone, double knockdown of Me1 and Me2 alone, and the combined knockdown of Me1 and Me2 together in the same cell lowered secretagogue-stimulated insulin release only slightly or not at all as described in Figures 1F, 2F, and 2G. At this point in the investigation, the results suggested that the inhibitory effects on secretagogue-stimulated insulin secretion in the Me*-449 cell line might be due to the combined knockdown of Me3 plus Me1 and Me2. This is because knockdown of either Me1 or Me2 alone with single or double targeting either slightly inhibited or did not affect insulin release at all (reference 1 and data shown in Figures 1 and 2). Furthermore, the slight decrease in the NADP-dependent IDH1 enzyme activity by 12% could not contribute significantly to the inhibition of insulin release, for example by lowering cytosolic reduced nicotinamide adenine dinucleotide phosphate (NADPH) levels because even a 50% decrease in Idh1 mRNA and IDH1 activity does not inhibit secretagogue-stimulated insulin release in our hands (16).
Generation of double-knockdown cell lines using Me*-449(H) inhibits insulin release due to knockdown of ME3
To generate cell lines that target ME3 plus one other malic enzyme in the same cell, we used the hygromycin-resistant cell lines Me1-753(H), Me2-725(H), Me*-449(H), and Me2-2124(H) as hosts for transfection with the plasmid Me*-449(P) that contains the puromycin resistant gene. In addition, the cell line Me*-449(H) was used as the host for transfection with the puromycin resistant gene containing vectors Me1-753(P), Me2-2124(P), and Me2-725(P). The expression of a combination of shRNA from Me1-753, Me2-2124, or Me2-725 in the Me*-449 cell line (that targets Me1, Me2, and Me3) further decreased the level of Me1, Me2, and Me3 mRNAs (Figure 5D). Me*-449(H), in conjunction with Me1-753(P), Me2-2124(P), or Me2-725(P) increased the knockdown of ME1 and ME2 activities (Figure 6, A and B) and further lowered Me3 mRNA (Figure 5). There was only a mild effect on control enzyme activities NADP-IDH and mGPD (Figure 6, C and D). Similarly, immunoblot analysis showed that the intensity of the ME2 protein band was lowered by 72% in the cell line Me*-449(H)/Me2-2124(P) (Figure 3B, lane 2); by 93% in Me2-2124(H)/Me*-449(P) (Figure 3B, lanes 2 and 3); by 63% in Me*-449(H)/Me2-725(P) (Figure 3B, lane 4); and by 68% in the cell line Me2-725(H)/Me*-449(P) (Figure 3B, lane 5).
The vector encoding shRNA against the same mRNA target as in Me*-449(H), and also carrying the puromycin resistant gene, was transfected into the cell line Me*-449(H) to generate the Me*-449(H)/Me*-449(P) cell line. The level of Me1 mRNA in Me*-449(H)/Me*-449(P), Me2-725(H)/Me*-449(P), Me*-449(H)/Me2-725(P), and Me*-449(H)/Me1-753(P) was further reduced by approximately 30% relative to the single-knockdown cell line Me*-449(H) (Figure 5D). Also shown in Figure 5D, the double-knockdown cell lines derived from Me*-449 showed lower Me1 mRNA relative to Me*-449(H). A mild but significant decrease in the level of Me2 mRNA was observed in most of these knockdown cell lines. The levels of Me2 mRNA in the cell lines Me2-2124(H)/Me*-449(P) and Me*-449(H)/Me2-2124(P) were 30% and 45% lower as compared with the single-knockdown cell line Me*-449(H) (Figure 5D).
As expected, the cell line [Me*-449(H)/Me*449(P)] showed lower ME1 enzyme activity (14%) and mitochondrial ME2 activity (20%) relative to the CHS control (Figure 6, A and B). On the other hand, the single knockdown Me*-449(H) cell line showed 31% of ME1 and 64% of the mitochondrial ME2 activity relative to the CHS control. All other double-knockdown cell lines in combination with Me*-449 showed lowered ME1 enzyme activity except Me2-2124(H)/Me*-449(P) (Figure 6A). ME2 enzyme activity was lowered more in the Me*-449 double knockdown cell lines except in Me*-449(H)/Me2-725(P) and Me2-725(H)/Me*-449(P). The latter two cell lines showed the same mitochondrial enzyme activity as the single-knockdown cell line Me*-449(H) (Figure 6B). The control enzyme activities of NADP-dependent IDH and mGPD were only slightly affected in the same cell lines (Figure 6, C and D). The single-knockdown Me*-449 cell line showed 58% lower glucose-stimulated insulin release than the CHS control (Figure 5A). Inhibition of insulin release in the cell line Me*-449 (which lowers mostly Me1 and Me3 mRNA and to a lesser extent Me2 mRNA) was further enhanced with additional knockdown of Me1 or Me2 in the same cell line (Figures 5, A–C), which increased the knockdown of Me3 mRNA in these cell lines (Figure 5D). The double-knockdown cell lines with the most severe inhibition of insulin secretion were Me*-449(H)/Me1-753(P) that resulted in 92% inhibition of glucose-stimulated insulin release, Me*-449(H)/Me2-725(P) that resulted in 89% lowering of insulin release, Me*-449(H)/Me2-2124(P) that resulted in 81% lowering of insulin release; Me*-449(H)/Me*-449(P) that resulted in 80% lowering of insulin release, Me2-2124(H)/Me*-449(P) that resulted in 66% lowering of insulin release; and the cell line Me2-725(H)/Me*-449(P) that resulted in only 62% inhibition of insulin release (Figure 5A). The double-knockdown cell lines derived from the Me*-449 cell line also showed decreased insulin release in response to BCH-plus-glutamine (Figure 5B) and with leucine-plus-glutamine (Figure 5C).
Using Western blots, the cell lines Me*-449(H), Me*-449(H)/Me2-2124(P), Me*-449(H)/Me2-725(P), and Me*-449(H)/Me*-449(P) showed almost complete elimination of ME3 protein in the mitochondrial samples as compared with CHS control (Figure 7, lanes 2, 3, 4, and 5). At this stage of the investigation, it was not clear whether the additional knockdown of Me1 or Me2 in conjunction with Me3 knockdown was sufficient for the inhibition of secretagogue-stimulated insulin release or the inhibition of insulin release was due to further lowering of Me3 mRNA and ME3 protein (Figure 7). Again, some of the cell lines showed a mild decrease in NADP-dependent IDH activity that would not contribute to the inhibition of insulin release. Some cell lines with drastic inhibition of insulin release did not show a significant effect on NADP-dependent IDH activity (Figures 5 and 6C).
Knockdown of Me3 with or without knockdown of Me1 and Me2 inhibits insulin release
The results above might suggest that the ME1 and ME2 enzymes are slightly or not involved in controlling secretagogue-stimulated insulin secretion and strongly point to a significant role for Me3 in this process. To test this possibility, we constructed three additional stable cell lines that express shRNA that target different sequences in the Me3 mRNA (Supplemental Table 1). The level of ME3 protein and Me3 mRNA were lowered in the cell lines Me3-628(P), Me3-875(P), and Me3-1672(P) (Figures 7 and 8). ME1 enzyme activity was decreased by 32% in the Me3-628(P) cell line but not in the Me3-875(P) and Me3-1672(P) cell lines (Figure 8B). However, because even greater than 90% knockdown of ME1 in the cell line Me1-753(H)/Me1-753(P) resulted in only mild inhibition of insulin release (Figure 1G), this slight knockdown of ME1 in the Me3-628 cell line cannot explain the decreased insulin release in this cell line. The 20 nucleotide target sequence in Me3-628(P) has two mismatches with the Me1 mRNA sequence (449–468) used in the cell line Me*-449(H) and has three nucleotide mismatches with the Me2 mRNA sequence (578–597) as shown in Table 2. The homology between Me1 and Me3 siRNA in the seed region might account for the slight decrease in ME1 observed in the cell line Me3-628(P). NADP-dependent IDH enzyme activity measured as a control was not significantly changed in Me3-628(P), Me3-875(P), and Me3-1672(P) cell lines (Figure 8D). In these cell lines, insulin release stimulated by glucose, pyruvate, or BCH-plus-glutamine was decreased severely or moderately (Figure 9) and was proportionate to the knockdown of ME3 protein (Figure 7).
Figure 8.

Me3 mRNA levels and enzyme activity of control enzymes in single- and double-Me3-knockdown cell lines. A, Me3 mRNA levels expressed as percentage relative to the CHS control (average of three duplicate preparations). B, ME1 enzyme activity (four experiments and each run in duplicates). C, ME2 activity in the mitochondrial preparation of the indicated cell lines (three experiments). D, NADP-dependent IDH activity (four experiments each run in duplicates). Percentages relative to the CHS control are shown in parentheses. Results are the mean ± SE from three or four cell preparations. a, P < .05; b, P < .01; c, P < .001 compared with CHS control.
Table 2.
Nucleotide sequence of Me3 target in Me3–628 shRNA vector and the homologous sequence in rat Me1 and Me2 mRNAs
| Target | Nucleotide sequence |
|---|---|
| Me3-628 (628–647) | TGACTGATGGAGAGCGCATA |
| Me1 (449–468) | TGACTGATGGAGAGCGAATC |
| Me2 (578–597) | TGACTGATGGAGAGAGAATC |
Nucleotide mismatches are in bold and underlined.
Figure 9.
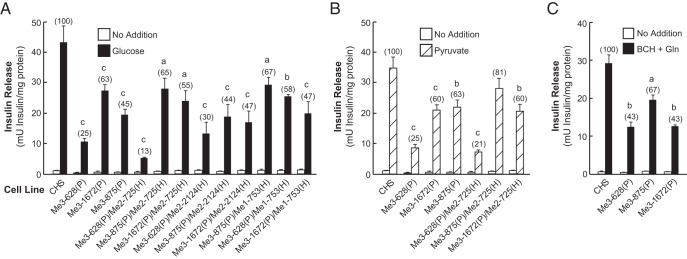
Decreased glucose-, pyruvate-, and BCH-plus-glutamine-stimulated insulin release in the cell lines with Me3 single and double knockdown in combination with Me1 or Me2 knockdown. A, Glucose (11.1 mM)-stimulated insulin release. B, Pyruvate (10 mM)-stimulated insulin release. C, 10 mM BCH-plus-10 mM glutamine-stimulated insulin release. Results are the mean ± SE of 3–12 replicate experiments for each cell line. Percentages relative to the CHS control cell line are shown in parentheses. a, P < .05; b, P < .01; c, P < .001 compared with CHS control.
In addition to single knockdown of Me3 mRNA, we also generated double-knockdown cell lines with additional targeting of either Me1 or Me2 mRNAs. Double-knockdown Me3 plus Me2 cell lines were generated using Me3-628(P), Me3-875(P), and Me3-1672(P) as starting hosts. We generated six Me3/Me2 and three Me3/Me1 double-knockdown cell lines Me3-628 (P)/Me2-725(H); Me3-875(P)/Me2-725(H); Me3-1672(P)/Me2-725(H); Me3-628(P)/Me2-2124(H); Me3-875(P)/Me2-2124(H); Me3-1672(P)/Me2-2124(H); Me3-628(P)/Me1-753(H); Me3-875(P)/Me1-753(H); and Me3-1672(P)/Me1-753(H). Me3 mRNA in the cell line Me3-628(P)/Me1-753(H), but not in Me3-1672(P)/Me1-753(H), was decreased more relative to the single-knockdown cell line Me3-628(P) (Figure 8A). The levels of Me3 mRNA in Me3-628(P)/Me2-725(H), Me3-875(P)/Me2-725(H), and Me3-1672(P)/Me2-725(H) were 24%, 46%, and 68%, respectively, as compared with the CHS control (Figure 8A). Figure 8, B and C, show the levels of ME1 and ME2 activities in these cell lines. In the Me3 double-knockdown cells, the level of Me1 mRNA was not significantly decreased in the Me3-628(P)/Me2-725(H) and Me3-1672(P)/Me2-725(H) cell lines (data not shown). However, a 32%, 49%, and 47% decrease in ME1 activity was observed in the cell lines Me3-628(P), Me3-628(P)/Me2-725(H), and Me3-628(P)/Me2-2124(H), respectively (Figure 8B).
The results suggest that targeting of Me2 (Me2-725) in Me3 knockdown cell lines Me3-628 had potentiating effects on lowering Me3 mRNA (Figure 8). In the cell lines Me3-875/Me2-725 and Me3-1672/Me2-725, no further reduction of Me3 mRNA and insulin release was observed as compared with the parental cell lines Me3-875 and Me3-1672 (Figures 8 and 9). Furthermore, in the cell lines Me3-875 and Me3-1672, there was no decrease in Me1, Me2 mRNA (not shown), and ME1 and ME2 enzyme activities (Figure 8, B and C).
As mentioned earlier, Me3 mRNA was decreased in the Me3 single-knockdown cell line Me3-628(P), and it was lowered further in the Me3 and Me1 double-knockdown Me3–628(P)/Me1-753(H) but not Me3-1672(P)/Me1-753(H). The level of Me3 mRNA in Me3-628(P)/Me1-753(H) and Me3-1672(P)/Me1-753(H) was 10% and 59% of the CHS control, respectively (Figure 8A). Me1 mRNA in these two cell lines was reduced to less than 20% of the CHS control (data not shown), whereas ME1 enzyme activity was decreased to less than 8% of CHS control (Figure 8B). In each of the Me3/Me1 and Me3/Me2 double-knockdown cell lines, there was no significant effect on NADP-dependent IDH enzyme activity (Figure 8D). Insulin release in response to glucose, pyruvate, or BCH-plus-glutamine stimulation in Me3 single- and double-knockdown cell lines was further reduced with the highest reduction observed with Me3–628(P)/Me2–725(H) (Figure 9). The results obtained are very similar to those obtained with Me*-449(H) double-knockdown cell lines described earlier in Figure 5. Cell lines Me*-449(H)/Me1-753(P), Me*-449(H)/Me2-725(P), and Me3-628(P)/Me2-725(H) showed the most pronounced lowering of secretagogue-stimulated insulin secretion (Figures 5 and 9). The results indicate that Me3 knockdown alone in the cell lines Me3-628, Me3-875, and Me3-1672 or when combined with Me2 knockdown in the cell line Me3-628P)/Me2-725(H) severely inhibits insulin secretion stimulated by glucose, pyruvate, and BCH-plus-glutamine (Figure 9). However, there was no further decrease in insulin release in the cell lines Me3-628(P)/Me2-2124(H), Me3-875(P)/Me2-725(H), Me3-1672(P)/Me2-725(H), Me3-875(P)/Me2-2124(H), or Me3-1672(P)/Me2-2124(H), even though ME2 activity was reduced significantly in these cell lines. Furthermore, knockdown of Me3 mRNA when combined with the knockdown of Me1 mRNA and ME1 enzyme activity did not affect insulin release as compared with the parental cell lines (Figures 8 and 9). In the cell line Me*-449(H)/Me1-753(P), Me1 siRNA has a sparing effect on Me3 siRNA and would therefore be expected to increase the level of Me3 mRNA knockdown (Figure 5). All the data strongly support the conclusion that only the knockdown of Me3 mRNA and ME3 protein inhibited secretagogue-stimulated insulin release in the insulinoma INS-1 832/13 cell line.
It is unlikely that off target effects or artifacts explain inhibition of insulin release associated with ME3 knockdown
The large number of cell lines generated with ME3 knockdown and with similar results with three different insulin secretagogues makes it unlikely that off target effects or artifacts could explain the inhibition of insulin release by ME3 knockdown in all cell lines. The use of pools of hygromycin- or puromycin-resistant cells or hygromycin-plus-puromycin-resistant cells also diminishes the possibility of off target effects. Differences in cell number or growth rates cannot explain the results. Before an insulin release study was to be performed all cell lines were subcultured at near confluence (90% confluence) or confluence, at essentially equal protein concentrations of 75–85 μg cell protein/well. The enzyme activities of NADPH-IDH that also maintains cytosolic NADPH levels similar to ME1 was not significantly lowered in most cell lines, and levels of mGPD, a highly expressed enzyme in β-cell mitochondria, were normal in all cell lines tested. Because only 1%–3% of the insulin content of a β-cell is secreted from β-cells during a 1-hour glucose stimulus, the insulin content of a cell line would probably need to be decreased by 80%–90% compared with normal to explain decreased glucose-stimulated insulin release in a cell line. The insulin content of ME3 knockdown cell lines showing the most severe knockdown of ME3 mRNA, protein, and insulin release as well as ME (or ME2 knockdown cell lines) ranged from 75%–130% the insulin content of the control cell lines (data not shown).
Discussion
There are conflicting data on whether ME1 and ME2 are necessary for glucose-stimulated insulin secretion (1, 2, 4, 5, 7–10). The role of ME3 in insulin secretion has previously been studied only insofar as to measure the level of Me3 mRNA in insulin cell lines or pancreatic islets (1, 2, 4) as well as its enzyme activity (3). Because Me3 mRNA and ME3 enzyme activity is very low in pancreatic islets and insulin cell lines, it was thought ME3 was not involved in insulin secretion, and therefore, it was not intensively studied earlier by pancreatic islet researchers. The current study reexamined the roles of ME1, ME2, and ME3 in insulin secretion using shRNA to knock down one or more of these enzymes in the same cell and discovered that ME3 is probably more essential for insulin secretion than ME1 and ME2.
In the current study, using one or more shRNAs we generated more than 25 different cell lines that targeted Me1, Me2, or Me3 alone or two different Me genes in the same cell. In one case, the Me*-449(H) cell line that was originally designed to target Me1, the shRNA happened to target all three Me genes because of significant sequence homology of the target sequence to ME2 and ME3 (Table 1). From the results obtained, the following conclusions can be made: 1) severe knockdown of Me1 and Me2 either alone or together causes no or very slight inhibition of glucose- or BCH-plus-glutamine-stimulated insulin release in INS-1 832/13-derived cell lines; 2) knockdown of Me3 alone with four different shRNAs targeting four different mRNA sequences does inhibit glucose- and BCH-plus-glutamine-stimulated insulin release, and this inhibition is proportional to the knockdown of ME3 (Me*-449, Me3-628, Me3-875, and Me3-1672); 3) knockdown of either Me1 or Me2 mRNA in the presence of Me3 knockdown is without further effect on insulin secretion in the following double-knockdown cell lines Me3-628(P)/Me1-753(H), Me3-875(P)/Me1-753(H), Me3-1672(P)/Me1-753(H), Me3-875(P)/Me2-725(H), Me3-1672(P)/Me2-725(H), Me3-628(P)/Me2-2124(H), Me3-875(P)/Me2-2124(H), and Me3-1672(P)/Me2-2124(H) (Figure 9); and 4) in contrast, the additional targeting of Me1 and Me2 mRNA in the Me3 knockdown cell lines further increases the knockdown of Me3 and increases the inhibition of glucose- or BCH-plus-glutamine-stimulated insulin release (Me*-449(H)/Me2-2124(P), Me2-2124(H)/Me*-449(P), Me*-449(H)/Me2-725(P), Me2-725(H)/Me*-449(P), Me3-628(P)/Me2-725(H), Me*-449(H)/Me*-449(P), and Me*-449(H)/Me1-753(P). In these cell lines, the inhibition of insulin release is most probably due to the increased lowering of Me3 mRNA and protein rather than the additional lowering of ME1 or ME2.
Summary and conclusion
The controversy about a role for the ME1 and ME2 in insulin secretion might be due in part to the sequence homology between the Me1, Me2, and Me3 mRNAs. In the current study and our previous studies (1), we generated numerous cell lines with malic enzymes knocked down. Our current data as well as our published results (1) and those of others (9) indicate that ME1 or ME2 deficiency has no significant effect on insulin secretion. This is also in agreement with the Mod-1 mouse strain data in which it was found that insulin levels in vivo and insulin release in the islets of this mouse, which completely lacks cytosolic malic enzyme (ME1) in all tissues, are normal (8, 9). The silencing activity with siRNA reported in studies in which only one or two siRNAs that targeted a malic enzyme were used might be due to significant homology between Me1, Me2, and Me3 target sequence in the mRNA.
Our data suggest that ME3 plays an important role in the regulation of normal insulin secretion. However, because ME3 mRNA (1, 2, 4) and enzyme activity (3) are much lower than those of ME1 or ME2 in pancreatic islets and insulinoma cell lines, this might suggest that the ME3 protein has an unknown structural role or catalytic role in addition to its malic enzyme catalytic activity in mitochondria. For example, it is possible that ME3 is associated with other enzymes into a complex that regulates their activity as reported with several other enzymes (22–26).
Acknowledgments
This work was supported by National Institutes of Health Grant DK28348 and the Nowlin Family Trust administered by the InFaith Community Foundation.
Disclosure Summary: The authors have nothing to disclose.
Footnotes
- BCH
- 2-aminobicyclo [2,2,1]heptane-2-carboxylic acid
- IDH1
- NADP-dependent isocitrate dehydrogenase
- ME1
- cytosolic NADP-dependent malic enzyme
- ME2
- mitochondrial NAD(P)-dependent malic enzyme 2
- ME3
- mitochondrial NADP-dependent malic enzyme 3
- mGPD
- mitochondrial glycerol-3-phosphate dehydrogenase
- NADP
- oxidized nicotinamide adenine dinucleotide phosphate
- NADPH
- reduced nicotinamide adenine dinucleotide phosphate
- shRNA
- short hairpin RNA
- siRNA
- small interfering RNA.
References
- 1. Brown LJ, Longacre MJ, Hasan NM, Kendrick MA, Stoker SW, MacDonald MJ. Chronic reduction of the cytosolic or NAD(P)-mitochondrial malic enzyme does not affect insulin secretion in a rat insulinoma cell line. J Biol Chem. 2009;284:35359–35367. [DOI] [PMC free article] [PubMed] [Google Scholar]
- 2. Li C, Nissim I, Chen P, et al. Elimination of KATP channels in mouse islets results in elevated [U-13C]glucose metabolism, glutaminolysis, and pyruvate cycling but a decreased gamma-aminobutyric acid shunt. J Biol Chem. 2008;283:17238–17249. [DOI] [PMC free article] [PubMed] [Google Scholar]
- 3. MacDonald MJ, Longacre MJ, Kendrick MA. Mitochondrial malic enzyme (ME2) in pancreatic islets of the human, rat and mouse and clonal insulinoma cells. Arch Biochem Biophys. 2009;488:100–104. [DOI] [PMC free article] [PubMed] [Google Scholar]
- 4. Pongratz RL, Kibbey RG, Shulman GI, Cline GW. Cytosolic and mitochondrial malic enzyme isoforms differentially control insulin secretion. J Biol Chem. 2007;282:200–207. [DOI] [PubMed] [Google Scholar]
- 5. Guay C, Madiraju SR, Aumais A, Joly E, Prentki M. A role for ATP-citrate lyase, malic enzyme, and pyruvate/citrate cycling in glucose-induced insulin secretion. J Biol Chem. 2007;282:35657–35665. [DOI] [PubMed] [Google Scholar]
- 6. Heart E, Cline GW, Collis LP, Pongratz RL, Gray JP, Smith PJ. Role for malic enzyme, pyruvate carboxylation, and mitochondrial malate import in glucose-stimulated insulin secretion. Am J Physiol Endocrinol Metab. 2009;296:E1354–E1362. [DOI] [PMC free article] [PubMed] [Google Scholar]
- 7. MacDonald MJ. Feasibility of a mitochondrial pyruvate malate shuttle in pancreatic islets. Further implication of cytosolic NADPH in insulin secretion. J Biol Chem. 1995;270:20051–20058. [PubMed] [Google Scholar]
- 8. MacDonald MJ, Marshall LK. Survey of normal appearing mouse strain which lacks malic enzyme and Nad+-linked glycerol phosphate dehydrogenase: normal pancreatic β cell function, but abnormal metabolite pattern in skeletal muscle. Mol Cell Biochem. 2001;220:117–125. [DOI] [PubMed] [Google Scholar]
- 9. Ronnebaum SM, Jensen MV, Hohmeier HE, et al. Silencing of cytosolic or mitochondrial isoforms of malic enzyme has no effect on glucose-stimulated insulin secretion from rodent islets. J Biol Chem. 2008;283:28909–28917. [DOI] [PMC free article] [PubMed] [Google Scholar]
- 10. Sener A, Malaisse-Lagae F, Dufrane SP, Malaisse WJ. The coupling of metabolic to secretory events in pancreatic islets. The cytosolic redox state. Biochem J. 1984;220:433–440. [DOI] [PMC free article] [PubMed] [Google Scholar]
- 11. Xu J, Han J, Long YS, et al. Malic enzyme is present in mouse islets and modulates insulin secretion. Diabetologia. 2008;51:2281–2289. [DOI] [PMC free article] [PubMed] [Google Scholar]
- 12. Hohmeier HE, Mulder H, Chen G, Henkel-Rieger R, Prentki M, Newgard CB. Isolation of INS-1 derived cells lines with robust ATP-sensitive K+ channel-dependent and -independent glucose-stimulated insulin secretion. Diabetes. 2000;49:424–430. [DOI] [PubMed] [Google Scholar]
- 13. Hasan NM, Longacre MJ, Stoker SW, et al. Impaired anaplerosis and insulin secretion in insulinoma cells caused by siRNA-mediated suppression of pyruvate carboxylase. J Biol Chem. 2008;283:28048–28059. [DOI] [PMC free article] [PubMed] [Google Scholar]
- 14. MacDonald MJ. High content of mitochondrial glycerol-3-phosphate dehydrogenase in pancreatic islets and its inhibition by diazoxide. J Biol Chem. 1981;256:8287–8290. [PubMed] [Google Scholar]
- 15. Brown LJ, MacDonald MJ, Lehn DA, Moran SM. Sequence of rat mitochondrial glycerol-3-phosphate dehydrogenase cDNA. Evidence for EF-hand calcium-binding domains. J Biol Chem. 1994;269:14363–14366. [PubMed] [Google Scholar]
- 16. MacDonald MJ, Brown LJ, Longacre MJ, Stoker SW, Kendrick MA, Hasan NM. Knockdown of both mitochondrial isocitrate dehydrogenase enzymes in pancreatic β cells inhibits insulin secretion. Biochim Biophys Acta. 2013;1830:5104–5111 (Corrigendum Biochim Biophys Acta, http://dx.doi.org/10.1016/j.bbagen.2013.09.024, 2013.) [DOI] [PMC free article] [PubMed] [Google Scholar]
- 17. Ronnebaum SM, Ilkayeva O, Burgess SC, et al. A pyruvate cycling pathway involving cytosolic NADP-dependent isocitrate dehydrogenase regulates glucose-stimulated insulin secretion. J Biol Chem. 2006;281:30593–30602. [DOI] [PubMed] [Google Scholar]
- 18. Anderson EM, Birmingham A, Baskerville S, et al. Experimental validation of the importance of seed complement frequency to siRNA specificity. RNA. 2008;14:853–861. [DOI] [PMC free article] [PubMed] [Google Scholar]
- 19. Jackson AL, Burchard J, Schelter J, et al. Widespread siRNA “off-target” transcript silencing mediated by seed region sequence complementarity. RNA. 2006;12:1179–1187. [DOI] [PMC free article] [PubMed] [Google Scholar]
- 20. Lin X, Ruan X, Anderson MG, et al. siRNA-mediated off-target gene silencing triggered by a 7 nt complementation. Nucleic Acids Res. 2005;33:4527–4525. [DOI] [PMC free article] [PubMed] [Google Scholar]
- 21. Ui-Tei K, Naito Y, Nishi K, Juni A, Saigo K. Thermodynamic stability and Watson-Crick base pairing in the seed duplex are major determinants of the efficiency of the siRNA-based off-target effect. Nucleic Acids Res. 2008;36:7100–7109. [DOI] [PMC free article] [PubMed] [Google Scholar]
- 22. Campanella ME, Chu H, Low PS.Assembly and regulation of a glycolytic enzyme complex on the human erythrocyte membrane. Proc Natl Acad Sci USA. 2005;102:2402–2407. [DOI] [PMC free article] [PubMed] [Google Scholar]
- 23. Fahien LA, Teller JK. Glutamate-malate metabolism in liver mitochondria. A model constructed on the basis of mitochondrial levels of enzymes, specificity, dissociation constants, and stoichiometry of hetero-enzyme complexes. J Biol Chem. 1992;267:10411–10422. [PubMed] [Google Scholar]
- 24. Islam MM, Nautiyal M, Wynn RM, Mobley JA, Chuang DT, Hutson SM.Branched-chain amino acid metabolon: interaction of glutamate dehydrogenase with the mitochondrial branched-chain aminotransferase (BCATm). J Biol Chem. 2010;285:265–276. [DOI] [PMC free article] [PubMed] [Google Scholar]
- 25. Li C, Chen P, Palladino A, et al. Mechanism of hyperinsulinism in short-chain 3-hydroxyacyl-CoA dehydrogenase deficiency involves activation of glutamate dehydrogenase. J Biol Chem. 2010;285:31806–31818. [DOI] [PMC free article] [PubMed] [Google Scholar]
- 26. Wang Y, Mohsen AW, Mihalik SJ, Goetzman ES, Vockley J. Evidence for the physical association of mitochondrial fatty acid oxidation and oxidative phosphorylation complexes. J Biol Chem. 2010;285:29834–29841. [DOI] [PMC free article] [PubMed] [Google Scholar]