

Abstract
We conducted a prospective longitudinal study of fetal size in rural Papua New Guinea (PNG) involving 439 ultrasound-dated singleton pregnancies with no obvious risk factors for growth restriction. Sonographically estimated fetal weights (EFWs; N = 788) and birth weights (N = 376) were included in a second-order polynomial regression model (optimal fit) to generate fetal weight centiles. Means for specific fetal biometric measurements were also estimated. Fetal weight centiles from a healthy PNG cohort were consistently lower than those derived from Caucasian and Congolese populations, which overestimated the proportion of fetuses measuring small for gestational age (SGA; < 10th centile). Tanzanian and global reference centiles (Caucasian weight reference adapted to our PNG cohort) were more similar to those observed in our cohort, but the global reference underestimated SGA. Individual biometric measurements did not differ significantly from other cohorts. In rural PNG, a locally derived nomogram may be most appropriate for detection of SGA fetuses.
Introduction
Fetal growth and size differ between populations depending on their ethnic composition, socioeconomic status, and geographical location,1,2 and the importance of each factor is subject to ongoing debate.3,4 The International Fetal and Newborn Growth Consortium (INTERGROWTH)-21 study assesses fetal growth in cohorts with no obvious risk factors for fetal growth restriction (FGR) in eight geographical areas, including Kenya and India, with the aim of developing global standards for optimal fetal growth.5
The most commonly used ultrasound-estimated fetal weight (EFW), birth weight (BW), and size reference charts (nomograms) are derived from industrialized and largely Caucasian populations,6–9 and they may not be appropriate in all populations1; particularly, their ability to accurately detect FGR may be limited.10 A definitive diagnosis of FGR is made when serial ultrasound scans show a persistent downward deviation from the expected growth trajectory. In developing countries, limited availability means that most pregnant women will have only one growth scan (if any). An EFW below the 10th centile on first scan (defined as small for gestational age [SGA]) indicates that the fetus is either constitutionally small or indeed, suffers from FGR.11 Detection of SGA fetuses will identify pregnancies at risk of FGR and adverse pregnancy outcomes, including low BW and perinatal death, permitting interventions to be delivered before morbid placental insufficiency leads to irreversible or terminal fetal compromise.
The use of weight centiles derived from Caucasian populations may overestimate the number of fetuses who are SGA.1,12,13 This could result in unnecessary intervention for a large number of pregnancies rather than targeting those fetuses that are truly growth-restricted, a disadvantageous scenario for low-income countries with strained health services. To overcome this problem, either currently available nomograms should be adjusted to local conditions, or fetal growth standards should be derived from the relevant populations.1,12,13
Similar to the INTERGROWTH-21 collaboration, this study evaluated fetal growth in rural Melanesian populations to generate a regional fetal weight reference, which was subsequently compared with charts derived from other populations. We also compared individual biometric parameters with reference values published for other populations.
Materials and Methods
Study setting and population.
This prospective longitudinal cohort study was designed to monitor fetal growth in an ethnic Melanesian population with uncomplicated term pregnancies to generate a population-specific weight chart. The research was conducted from November of 2009 to February of 2013 at six health facilities in Madang Province in coastal Papua New Guinea (PNG). An enrollment chart is given in Figure 1. Briefly, women with singleton pregnancies < 25 gestational weeks (GWs) by clinical gestational assessment (including ultrasound confirmation) with no known comorbidities and absence of fetal abnormality on scan who were available for follow-up scans and delivery at a participating health facility were invited to join the study. All participants were simultaneously enrolled in a randomized clinical trial investigating the impact of intermittent preventive treatment in pregnancy with azithromycin (AZ) and sulphadoxine-pyrimethamine (SP) on BW (Figure 1).14 Women were provided with insecticide-treated bed nets at recruitment and received either a single treatment course of SP and chloroquine or up to three monthly courses of SP-AZ.
Figure 1.

Flow chart of participants in the ultrasound study (Madang Province, PNG, 2009–2013). IPTp = intermittent preventive treatment in pregnancy.
To generate a cohort of healthy pregnancies for this ultrasound study, women were subsequently excluded if their pregnancy outcome was unknown (lost to follow-up) or their pregnancy was complicated by factors known to affect growth, including intrauterine fetal death, pre-term delivery (< 37 GW), hypertensive disorders of pregnancy, severe protein-energy undernutrition, severe anemia (hemoglobin < 7 g/dL at any stage during pregnancy), syphilis, malaria, and smoking. Protein-energy malnutrition was defined as a mid-upper arm circumference < 22 cm, syphilis was defined as a positive Treponema pallidum hemagglutination test (TPHA) (Syphicheck-WB; Qualpro Diagnostics, Verna, Goa, India) and reactive rapid plasma reagin test (RPR) (irrespective of titer) at prenatal booking, and malaria was defined as the presence of malaria parasites detected by light microscopy on a standard peripheral blood smear at any stage during pregnancy. Data on maternal human immunodeficiency virus (HIV) infection was unavailable: prevalence at the provincial hospital prenatal clinic was 1.1% during the study period. Testing for gestational diabetes was only undertaken if clinically suspected by hospital staff. Clinical and demographic data were collected at recruitment, at subsequent scheduled clinical trial visits, and during unscheduled morbidity visits. At delivery, infant sex was documented, and BWs were measured using an electronic scale (Cupid 1; Charder Medical, Taichung City, Taiwan; precision to 10 g). Weight measurements were excluded from analyses if collected > 24 hours postpartum.
Ethics.
All women provided informed consent. Ethical approval for this research protocol and the parent clinical trial was obtained from the Institutional Review Board of the PNG Institute of Medical Research, the PNG Medical Research Advisory Council, and the Melbourne Health Human Research Ethics Committee. Details of the clinical trial are described elsewhere.14
Ultrasound assessment.
Participants were encouraged to attend three scan visits (at enrollment, late second trimester, and mid-third trimester) and deliver at a participating health facility. This design attempted to strike a balance between adequately covering fetal growth from the second trimester until delivery and accommodating the participant's sociogeographical situation. Most participants lived rurally at considerable distances from participating clinics and found it difficult to attend more than two times. Only a small number of EFWs were collected at term.
Ultrasound examinations were undertaken by two clinicians trained in obstetric ultrasound and fetal biometry (H.W.U. and M.O.) using a portable ultrasound scanner with a 2- to 5-MHz convex abdominal probe (Logiqbook XP; General Electric Medical Systems, Hatfield, Hertfordshire, United Kingdom). Still images of all measurements were stored and managed using K-Pacs viewing software, version 1.6. The fetal biometric parameters crown-rump length (CRL), abdominal circumference (AC), head circumference (HC), and femur length (FL) were measured.15,16 The average of two measurements (three for CRL) was used when available. AC was measured using the ellipse facility (extreme perimeter of a well-magnified circular section) in images that displayed a lateral spine, a short segment of the umbilical vein in the anterior third, and the stomach bubble.17 HC was evaluated using the ellipse facility of the ultrasound machine (outer border of fetal skull) from adequately magnified still images of horizontally placed head views that were oval in shape and symmetrical with a centrally positioned falx cerebri and adequate views of the thalamus and cavum septum pellucidum.17 FL was measured from adequately magnified horizontal stills and only included the ossified diaphysis.17
At the first ultrasound visit, gestational age (GA) in days was estimated in accordance with the British Medical Ultrasound Society guidelines using dating standards derived from a Caucasian population.15 When available, CRL measurements were used to estimate GA until 75 mm (13 GW + 4 days).16 In the second trimester, GA was estimated using the HC (FL if HC unavailable) until 24 GW + 6 days.15 The biparietal diameter was not used for dating or growth assessments.18 Measurements from enrollment scans were used to define GA. Dating standards for Melanesian populations are unavailable. However, research suggests that variation in fetal growth because of ethnic differences may be minimal until mid-second trimester,19,20 although this is not a unanimous finding.21,22 Recall and reporting of last menstrual period and characteristics of menstrual cycles were often unreliable in our cohort, precluding corroboration of these dates by sonographic GA estimation. Despite considerable efforts to encourage early presentation, few women presented < 14 GW: late presentation to prenatal clinic is common in PNG.23
EFWs in grams were calculated from the combination of AC, HC, and FL measurements using the Hadlock formula: log10 (EFW) = 1.326 – 0.00326 × AC × FL + 0.0107 × HC + 0.0438 × AC + 0.158 × FL.24 Where acceptable head measurements were unavailable, we used the alternative formula, log10 (EFW) = 1.304 + 0.05281 × AC + 0.1938 × FL – 0.004 × AC × FL, which was also derived by Hadlock and others.24 We assessed performance of the Hadlock formula to predict actual BW in our cohort by adopting two methods (termed A and B) previously described by Schmiegelow and others13 given that the number of women who underwent a scan at term in our cohort was equally small. Method A estimated BW by extrapolating from the last available EFW value and assuming a weight gain of 24.2 g per day from mid-second trimester.25 Method B adopted the proportionality formula by Mongelli and Gardosi26 using median weight estimates for our population from adjusted Hadlock charts derived as per the work by Mikolajczyk and others.1 Our PNG-adjusted global reference was based on BW measurements from 108 newborns delivered at 40 GW + 0 days – 40 GW + 6 days with a mean BW of 3,122 g and an SD of 10.9%, which was assumed constant for any given GA.1 Of note, these newborns were also part of this ultrasound cohort. Prediction assessments were undertaken using EFWs measured within 60 days of BW measurement only. Estimated and actual BWs were normally distributed, allowing for calculation of the mean percentage difference and analysis as per Bland and Altman.27 Estimated BWs were not used for development of the fetal weight nomogram.
Interobserver variability was assessed by comparing measurements taken from 10 randomly selected fetuses, and issues regarding measurement precision were addressed. A random selection of image stills (approximately 10% of each measurement) underwent external quality control by an obstetric radiologist based at the Royal Infirmary of Edinburgh (J.W.): 92.5% of images fulfilled the criteria for inclusion in subsequent analyses.15 A sample size calculation was not performed for this substudy, because the cohort size was determined by the number of healthy women presenting at an appropriate gestation and the availability of scanning equipment and trained personnel.
Data analyses.
Data were double-entered into FoxPro, version 9.0 (Microsoft, Redmond, WA). Statistical analyses were performed using Stata, version 12.0 (StataCorp, College Station, TX) and Mathematica, version 9.0 (Wolfram Research, Champaign, IL). Charts and graphs were generated using Mathematica and Prism, version 6.0 (GraphPad Software, La Jolla, CA).
Bland and Altman27 methods of analysis were used to compare measured BW with extrapolated estimates (methods A and B described above). In short, the differences of BW estimates derived by either method and the measured BWs were plotted over their averages.27 Mean percentage difference and 95% confidence levels of agreement were derived. The fetal weight nomogram was a hybrid chart developed from both EFW and observed BW. In brief, EFW/BW values were transformed to their decadic logarithms, which were normally distributed. Logarithmic EFW/BW fit very well to a second-order polynomial function of GA (R2 > 0.99). Residual errors (raw and studentized) from the fit of the regression model were plotted against GA and assessed for normality of distribution.
The 10th, 50th, and 90th fetal weight centiles for GWs 25–40 derived from our cohort were compared with those derived from Caucasian, Congolese, and Tanzanian populations6,12,13 as well as PNG-adjusted global reference centiles as per the work by Mikolajczyk and others.1 Growth curves were superimposed, and percentage differences for the 10th, 50th, and 90th centiles were plotted. We compared the proportion of newborns with a BW measurement and GA ≤ 40 GWs that would be categorized as SGA for each reference chart.
Additional analyses included a comparison of AC, FL, and HC sizes in our population with fetal size references from an urban PNG population,28 a Hong Kong Chinese population,2 and two European (largely Caucasian) populations.7–9,29 For this analysis, we selected a cross-sectional sample (one measurement per fetus) from the overall number of sonographic measurements taken in the participant population. Samples were selected such that the number of observations was maximally dispersed over gestation to enable the best possible distribution of values for statistical analysis. We opted for this approach given that calibration of an adequate multilevel model to account for within-subject variation would require more than three measurements per fetus.30 Third-order polynomials were fitted to the fetal biometry indices as described in previous studies.2,29 Confidence bands were derived by fitting quadratic models to the SDs observed at each GW. Z scores per GW were calculated using the 50th centiles from aforementioned published reference populations (urban PNG, Chinese, French, and United Kingdom) and plotted together with the mean and SD derived from our model for comparison.2,29
Results
Of 727 women enrolled, 288 women were excluded, because they experienced at least one condition that could have affected fetal growth or had incomplete data for adequate fetal size estimation, leaving 439 singleton fetuses for analysis (Figure 1). Participants underwent a total of 810 scans, and 376 newborns had their weight measured within 24 hours of delivery. Maternal and newborn characteristics are shown in Table 1. Notably, 50% of women were primigravidae. Two-thirds of women (275 of 439) underwent two or more ultrasound scans, with a mean of 69 days (SD ± 30.7; range = 7–168) between scans. The Hadlock formula predicted actual BW moderately well. The mean absolute prediction error (mean percentage difference) of estimated BW compared with observed BW was 217 (8.4%) and 284 g (10.3%) for methods A and B, respectively, with the estimated BW overestimating actual BW (Supplemental Figure 1). The estimated BW was within ± 15% of actual BW for 70.8% (method A) and 64.1% (method B) of newborns. The median interval between last EFW and birth was 43 days for both methods.
Table 1.
Characteristics of mothers and infants in the PNG fetal biometry cohort (N = 439)
| Characteristics | Mean ± SD (range) or percentage (n) |
|---|---|
| Maternal (at enrollment) | |
| Age (years) | 24.6 ± 5.5 (16–42) |
| Body mass index (kg/m2) | 23.1 ± 3.2 (17–39) |
| Height (cm) | 154.5 ± 5.8 (134–171) |
| Mid-upper arm circumference (cm) | 24.6 ± 2.5 (22–38) |
| Hemoglobin (g/dL) | 10.1 ± 1.3 (7–15) |
| Primigravida | 50.8 (223) |
| Ethnic group | |
| Madang/Morobe | 50.3 (221) |
| Sepik | 15.0 (66) |
| Highlands | 9.8 (43) |
| New Guinea islands | 5.2 (23) |
| Mixed PNG | 19.6 (86) |
| Fetus/newborn | |
| GA at enrollment (days) | 137 ± 26 (43–174) |
| GA at birth (days) | 277 ± 9 (259–306) |
| BW (N = 376; g)* | 3,019 ± 410 (1,910–4,200) |
| Low BW (< 2,500 g)* | 8.8 (33) |
| Female infant sex (N = 430) | 55.7 (236) |
BW measured within 24 hours of delivery.
Fetal weight chart.
In total, 417 women had two or more weight measurements (788 EFWs and 376 BWs) and were included in the generation of the fetal weight nomogram (Supplemental Table 1): most EFWs were available for GWs 18–35. The fitted regression equations for the mean and SD of log-transformed weights (in grams) and GA (in exact weeks) were
 |
Using this model, weight centiles (2.5, 10, 25, 50, 75, 90, and 97.5) were generated for GWs 14–43 (Table 2). These centiles were subsequently plotted together with the raw EFW/BW values (Figure 2): 9.5% of actual weight measurements were below the 10th centile, and 9.5% of actual weight measurements were above the 90th centile. Raw and studentized residuals of EFW/BW from the model were plotted against GA, and dispersion around zero was assessed to ensure adequacy of the decadic log transformation (Supplemental Figure 2).
Table 2.
Weight centiles for the PNG cohort
| GA (weeks) | Weight centiles (g) | ||||||
|---|---|---|---|---|---|---|---|
| 2.5 | 10 | 25 | 50 | 75 | 90 | 97.5 | |
| 14 | 73 | 79 | 84 | 91 | 98 | 104 | 112 |
| 15 | 92 | 100 | 106 | 115 | 123 | 132 | 142 |
| 16 | 116 | 125 | 134 | 144 | 155 | 166 | 179 |
| 17 | 145 | 156 | 167 | 179 | 193 | 206 | 222 |
| 18 | 179 | 193 | 206 | 222 | 239 | 255 | 275 |
| 19 | 219 | 236 | 252 | 272 | 293 | 313 | 337 |
| 20 | 267 | 287 | 307 | 330 | 356 | 380 | 410 |
| 21 | 322 | 347 | 370 | 399 | 429 | 459 | 494 |
| 22 | 385 | 415 | 443 | 477 | 514 | 549 | 591 |
| 23 | 457 | 492 | 526 | 566 | 610 | 651 | 702 |
| 24 | 538 | 580 | 619 | 667 | 718 | 767 | 826 |
| 25 | 629 | 677 | 724 | 779 | 839 | 896 | 965 |
| 26 | 728 | 785 | 839 | 903 | 972 | 1,038 | 1,119 |
| 27 | 837 | 902 | 964 | 1,038 | 1,117 | 1,194 | 1,286 |
| 28 | 955 | 1,028 | 1,099 | 1,183 | 1,274 | 1,361 | 1,466 |
| 29 | 1,080 | 1,163 | 1,243 | 1,338 | 1,441 | 1,540 | 1,659 |
| 30 | 1,212 | 1,305 | 1,395 | 1,502 | 1,617 | 1,728 | 1,861 |
| 31 | 1,349 | 1,453 | 1,553 | 1,672 | 1,800 | 1,923 | 2,072 |
| 32 | 1,490 | 1,605 | 1,715 | 1,846 | 1,987 | 2,124 | 2,288 |
| 33 | 1,632 | 1,758 | 1,878 | 2,022 | 2,177 | 2,326 | 2,506 |
| 34 | 1,773 | 1,910 | 2,041 | 2,197 | 2,365 | 2,528 | 2,723 |
| 35 | 1,911 | 2,059 | 2,200 | 2,368 | 2,550 | 2,725 | 2,935 |
| 36 | 2,044 | 2,201 | 2,352 | 2,532 | 2,726 | 2,913 | 3,138 |
| 37 | 2,168 | 2,335 | 2,495 | 2,686 | 2,892 | 3,090 | 3,328 |
| 38 | 2,281 | 2,457 | 2,626 | 2,826 | 3,043 | 3,252 | 3,502 |
| 39 | 2,381 | 2,564 | 2,741 | 2,950 | 3,176 | 3,394 | 3,656 |
| 40 | 2,465 | 2,655 | 2,838 | 3,055 | 3,289 | 3,515 | 3,786 |
| 41 | 2,532 | 2,727 | 2,914 | 3,138 | 3,378 | 3,610 | 3,889 |
| 42 | 2,579 | 2,778 | 2,969 | 3,197 | 3,442 | 3,679 | 3,963 |
| 43 | 2,606 | 2,808 | 3,001 | 3,231 | 3,479 | 3,719 | 4,006 |
Figure 2.

EFW and BW measurements and fitted 2.5th, 10th, 25th, 50th, 75th, 90th, and 97.5th fetal weight centiles for GWs 15–43.
Comparison of fetal weight nomograms from different populations.
Figure 3 allows for visual comparison of the estimated 10th, 50th, and 90th weight centiles from our cohort with those from the PNG-adjusted global reference and other reference populations.1,12,13,24 Reference charts derived from Caucasian and Congolese women had consistently higher 10th weight centiles from 30 GWs onward, and percentage differences increased until term compared with our nomogram (Figure 4 ). Tanzanian reference intervals would diagnose a similar proportion of fetuses as SGA as our chart (Figures 3 and 4). The PNG-adjusted global reference chart classified a smaller number of fetuses as SGA until 37 GWs compared with our nomogram (Figure 4). Of note, 10th centile reference values from Congolese and Tanzanian cohorts and this cohort were derived after exponentiation, which results in a slight upward shift of the centile: values are approximately 1% lower when the 10th centile is calculated assuming a constant percentage SD (Supplemental Figure 3).
Figure 3.

Locally derived fetal weight centiles (Figure 2 information shown in dark gray shading) compared with centiles from the (A) the PNG-adjusted global reference,1 (B) a Caucasian reference,6 (C) a Tanzanian reference,13 and (D) a Congolese reference.12
Figure 4.

Percentage difference in the (A) 10th, (B) 50th, and (C) 90th fetal weight centiles derived from a rural PNG cohort, Caucasian, Congolese, and Tanzanian weight references, and a PNG-adjusted global reference.
We found that 50th centiles of fetal weight were consistently higher in the Caucasian reference from 25 GWs onward, and the percentage difference in mean weight between Caucasian and PNG fetuses increased to 18.5% at term. Medians of fetal weight tended to be lower in the early third trimester and higher in the late third trimester in Congolese and Tanzanian reference charts compared with our chart, and medians of the PNG-adjusted global reference were consistently lower for the duration of the entire gestational time period of comparison. Differences in all centiles were most marked when our chart was compared with that derived from a Caucasian population. There was an overall trend of centiles in our cohort being higher at earlier and lower at later gestation compared with comparator centiles, apart from the 10th centile of the Tanzanian reference, which was similar to our cohort throughout the gestational time frame of comparison.
Among 327 (87.0%) newborns with a valid BW measurement, the proportion with SGA was 11.9% (39) using our equation, 16.2% (53) using Tanzanian reference values, 16.5% (54) using PNG-adjusted global reference values, 29.1% (95) using Congolese reference values, and 35.2% (115) using Caucasian reference values.
Comparison of individual biometric measurements.
In total, 439 AC and FL and 434 HC ultrasound-derived biometric measurements (one per pregnancy) were selected to generate centile equations for our cohort (Supplemental Table 1). Most biometric measurements were obtained between GWs 16–35 (Supplemental Table 1). The best fit models for each measurement to GA were achieved using a third-order polynomial (all biometric measurements in millimeters) (Figure 5):
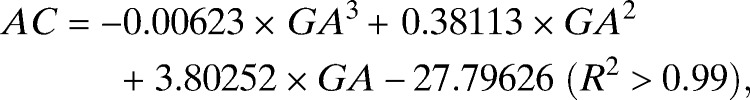 |
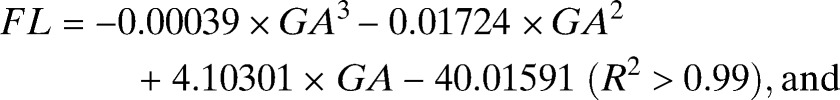 |
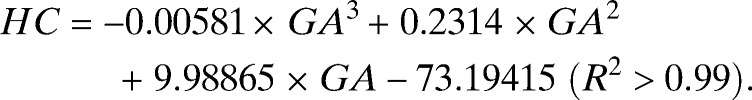 |
Figure 5.

Raw biometric data (millimeters) with 2.5th, 10th, 50th, 90th and 97.5th fitted centiles for (A) AC (N = 439), (B) FL (N = 439), and (C) HC (N = 434).
We compared values for our population with reference values previously published for PNG (FL and AC), China, France, and the United Kingdom (Figure 6).2,7–9,28,29 AC reference measurements from other populations were within 1 SD of our measurements for most GWs, although measurements were higher in the French population compared with our population at earlier gestation. HC reference values were similar from 22–35 GWs for all populations but considerably higher in a French reference before 17 GWs and a United Kingdom reference after 38 GWs. FL measurements of a Chinese population were > 1 SD below our mean (25–32 GWs), and an urban PNG population had FL measurements > 1 SD above our mean from 31 GWs onward.
Figure 6.

Comparison of 50th centiles from United Kingdom (UK), French, Chinese, and PNG (urban) references with centiles for (A) AC, (B) HC, and (C) FL derived from a rural Melanesian population. Expected Z scores for the 5th, 50th, and 95th centiles from our population are plotted as solid lines.
Discussion
We generated a fetal weight nomogram and estimates of fetal size from a cohort of rural PNG women with minimal risk factors for FGR. Melanesians are not included in current multicenter studies evaluating optimal fetal growth.5 Our fetal weight centiles were most similar to a Tanzanian population and markedly lower than the widely used Caucasian reference (Hadlock),6 use of which overestimated SGA in rural PNG. A comparison of 50th centiles for individual biometric measurements (AC, HC, and FL) from PNG with those derived from other populations did not show major differences.
Most ultrasound studies from developing countries, including our study, report fetal size centiles lower than those in largely Caucasian populations from industrialized countries.1,12,13,31 This could be because of differences in genetic growth potential, a reflection of intergenerational (epigenetic) legacies of suboptimal fetal and infant growth related to malnutrition or malaria, or because of unknown environmental factors causing FGR or altering fetal fat accumulation in particular. There was a flattening of weight centiles toward term in this cohort and a Tanzanian cohort, whereas growth centiles in Caucasian and Congolese nomograms remained quasilinear until delivery (Figure 3). This might be driven by differences in end pregnancy growth velocity between populations.31,32
However, the findings of this research must be interpreted in light of its potential limitations. First, we may not have eliminated all causes of FGR, which may underestimate optimal (standard) fetal weight centiles5; also, we did not adjust for factors that may promote fetal growth (e.g., SP-AZ treatment). Inclusion criteria of comparator studies with regards to FGR risk also differed, with some studies not excluding risk factors, such as protein-energy malnutrition and malaria.12 Second, reliable data on last menstrual period were largely unavailable, which could lead to lower mean fetal weights by GA.33,34 Third, late presentation to the prenatal clinic, a frequent occurrence in PNG, precluded pregnancy dating using CRL in most participants. Error margins of GA estimates based on fetal biometry increase with advancing GA,15,19 and an episode of FGR before a dating measurement will underestimate GA, translating into lower fetal weight centiles. However, exclusion of pregnancies affected by severe maternal disease, congenital abnormalities, and stillbirth should have somewhat limited the number of fetuses that may have suffered early-onset FGR in this cohort. Similarly, one-half of our women were primigravidae, which is associated with lower mean BWs,35 and we observed a relatively high proportion of female fetuses,12 potentially resulting in a downward bias of our fetal weight centiles. Furthermore, our nomogram is a hybrid derived from both EFW and BW, because it was not possible for most women to be scanned near term. Previous research suggests that this is a valid alternative,36,37 and 10th centiles are similar between actual BW and EFW in term pregnancies in North American cohorts.38 However, because of the aforementioned shortcomings with estimating GA, some infants in the cohort may have been pre-term deliveries, potentially lowering the mean of the curve.38 The inclusion of BW may also explain the flattening of the curve toward term that was observed in our reference chart and the Tanzanian (hybrid) reference chart: there were no marked differences in third trimester growth velocities when Congolese and Caucasian centiles (EFW only) were compared.12 Fourth, exponentiation resulted in an upward shift of our 10th percentile values by 1% (Supplemental Figure 3).
Use of the Hadlock or Congolese references in our population would result in overdiagnosing SGA, whereas 10th centiles from a Tanzanian reference were comparable with our cohort, and the PNG-adjusted global reference underestimated SGA. This suggests that locally derived centiles may be most appropriate. In the absence of population-specific references, use of the global reference is a reasonable alternative, keeping in mind the potential risk of missing an SGA fetus. The population-adjusted global reference requires a minimum of 100 BWs from ultrasound-dated uncomplicated singleton term pregnancies, a challenge in itself to achieve in some developing countries settings, notwithstanding the advantages of generating population-specific references. The PNG-adjusted global reference underestimated PNG means and 10th centiles, which suggests that assumptions made to generate it may not fully apply to our population.1 For instance, although variation of fetal weight was relatively constant across GA when expressed as a percentage of the fetal weight residuals in our cohort (Supplemental Figure 3), it was smaller (10.9%) compared with global reference assumptions.1,6
The Hadlock formula for estimating fetal weights overestimated actual BW in term pregnancies in our population and other developing world populations.12,13 In our study, this may be explained by the relatively wide time intervals between last EFW and actual BW and the methodologies used to approximate BW from last measured EFW; however, trends were similar in studies from Tanzania and the Democratic Republic of Congo.12,13 It is, hence, conceivable that the Hadlock formula somehow fails to capture differences in fetal size, growth, and body fat percentage in developing world populations, particularly toward term.39 We hope that current research will provide answers to this important question.17
In a subanalysis, we compared centiles for AC, HC, and FL (ultrasound only) from our cohort with those from other populations (Figure 5). The small number of measurements restricted a meaningful comparison to the 16- to 35-GW interval (Table 2). Z scores of three biometric measurements were within 1 SD of most comparison populations, apart from lower mean FLs in a Hong Kong Chinese population. This corroborates findings from a similar comparison conducted in Thailand.40 Mean FLs observed in urban PNG were higher than our findings after 30 GWs. This may because their cohort contained a higher percentage of Papuans/Polynesians than our cohort, but it could also be because they used biparietal diameters for dating and performed cross-sectional analysis of a longitudinal dataset.15,41 We did not observe higher AC Z scores in Caucasian references compared with our cohort, which could have explained lower fetal weight centiles. However, a direct comparison is not possible, because AC data of the population used to derive the Caucasian fetal weight reference are unavailable; also, reference values estimated from different Caucasian populations were used.
Our findings suggest that our fetal weight nomogram may be the most appropriate tool to detect fetuses with FGR in rural PNG (Supplemental Figure 4 provides a version of the nomogram for clinical use). Alternatively, a Tanzanian or PNG-adjusted global reference chart may be used, although the latter may result in underdiagnosing SGA. Pregnancy ultrasound scanning remains relatively uncommon in PNG, but it is clearly useful to corroborate health workers' suspicion of suboptimal fetal growth,42 and scarce scan resources should be prioritized to women with abnormal clinical findings.
Supplementary Material
ACKNOWLEDGMENTS
The authors thank the participating women and their families; the Papua New Guinea Institute of Medical Research clinical, administrative, logistics, and laboratory staff; and the staff at all participating health centers and hospitals. We also thank Dupain Singirok, Dr. Leanne Robinson, and Dr. John Bolnga.
Disclaimer: The funders had no role in study design, data collection and analysis, decision to publish, or preparation of the manuscript.
Footnotes
Financial support: Aspects of this research were supported by the Malaria in Pregnancy Consortium through Bill and Melinda Gates Foundation Grant 46099, Pfizer Inc. Investigator-Initiated Research Grant WS394663, an Internal Competitive Research Award (to M.O.), and the Pregvax Consortium through the European Union's Seventh Framework Programme Grant FP7-2007-HEALTH (PREGVAX 201588). SK is supported by an NHMRC Early Career Fellowship (#1052760). IM is supported by an NHMRC Senior Research Fellowship (#1043345).
Authors' addresses: Holger W. Unger and Stephen J. Rogerson, Department of Medicine, Royal Melbourne Hospital, University of Melbourne, Parkville, VIC, Australia, E-mails: hwunger@doctors.org.uk and sroger@unimelb.edu.au. Stephan Karl, Walter and Eliza Hall Institute, Parkville, VIC, Australia, E-mail: karl@wehi.edu.au. Regina A. Wangnapi, Peter Siba, and Maria Ome, Papua New Guinea Institute of Medical Research, Goroka, Papua New Guinea, E-mails: wangnapi.regina@yahoo.com, pmaxsiba@gmail.com, and marai.kaius@gmail.com. Glen Mola, Department of Obstetrics and Gynaecology, School of Medicine and Health Sciences, University of Papua New Guinea, Port Moresby, Papua New Guinea, E-mail: glenmola@dg.com.pg. Jane Walker, Royal Infirmary of Edinburgh, Edinburgh, United Kingdom, E-mail: jane.walker@nhslothian.scot.nhs.uk. Ivo Mueller, Walter and Eliza Hall Institute, Parkville, VIC, Australia, and Centre de Recerca en Salut Internacional de Barcelona (CRESIB), Barcelona, Spain, E-mail: ivomueller@fastmail.fm.
References
- 1.Mikolajczyk RT, Zhang J, Betran AP, Souza JP, Mori R, Gulmezoglu AM, Merialdi M. A global reference for fetal-weight and birthweight percentiles. Lancet. 2011;377:1855–1861. doi: 10.1016/S0140-6736(11)60364-4. [DOI] [PubMed] [Google Scholar]
- 2.Leung TN, Pang MW, Daljit SS, Leung TY, Poon CF, Wong SM, Lau TK. Fetal biometry in ethnic Chinese: biparietal diameter, head circumference, abdominal circumference and femur length. Ultrasound Obstet Gynecol. 2008;31:321–327. doi: 10.1002/uog.5192. [DOI] [PubMed] [Google Scholar]
- 3.Brooks AA, Johnson MR, Steer PJ, Pawson ME, Abdalla HI. Birth weight: nature or nurture? Early Hum Dev. 1995;42:29–35. doi: 10.1016/0378-3782(95)01637-i. [DOI] [PubMed] [Google Scholar]
- 4.Conley D, Bennett NG. Race and the inheritance of low birth weight. Soc Biol. 2000;47:77–93. doi: 10.1080/19485565.2000.9989011. [DOI] [PubMed] [Google Scholar]
- 5.Villar J, Altman DG, Purwar M, Noble JA, Knight HE, Ruyan P, Cheikh Ismail L, Barros FC, Lambert A, Papageorghiou AT, Carvalho M, Jaffer YA, Bertino E, Gravett MG, Bhutta ZA, Kennedy SH. The objectives, design and implementation of the INTERGROWTH-21st Project. BJOG. 2013;120((Suppl 2)):9–26. doi: 10.1111/1471-0528.12047. [DOI] [PubMed] [Google Scholar]
- 6.Hadlock FP, Harrist RB, Martinez-Poyer J. In utero analysis of fetal growth: a sonographic weight standard. Radiology. 1991;181:129–133. doi: 10.1148/radiology.181.1.1887021. [DOI] [PubMed] [Google Scholar]
- 7.Chitty LS, Altman DG, Henderson A, Campbell S. Charts of fetal size: 4. Femur length. Br J Obstet Gynaecol. 1994;101:132–135. doi: 10.1111/j.1471-0528.1994.tb13078.x. [DOI] [PubMed] [Google Scholar]
- 8.Chitty LS, Altman DG, Henderson A, Campbell S. Charts of fetal size: 3. Abdominal measurements. Br J Obstet Gynaecol. 1994;101:125–131. doi: 10.1111/j.1471-0528.1994.tb13077.x. [DOI] [PubMed] [Google Scholar]
- 9.Chitty LS, Altman DG, Henderson A, Campbell S. Charts of fetal size: 2. Head measurements. Br J Obstet Gynaecol. 1994;101:35–43. doi: 10.1111/j.1471-0528.1994.tb13007.x. [DOI] [PubMed] [Google Scholar]
- 10.Ding G, Tian Y, Zhang Y, Pang Y, Zhang J. Application of A global reference for fetal-weight and birthweight percentiles in predicting infant mortality. BJOG. 2013;120:1613–1621. doi: 10.1111/1471-0528.12381. [DOI] [PubMed] [Google Scholar]
- 11.Lubchenco LO, Hansman C, Dressler M, Boyd E. Intrauterine growth as estimated from liveborn birth-weight data at 24 to 42 weeks of gestation. Pediatrics. 1963;32:793–800. [PubMed] [Google Scholar]
- 12.Landis SH, Ananth CV, Lokomba V, Hartmann KE, Thorp JM, Jr, Horton A, Atibu J, Ryder RW, Tshefu A, Meshnick SR. Ultrasound-derived fetal size nomogram for a sub-Saharan African population: a longitudinal study. Ultrasound Obstet Gynecol. 2009;34:379–386. doi: 10.1002/uog.6357. [DOI] [PubMed] [Google Scholar]
- 13.Schmiegelow C, Scheike T, Oesterholt M, Minja D, Pehrson C, Magistrado P, Lemnge M, Rasch V, Lusingu J, Theander TG, Nielsen BB. Development of a fetal weight chart using serial trans-abdominal ultrasound in an East African population: a longitudinal observational study. PLoS ONE. 2012;7:e44773. doi: 10.1371/journal.pone.0044773. [DOI] [PMC free article] [PubMed] [Google Scholar]
- 14.ClinicalTrials.gov Intermittent Preventive Treatment with Azithromycin-Containing Regimens in Pregnant Women in Papua New Guinea (IPTp in PNG) 2013. http://www.clinicaltrials.gov/show/NCT01136850 Available at. Accessed February 1, 2014.
- 15.Loughna P, Chitty L, Evans T, Chudleigh T. Fetal size and dating: charts recommended for clinical obstetric practice. Ultrasound. 2009;17:161–167. [Google Scholar]
- 16.Sanders R, Winder T. Clinical Sonography: A Practial Guide. Baltimore, MD: Lippincott, Williams & Wilkins; 2007. [Google Scholar]
- 17.Papageorghiou AT, Sarris I, Ioannou C, Todros T, Carvalho M, Pilu G, Salomon LJ. Ultrasound methodology used to construct the fetal growth standards in the INTERGROWTH-21st Project. BJOG. 2013;120((Suppl 2)):27–32. doi: 10.1111/1471-0528.12313. [DOI] [PubMed] [Google Scholar]
- 18.Hadlock FP, Deter RL, Carpenter RJ, Park SK. Estimating fetal age: effect of head shape on BPD. AJR Am J Roentgenol. 1981;137:83–85. doi: 10.2214/ajr.137.1.83. [DOI] [PubMed] [Google Scholar]
- 19.Salpou D, Kirserud T, Rasmussen S, Johnsen S. Fetal age assessment based on 2nd trimester ultrasound in Africa and the effect of ethnicity. BMC Pregnancy Childbirth. 2008;8:48. doi: 10.1186/1471-2393-8-48. [DOI] [PMC free article] [PubMed] [Google Scholar]
- 20.Hadlock FP, Harrist RB, Shah YP, King DE, Park SK, Sharman RS. Estimating fetal age using multiple parameters: a prospective evaluation in a racially mixed population. Am J Obstet Gynecol. 1987;156:955–957. doi: 10.1016/0002-9378(87)90365-6. [DOI] [PubMed] [Google Scholar]
- 21.Mastrobattista JM, Pschirrer ER, Hamrick MA, Glaser AM, Schumacher V, Shirkey BA, Wicklund CA, Hollier LM. Humerus length evaluation in different ethnic groups. J Ultrasound Med. 2004;23:227–231. doi: 10.7863/jum.2004.23.2.227. [DOI] [PubMed] [Google Scholar]
- 22.Bottomley C, Daemen A, Mukri F, Papageorghiou AT, Kirk E, Pexsters A, De Moor B, Timmerman D, Bourne T. Assessing first trimester growth: the influence of ethnic background and maternal age. Hum Reprod. 2009;24:284–290. doi: 10.1093/humrep/den389. [DOI] [PubMed] [Google Scholar]
- 23.Vallely LM, Homiehombo P, Kelly AM, Vallely A, Homer CS, Whittaker A. Exploring women's perspectives of access to care during pregnancy and childbirth: a qualitative study from rural Papua New Guinea. Midwifery. 2013;29:1222–1229. doi: 10.1016/j.midw.2013.03.011. [DOI] [PubMed] [Google Scholar]
- 24.Hadlock FP, Harrist RB, Sharman RS, Deter RL, Park SK. Estimation of fetal weight with the use of head, body, and femur measurements–a prospective study. Am J Obstet Gynecol. 1985;151:333–337. doi: 10.1016/0002-9378(85)90298-4. [DOI] [PubMed] [Google Scholar]
- 25.de Jong CL, Francis A, van Geijn HP, Gardosi J. Fetal growth rate and adverse perinatal events. Ultrasound Obstet Gynecol. 1999;13:86–89. doi: 10.1046/j.1469-0705.1999.13020086.x. [DOI] [PubMed] [Google Scholar]
- 26.Mongelli M, Gardosi J. Gestation-adjusted projection of estimated fetal weight. Acta Obstet Gynecol Scand. 1996;75:28–31. doi: 10.3109/00016349609033279. [DOI] [PubMed] [Google Scholar]
- 27.Bland JM, Altman DG. Measuring agreement in method comparison studies. Stat Methods Med Res. 1999;8:135–160. doi: 10.1177/096228029900800204. [DOI] [PubMed] [Google Scholar]
- 28.Amoa AB, Wapi J, Klufio CA. Longitudinal fetal biometry of normal pregnant Melanesian Papua New Guineans to construct standards of reference for Papua New Guinea. P N G Med J. 1993;36:219–227. [PubMed] [Google Scholar]
- 29.Salomon LJ, Duyme M, Crequat J, Brodaty G, Talmant C, Fries N, Althuser M. French fetal biometry: reference equations and comparison with other charts. Ultrasound Obstet Gynecol. 2006;28:193–198. doi: 10.1002/uog.2733. [DOI] [PubMed] [Google Scholar]
- 30.Royston P. Calculation of unconditional and conditional reference intervals for foetal size and growth from longitudinal measurements. Stat Med. 1995;14:1417–1436. doi: 10.1002/sim.4780141303. [DOI] [PubMed] [Google Scholar]
- 31.Merialdi M, Caulfield LE, Zavaleta N, Figueroa A, Costigan KA, Dominici F, Dipietro JA. Fetal growth in Peru: comparisons with international fetal size charts and implications for fetal growth assessment. Ultrasound Obstet Gynecol. 2005;26:123–128. doi: 10.1002/uog.1954. [DOI] [PubMed] [Google Scholar]
- 32.Overpeck MD, Hediger ML, Zhang J, Trumble AC, Klebanoff MA. Birth weight for gestational age of Mexican American infants born in the United States. Obstet Gynecol. 1999;93:943–947. doi: 10.1016/s0029-7844(98)00553-5. [DOI] [PubMed] [Google Scholar]
- 33.Kramer MS, McLean FH, Boyd ME, Usher RH. The validity of gestational age estimation by menstrual dating in term, preterm, and postterm gestations. JAMA. 1988;260:3306–3308. [PubMed] [Google Scholar]
- 34.Savitz DA, Terry JW, Jr, Dole N, Thorp JM, Jr, Siega-Riz AM, Herring AH. Comparison of pregnancy dating by last menstrual period, ultrasound scanning, and their combination. Am J Obstet Gynecol. 2002;187:1660–1666. doi: 10.1067/mob.2002.127601. [DOI] [PubMed] [Google Scholar]
- 35.Kramer MS. Determinants of low birth weight: methodological assessment and meta-analysis. Bull World Health Organ. 1987;65:663–737. [PMC free article] [PubMed] [Google Scholar]
- 36.Bernstein IM, Mohs G, Rucquoi M, Badger GJ. Case for hybrid “fetal growth curves”: a population-based estimation of normal fetal size across gestational age. J Matern Fetal Med. 1996;5:124–127. doi: 10.1002/(SICI)1520-6661(199605/06)5:3<124::AID-MFM5>3.0.CO;2-O. [DOI] [PubMed] [Google Scholar]
- 37.Fry AG, Bernstein IM, Badger GJ. Comparison of fetal growth estimates based on birth weight and ultrasound references. J Matern Fetal Neonatal Med. 2002;12:247–252. doi: 10.1080/jmf.12.4.247.252. [DOI] [PubMed] [Google Scholar]
- 38.Zhang J, Sun K. Invited commentary: the incremental value of customization in defining abnormal fetal growth status. Am J Epidemiol. 2013;178:1309–1312. doi: 10.1093/aje/kwt174. [DOI] [PubMed] [Google Scholar]
- 39.Carberry AE, Raynes-Greenow CH, Turner RM, Jeffery HE. Customized versus population-based birth weight charts for the detection of neonatal growth and perinatal morbidity in a cross-sectional study of term neonates. Am J Epidemiol. 2013;178:1301–1308. doi: 10.1093/aje/kwt176. [DOI] [PubMed] [Google Scholar]
- 40.Rijken MJ, Mulder EJ, Papageorghiou AT, Thiptharakun S, Wah N, Paw TK, Dwell SL, Visser GH, Nosten FH, McGready R. Quality of ultrasound biometry obtained by local health workers in a refugee camp on the Thai-Burmese border. Ultrasound Obstet Gynecol. 2012;40:151–157. doi: 10.1002/uog.11091. [DOI] [PMC free article] [PubMed] [Google Scholar]
- 41.Ioannou C, Talbot K, Ohuma E, Sarris I, Villar J, Conde-Agudelo A, Papageorghiou AT. Systematic review of methodology used in ultrasound studies aimed at creating charts of fetal size. BJOG. 2012;119:1425–1439. doi: 10.1111/j.1471-0528.2012.03451.x. [DOI] [PubMed] [Google Scholar]
- 42.Mola GD, Kombuk B, Amoa AB. Poor weight gain in late third trimester: a predictor of poor perinatal outcome for term deliveries? P N G Med J. 2011;54:164–173. [PubMed] [Google Scholar]
Associated Data
This section collects any data citations, data availability statements, or supplementary materials included in this article.