Abstract
Sylvatic arboviruses have been isolated in Senegal over the last 50 years. The ecological drivers of the pattern and frequency of virus infection in these species are largely unknown. We used time series analysis and Bayesian hierarchical count modeling on a long-term arbovirus dataset to test associations between mosquito abundance, weather variables, and the frequency of isolation of dengue, yellow fever, chikungunya, and Zika viruses. We found little correlation between mosquito abundance and viral isolations. Rainfall was a negative predictor of dengue virus (DENV) isolation but a positive predictor of Zika virus isolation. Temperature was a positive predictor of yellow fever virus (YFV) isolations but a negative predictor of DENV isolations. We found slight interference between viruses, with DENV negatively associated with concurrent YFV isolation and YFV negatively associated with concurrent isolation of chikungunya virus. These findings begin to characterize some of the ecological associations of sylvatic arboviruses with each other and climate and mosquito abundance.
Introduction
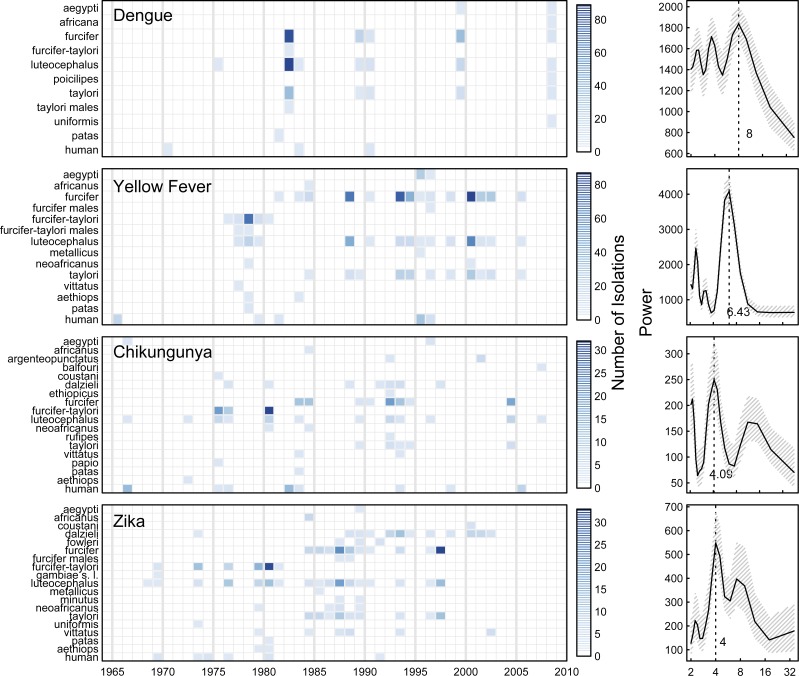
Mosquito-borne dengue (DENV), chikungunya (CHIKV), yellow fever (YFV), and Zika (ZIKAV) viruses all circulate periodically in sylvatic cycles in the forests of Senegal,1 are transmitted predominantly by Aedes mosquitoes, and put those people living around or working in the forests at direct risk for infection. These sylvatic cycles have been confirmed by isolation of virus from mosquitoes captured in gallery forests2 and detection of antiviral antibodies and isolation of sylvatic viruses from non-human primates and humans.3 Routine surveillance for multiple mosquito-borne viruses, using mosquito capture by human landing collection in gallery forests as well as periodic and opportunistic capture of primates (Figure 1), has been conducted in southeast Senegal for over 50 years by the Institut Pasteur de Dakar. Virus isolations from mosquitoes and non-human primates have revealed interesting patterns in the periodicity and synchrony of DENV circulation,4 but the drivers of these patterns are poorly understood. Differences have been observed in the periodicities of viral isolations across the four viruses, although these patterns have not been fully described, especially for ZIKAV.4 These patterns in viral abundance could stem from processes within their mammalian hosts, including cycling of immunity, cross-immunity between viruses, and host demographics and abundance. Additionally, variation in transmission by vectors caused by changes in vector abundance, competence, behavior, or distribution could shape virus dynamics.
Figure 1.
Summary of DENV, YFV, CHIKV, and ZIKAV isolates from 1962 to 2008. Left shows the number of DENV, YFV, CHIKV, and ZIKAV isolates over time by species. Scales on the right indicate the number of isolations. Right shows the Fourier power spectra with Daniell smoothers of (3,3) with 95% bootstrap CIs for the aggregated DENV, YFV, CHIKV, and ZIKAV isolates. Species were included if there was an isolation over the study period. Patas indicates opportunistic isolations from Erythrocebus patas, papio indicates Papio papio, aethiops indicates Chlorocebus aethiops, and human indicates humans.
Ambient temperature can influence these mosquito traits in several ways. First, the extrinsic incubation period (EIP), defined as the time interval between vector infection and transmission, is influenced by temperature5 and directly affects the force of infection for DENV.6–8 The EIP for DENV ranges from 15 days at 25°C to 6.5 days at 30°C9 and from 4 days at 37° to more than 30 days at 18° for YFV.10 Second, higher temperatures result in higher viral replication of DENV in Aedes.5 Third, temperature influences vector lifecycle and therefore, abundance. Ae. (Stegomyia) albopictus fecundity has been shown to vary quadratically with temperature, with an optimum between 25°C and 30°C. Elevated temperatures also decreased Ae. albopictus survival.11 Rainfall also directly impacts vector populations through availability of suitable aquatic habitats. Previous studies have suggested potential interactions between temperature and rainfall in determining the population density of Aedes mosquitoes, with increasing temperatures lowering the effects of variability in aquatic sites (total available water).12
In the current study, we explored potential drivers of arbovirus isolations in Senegal using unique long-term ecological data collected by the Institute Pasteur de Dakar on abundance of potential arbovirus vectors and the frequency of arbovirus isolations from those vectors. Specifically, we aimed to (1) describe the temporal dynamics of Aedes mosquito counts observed in Senegal over the past 50 years, (2) describe the temporal dynamics of DENV, YFV, CHIK, and ZIKAV isolation from those mosquitoes, and (3) explore two potential drivers of total virus isolations for each virus: weather (as deviations from mean values of annual rainfall and annual mean ambient temperature) and mosquito abundance, which may vary as a result of climate variations.
Methods
Entomological data and virus isolations.
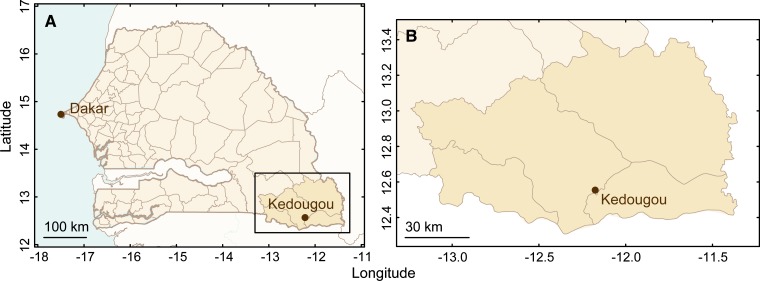
Routine arbovirus surveillance has been conducted in the Kedougou region of southwestern Senegal since the early 1960s. Collection methods have been described previously.2,3,13 Briefly, mosquitoes were collected at savanna and gallery forest sites surrounding Kedougou (12°11′ W, 12°33′ N) (Figure 2). The majority of mosquitoes were collected by human landing collection during the rainy season (generally June through October), with individuals collecting mosquitoes for 2 hours around dusk. Collections were made at particular times of the year and times of the day that have remained stable over the decades of this study. Mosquitoes were frozen and sorted into monospecific single-sex pools and transported to the laboratory at the Institute Pasteur, Dakar, where they were tested for DENV, YFV, CHIK, and ZIKAV in the mosquito cell line AP61 (Ae. pseudoscutellaris) as described previously.14 All virus isolates were identified using immunofluorescence with virus-specific immune ascitic fluid and confirmed by complement fixation or neutralization tests.
Figure 2.
Maps show the location of Kedougou, Senegal in relation to Dakar, Senegal (panel A), and the region of Kedougou (panel B).
Data presented here are absolute abundances of Ae. furcifer, Ae. taylori, and Ae. luteocephalus collected each year from 1972 to 2008. Before 1990, Ae. furcifer and Ae. taylori were not considered separate species and as such, are presented as a single time series. Because viral isolations occurred in pools of mosquitoes, we calculated the minimum infection rate (MIR).15 We present isolation data from other mosquito species but lack abundance data for these species (Ae. dalzieli, Ae. aegypti, Ae. vittatus, An. africanus coustani, Ae. neoafricanus, Ae. fowleri, Ae. argenteopunctatus, Uranotaenia balfouri, Anopheles gambiae s.l., Ae. metallicus, An. rufipes, Culex ethiopicus, Ae. minutus, Cx. poicilipes, Mansonia africana, and M. uniformis).
Weather data.
Weather data for Kedougou was downloaded from the National Oceanic and Atmospheric Administration (NOAA) Climate Data Online tool.† Data included daily maximum and minimum temperatures, dew point, and inches of precipitation. Relative humidity was calculated from temperature and dew point using the Arden Buck equation.16 Yearly means (January 1 through December 31) of temperature and relative humidity were calculated. Rainfall was included as a sum total across a year. Aggregates were made with available data, and missing data were ignored. Spuriously large values of climate variables (rain > 50 in/day and temperatures > 125°C) were removed.
Statistical methodology.
The goals of the analysis were to identify temporal trends in arbovirus isolations over time and estimate the influence of various climactic factors on those trends. Fourier spectra were calculated on the numbers of isolations over time summed both across species and for each species individually.17 Cross-correlation between the four virus isolations was calculated to assess temporal associations between them.
To identify temporal associations between weather, mosquitoes, and virus isolations, cross-correlations were computed. We formulated a Bayesian hierarchical Poisson model both with and without an overdispersion term to the mosquito abundance data and numbers of isolations with mosquito counts as the offset terms.18–20 This approach borrows strength from all the observations. For time t and virus v, the expected number of counts, yv,t, is
where Poi(μv,t) indicates a Poisson distribution with mean μv,t offset equal to the number of mosquito isolations in year t, overdispersion δv,t ∼ N(0, τδ),  , σd ∼ Unif(0, σδ), i covariates, and the hierarchy
Asterisks indicate that the variables are hyperparameters, and d indicates the virus (DENV, YFV, CHIKV, or ZIKAV). Variables included were the number of individuals collected from different mosquito species (Ae. furcifer, Ae. taylori, Ae. luteocephalus, and combined Ae. furcifer/Ae. taylori), counts of the total other virus isolates within the year, mean temperature and relative humidity, and sum of total rainfall. Mean values were chosen to represent yearly deviations from a normal year calculated using the entire range of the time series, and sum of total rainfall was chosen to represent the total amount of rain available for mosquito breeding. Data were mean-centered to aid in interpretability of the intercept term. Regression models were fit for both the mosquito abundances over time (with no offset term but a lagged mosquito count of t − 1) and total viral isolations in a year. To assess the effect of aggregating the weather variables at an annual level and because the vast majority of mosquitoes are captured in the wet season, models were fit to weather variables aggregated across the wet season (June through October) and the dry season (November through May) and are presented in Supplemental Material. Regression models were subjected to standard model checks (autocorrelation of time series, autocorrelation of errors, and heteroskedasticity).
Hierarchical clustering was performed on virus isolations across mosquito species to find structure in isolation patterns. Virus isolations were summed across each mosquito species. A dendrogram was calculated using Euclidian distance between viral isolations in each mosquito species over time. A distance matrix was calculated using the Spearman correlation between the viral times series.
Results
Mosquito abundance.
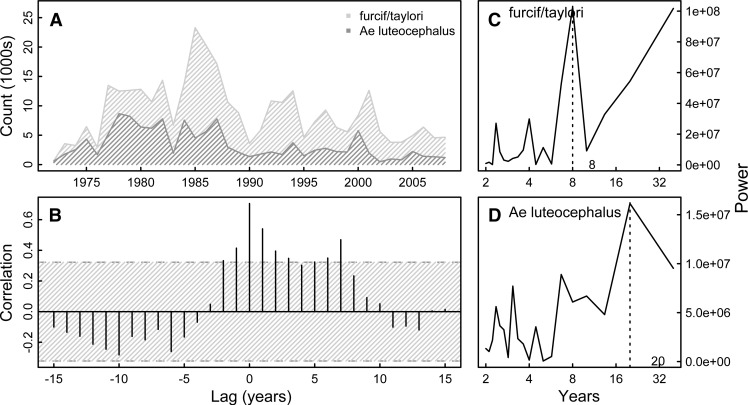
Mosquito abundance data were available by year for Ae. furcifer, Ae. taylori, Ae. luteo-cephalus, and combined Ae. furcifer/Ae. taylori. Time series of abundances for each of these four mosquito species (or groups of species) showed no autocorrelation and dominant frequencies of 4, 4, 20, and 8 years, respectively (Figure 3 and Supplemental Figure 1). Significant cross-correlation between Ae. luteocephalus and combined Ae. furcifer/Ae. taylori abundances exists at lags up to 7 years (Figure 3), whereas cross-correlations between Ae. furcifer and Ae. taylori since 1990 are only significant up to 1 year of lag (Supplemental Figure 1).
Figure 3.
Aedes mosquito captures and cross-correlation. Figure shows time series of Ae. luteocephalus and Ae. furcifer/Ae. taylori captures over time (A) with the corresponding cross-correlation plot (B) and Fourier spectra (C and D). Hatched area in B indicates 95% CI assuming an underlying white noise process.17 We see marked cross-correlation between mosquito isolates up to lags of 7 years. Ae. furcifer/Ae. taylori have a dominant periodicity of 8 years, and Ae. luteocephalus has a dominant periodicity of 20 years.
As shown in Table 1, both Ae. furcifer/Ae. taylori and Ae. luteocephalus abundances were significantly associated with the previous year count [5% (95% confidence interval [95% CI] = 1.4%, 8.7%) increase in Ae. furcifer/Ae. taylori per 1,000 mosquitoes in the previous year and 15.4% (95% CI = 4.7%, 27%) increase in Ae. luteocephalus]. Increases in relative humidity and mean temperature were marginally associated with decreases in Ae. luteocephalus abundance (3.4% decrease [95% CI = −2.8%, 9.2%]; coefficient = 0.966 in abundance per point increase in relative humidity and 15% [95% CI = −12%, 36%] decrease in abundance per 1° increase above normal temperature). These associations were statistically significant when summarizing weather variables across the wet season (Supplemental Material). Examination of the residuals confirmed independence of the errors and slight heteroskedasticity.
Table 1.
Drivers of mosquito abundance
| Ae. furcifer/Ae. taylori | Ae. leuteocephalus | |||
|---|---|---|---|---|
| Estimate | 95% CI | Estimate | 95% CI | |
| Intercept | 5,173.364 | 3,614.152, 7,389.723 | 1,641.944 | 1,079.328, 2,493.443 |
| Lag count (per 1000) | 1.050* | 1.014, 1.087* | 1.154* | 1.047, 1.272* |
| Sum of rain (in) | 1.010 | 0.996, 1.024 | 1.013 | 0.993, 1.034 |
| Relative humidity | 0.966 | 0.924, 1.009 | 0.966 | 0.908, 1.028 |
| Mean temperature (°C) | 0.932 | 0.768, 1.131 | 0.850 | 0.642, 1.116 |
The results of a Bayesian hierarchical overdispersed Poisson regression with Ae. furcifer/Ae. taylori and Ae. luteocephalus mosquito abundance as the count, mosquito count from the previous year (lag; in 1,000s), total rainfall in a season, and mean temperature and relative humidity over 1 year. Data were mean-centered to aid interpretation. The intercept corresponds to the expected number of Ae. furcifer/Ae. taylori or Ae. luteocephalus in 1 year with mean counts of mosquitoes in the previous year, mean amounts of rain, temperature, and relative humidity.
Statistically significant coefficients.
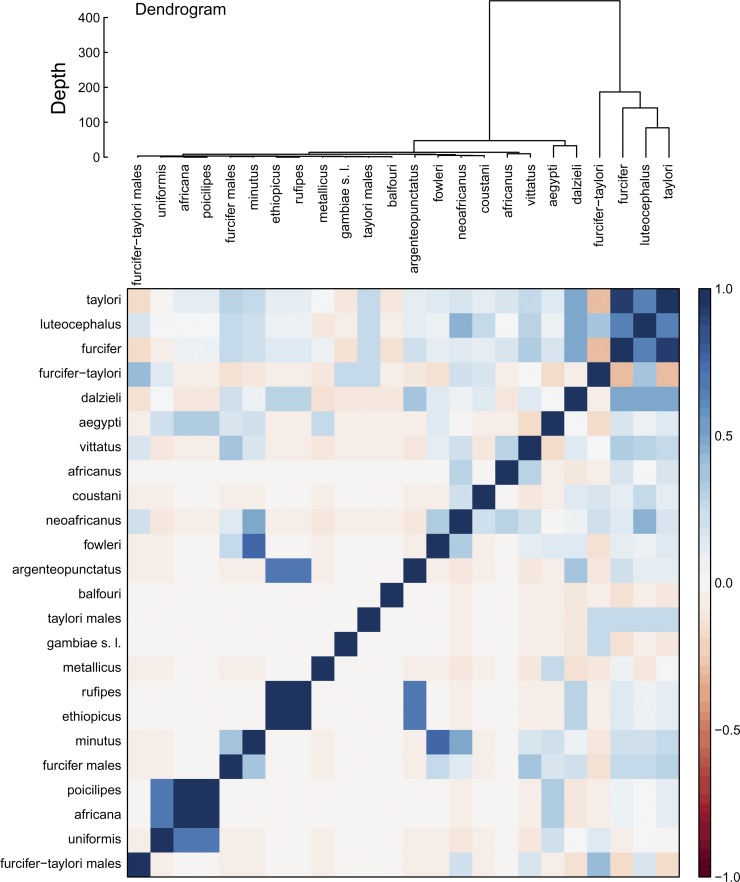
Clustering mosquitoes by numbers of virus isolations over time indicates that Ae. furcifer, Ae. taylori, and Ae. luteocephalus clustered apart from the other mosquito species (Figure 4). The correlation between these species is stronger than any other pairing. Additional clusters included An. rufipes and Cx. ethiopicus and Cx. poicilipes, M. africana, and M. uniformis.
Figure 4.
Relationships between mosquito species through virus isolations. Virus isolations were summed across each mosquito species. A dendrogram was calculated using Euclidian distance between viral isolations in each mosquito species. Distance matrix below the dendrogram reports the Spearman correlation between the viral times series.
DENV.
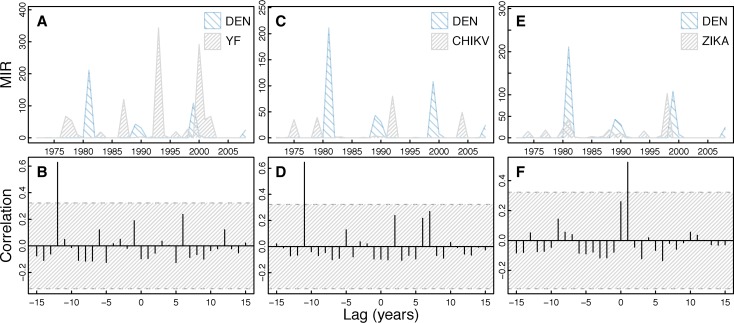
Fourier analysis of all DENV isolates shows a dominant periodicity of 8.0 years (Figure 1). In general, cross-correlation analysis of DENV isolates shows a lack of correlation with the appearance of other viruses individually (Figure 5) and mosquito species abundance individually (Supplemental Figure 2). DENV was significantly positively correlated with YFV and CHIKV viruses at lags of −12 and −11 years, respectively, and was significantly positively correlated at a lag of 1 year with ZIKAV (Figure 5). DENV was marginally statistically significantly positively correlated with Ae. furcifer/Ae. taylori isolates at a lag of −4 years, marginally statistically significantly negatively correlated with Ae. furcifer/Ae. taylori isolates at 9 years, and positively correlated with Ae. luteocephalus at 3 years (Supplemental Figure 2).
Figure 5.
Cross-correlation of DENV isolates and other virus isolates. The figure shows a time series of DENV isolates compared with the other virus isolates over time (A, C, and E) with corresponding cross-correlation plots (B, D, and F). Hatched areas in B, D, and F indicate 95% CI for correlation assuming an underlying white noise process.17 We observed significant cross-correlation between DENV and YFV at −12-year lag, significant cross-correlation between DENV and CHIKV at −11-year lag, and significant cross-correlation between DENV and ZIKAV at a 1-year lag.
Tables 2 and 3 report the results of the hierarchical overdispersed Poisson regression with numbers of mosquito isolations as the offset. The expected MIR (the number of positive isolates divided by the number of mosquitoes collected) in Ae. luteocephalus within 1 year with mean rainfall, temperature, and relative humidity at their multiyear mean and no other virus isolations is 1.7 · 10−5% (95% CI = 5.7 · 10−6%, 3.6 · 10−5%). DENV isolations were negatively associated with rainfall, with MIR decreasing 9.7% (95% CI = 3.3%, 16%) for each additional 1 in of rain from baseline (coefficient = 0.903). Increasing mean temperatures were associated with a strong decrease in DENV MIR, albeit not significant (53% decrease [95% CI = −12%, 82%]). DENV MIR in Ae. furcifer/Ae. taylori was 84% (95% CI = 53%, 96%) lower than in Ae. luteocephalus. The MIR of DENV was not significantly associated with relative humidity or concurrent isolations of the other viruses, although we observed a trend for DENV isolates to be reduced in the presence of CHIKV (12% [95% CI = −1%, 31%] decrease in DENV MIR per CHIKV isolate).
Table 2.
Drivers of viral isolations
| DENV | YFV | |||
|---|---|---|---|---|
| Estimate | 95% CI | Estimate | 95% CI | |
| Intercept | 1.69 · 10−5 | 3.63 · 10−6, 5.66 · 10−5 | 4.89 · 10−5 | 1.35 · 10−5, 1.40 · 10−4 |
| Ae. furcifer | 0.203 | 0.00704, 4.63 | 0.201 | 0.00722, 5.82 |
| Ae. furcifer/Ae. taylori | 0.160* | 0.0368, 0.467* | 0.282* | 0.106, 0.967* |
| Ae. taylori | 0.202 | 0.00611, 4.97 | 0.202 | 0.00612, 6.05 |
| Pre-1990 | 2.08 | 0.423, 10.9 | 1.94 | 0.447, 9.59 |
| Sum of rain (in) | 0.903* | 0.840, 0.967* | 0.988* | 0.936, 1.04* |
| Relative humidity | 0.952 | 0.787, 1.12 | 0.943 | 0.804, 1.08 |
| Mean temperature (C°) | 0.469 | 0.180, 1.12 | 2.67 | 1.14, 6.76 |
| DENV | − | − | 0.949* | 0.868, 0.999* |
| YFV | 1.02 | 0.990, 1.04 | − | − |
| CHIKV | 0.881 | 0.692, 1.01 | 1.02 | 0.945, 1.10 |
| ZIKAV | 0.903 | 0.748, 1.04 | 1.05 | 0.979, 1.13 |
The table reports the results of a Bayesian hierarchical overdispersed Poisson regression of viral isolations with mosquito abundance as the offset, species of mosquito as a categorical variable, total rainfall in a season, mean temperature, relative humidity over 1 year, and isolations of the other three viruses. Data were mean-centered to aid interpretation. The model intercepts correspond to the expected MIR of DENV and YFV in Ae. luteocephalus over 1 year with average amounts of rain, temperature, and relative humidity and no concurrent isolation of other viruses.
Statistically significant coefficients.
Table 3.
Drivers of viral isolations
| CHIKV | ZIKAV | |||
|---|---|---|---|---|
| Estimate | 95% CI | Estimate | 95% CI | |
| Intercept | 1.77 · 10−5 | 4.75 · 10−6, 5.59 · 10−5 | 1.33 · 10−5 | 2.95 · 10−6, 4:77 · 10−5 |
| Ae. furcifer | 0.205 | 0.00975, 5.42 | 0.205 | 0.00763, 4.33 |
| Ae. furcifer/Ae. taylori | 0.184* | 0.0449, 0.566* | 0.198* | 0.0620, 0.590* |
| Ae. taylori | 0.208 | 0.00690, 5.40 | 0.203 | 0.00670, 5.78 |
| Pre-1990 | 3.37 | 0.594, 23.6 | 11.4* | 2.29, 57.6* |
| Sum of rain (in) | 1.02 | 0.961, 1.09 | 1.12* | 1.05, 1.21* |
| Relative humidity | 1.10 | 0.928, 1.34 | 0.937 | 0.766, 1.09 |
| Mean temperature (C°) | 1.56 | 0.611, 4.93 | 0.929 | 0.381, 2.12 |
| DENV | 0.995 | 0.930, 1.05 | 0.978 | 0.946, 1.01 |
| YFV | 0.933* | 0.848, 0.988* | 0.968 | 0.927, 1.00 |
| CHIKV | − | − | 0.885 | 0.690, 1.02 |
| ZIKAV | 0.873 | 0.687, 1.02 | − | − |
The table reports the results of a Bayesian hierarchical overdispersed Poisson regression of viral isolations with mosquito abundance as the offset, species of mosquito as a categorical variable, total rainfall in a season, mean temperature, relative humidity over 1 year, and isolations of the other three viruses. Data were mean-centered to aid interpretation. The model intercepts correspond to the expected MIR of CHIKV and ZIKAV in Ae. luteocephalus over 1 year with average amounts of rain, temperature, and relative humidity and no concurrent isolation of other viruses.
Statistically significant coefficients.
YFV.
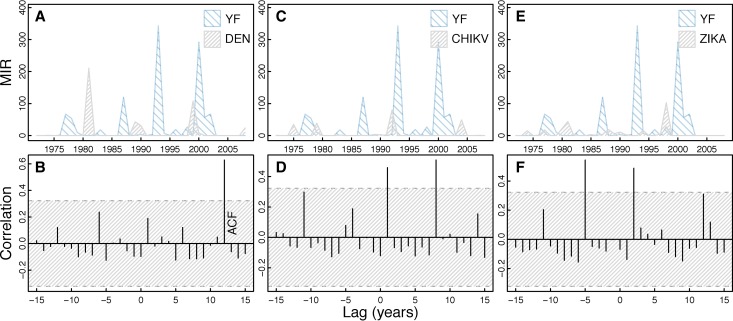
YFV isolates show a dominant periodicity of 6.4 years (Figure 1). In general, cross-correlation analysis of YFV isolates shows a lack of correlation with the other viruses individually (Figure 6) and mosquito species (Supplemental Figure 3). YFV was significantly positively correlated with CHIKV at lags of 1 and 8 years and ZIKAV at lags of −5 and 2 years (Figure 6). YFV was significantly positively correlated with Ae. furcifer/Ae. taylori isolates at a lags of 8 and 15 years and not correlated with Ae. luteocephalus (Supplemental Figure 3).
Figure 6.
Cross-correlation of YFV isolates and other virus isolates. The figure shows a time series of YFV isolates compared with the other virus isolates over time (A, C, and E) with corresponding cross-correlation plots (B, D, and F). Hatched areas in B, D, and F indicate 95% CI for correlation assuming an underlying white noise process.17 We see significant cross-correlation between YFV and CHIKV at 1- and 8-year lags and 2- and 5-year lags for ZIKAV. This figure appears in color at www.ajtmh.org.
As shown in Tables 2 and 3, we find that the expected MIR in Ae. luteocephalus with mean climate variables and no other viral isolations was 4.9 · 10−5% (95% CI = 1.35 · 10−5%, 1.4 · 10−4%). YFV isolations were positively associated with mean temperature, with a 1° increase above normal temperature increasing the MIR 2.7-fold (95% CI = 1.14, 6.8). The MIR of YFV was negatively associated with Ae. furcifer/Ae. taylori (relative MIR, 0.28 [95% CI = 0.11, 0.97]) and marginally negatively associated with concurrent DENV isolation, with each concurrent DENV isolation decreasing YFV MIR by 5.1% (95% CI = 0.1%, 13%).
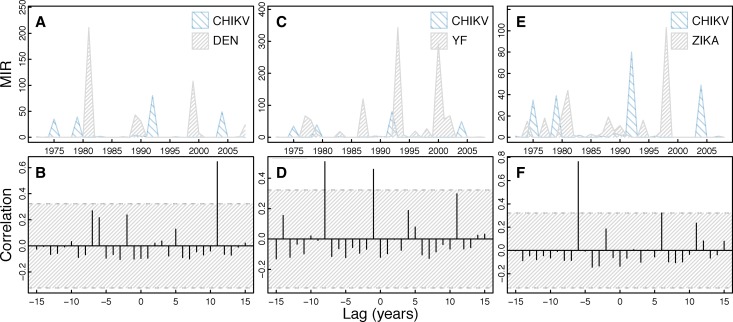
CHIKV.
The dominant periodicity of CHIKV isolates is 4.1 years (Figure 1). In general,, cross-correlation analysis of CHIKV isolates shows a lack of correlation with the other viruses (Figure 7) and mosquito abundance individually (Supplemental Figure 4). CHIKV was significantly positively correlated with ZIKAV at a lag of −6 years (Figure 7). CHIKV was not significantly correlated with Ae. furcifer/Ae. taylori or Ae. luteocephalus (Supplemental Figure 4).
Figure 7.
Cross-correlation of CHIKV isolates and other virus isolates. The figure shows a time series of CHIKV isolates compared with the other virus isolates over time (A, C, and E) with corresponding cross-correlation plots (B, D, and F). Hatched areas in B, D, and F indicate 95% CI for correlation assuming an underlying white noise process.17 This figure appears in color at www.ajtmh.org.
The overdispersed Poisson model for CHIKV isolations indicated the expected MIR in Ae. luteocephalus with mean climate variables and no other viral isolations was 1.8 · 10−5% (95% CI = 4.75 · 10−6%, 5.6 · 10−5%). CHIKV isolations were not associated with any of the climactic variables. CHIKV MIR in Ae. furcifer/Ae. taylori was 82% (95% CI = 43%, 96%) lower than in Ae. luteocephalus. CHIKV MIR was negatively associated with YFV, with each concurrent YFV isolation decreasing CHIKV MIR by 7% (95% CI = 1%, 15%). CHIKV MIR was not significantly associated with concurrent DENV or ZIKAV isolations.
ZIKAV.
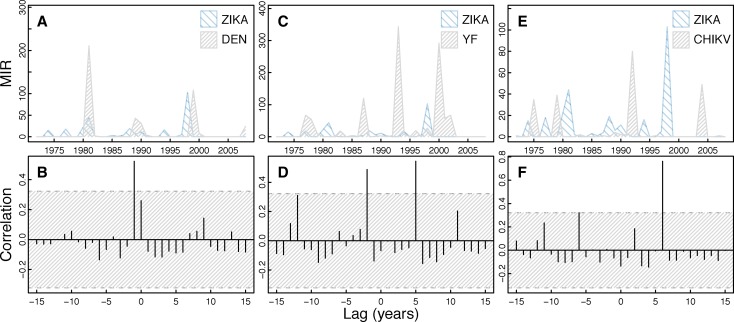
The dominant periodicity of ZIKAV isolates is 4.0 years (Figure 1). In general, cross-correlation analysis of CHIKV isolates shows a lack of correlation with the other viruses (Figure 8) and mosquito abundance individually (Supplemental Figure 5). ZIKAV was significantly positively correlated with CHIV at a lag of 6 years (Figure 7). ZIKAV was significantly positively correlated with Ae. furcifer/Ae. taylori at a lag of 13 years but not correlated with Ae. luteocephalus (Supplemental Figure 5).
Figure 8.
Cross-correlation of ZIKAV isolates and other virus isolates. The figure shows a time series of ZIKAV isolates compared with the other virus isolates over time (A, C, and E) with corresponding cross-correlation plots (B, D, and F). Hatched areas in B, D, and F indicate 95% CI for correlation assuming an underlying white noise process.17 This figure appears in color at www.ajtmh.org.
The overdispersed Poisson model for ZIKAV isolations indicated that the expected MIR in Ae. luteocephalus with mean climate variables and no other viral isolations was 1.3 · 10−5% (95% CI = 2.9 · 10−6%, 4.8 · 10−5%). ZIKAV isolations were associated with mean rainfall, with a 12% (95% CI = 5%, 21%) increase for each additional 1 in of rain above baseline. ZIKAV was not associated with mean temperature or humidity. ZIKAV MIR in Ae. furcifer/Ae. taylori was 80% (95% CI = 41%, 94%) lower than in Ae. luteocephalus and strongly associated with pre-1990 isolations (11-fold difference [95% CI = 2.3, 57]) (Figure 1). ZIKAV MIR was marginally negatively associated with concurrent isolations of all three of the other viruses, with each concurrent isolation of DENV, YFV, and CHIKV decreasing ZIKAV MIR 2% (95% CI = −1%, 5%), 3% (95% CI = 0%, 7%), and 12% (95% CI = 2%, 31%), respectively.
Discussion
In this study, we explored temporal patterns of mosquito vector abundance and frequency of sylvatic arbovirus isolations, and we assessed the ecological associations of viral isolations with each other, climatological variables (rainfall, temperature, and humidity), and abundance of particular mosquito species using a uniquely rich longitudinal dataset from Senegal. In general, we found little cross-correlation between viruses or between virus isolations and mosquito abundance. We found significant differences between Ae. luteocephalus, Ae. furcifer, and Ae. taylori abundances over time. As might be expected, increasing total rainfall in a season was associated with an increase in abundance of both mosquito species, albeit the association was small: 1.3% (95% CI = −0.7%, 3.4%) increase in Aedes leuteocephalus and 1% (95% CI = −0.4%, 2.4%) increase in Ae. furcifer/Ae. taylori abundance for each additional 1 in of rain. This amount may not be negligible, however, as there is a mean of 11.5 in of rain per year (variance = 26.5 in). Mirroring previous studies, we found a decrease in mosquito abundance as temperatures and relative humidity increased above baseline mean values.11 The mean temperature over the study period was 29°C, and mean relative humidity was 47%. Delatte and others11 found decreased fecundity and survival of Ae. albopictus for temperatures moving above 30°C in a laboratory setting. Tun-Lin and others21 found a similar decrease in survival of immature Ae. aegypti for eggs incubated at 30°C and 35°C.
We hypothesized that intrinsic variations in vector competence may be one of the key drivers of the observed differences in transmission dynamics of sylvatic arboviruses. Ae. furcifer, Ae. taylori, Ae. luteocephalus, Ae. vittatus, and Ae. aegypti are all widely present in Senegal3 and differ dramatically in their experimentally determined vector competencies for DENV and YFV.22 The DENV dissemination rates for Ae. furcifer captured in Senegal can be as high as 75%,13 whereas those for YFV are estimated at 20%.23 These estimates, based on experimental infections, were highly variable and depended on specific virus strain and mosquito genetics.24,25 Here, we found much lower viral MIRs in Ae. furcifer or Ae. taylori compared with Ae. luteocephalus for all viruses. Although these dissemination estimates are laboratory-based, they provide an idea of the behavior of the natural system, which is indeed reflected in the isolation data.
Clustering mosquito species by all viral isolations together indicated that Ae. luteocephalus, Ae. furcifer, and Ae. taylori were separate from other species, with the next largest cluster being Ae. aegypti and Ae. dalzieli. Historically, Ae. furcifer and Ae. taylori have been difficult to differentiate morphologically, with some studies considering them a single species complex.26 However, recent phylogenetic analyses have shown that they can be differentiated by their sequences of cytochrome oxidase c subunits (COIs).27 Phylogenetic trees of COI subunit 2 indicate that Ae. furcifer, Ae. taylori, Ae. luteocephalus, and Ae. aegypti are within a single clade,27 which is echoed here (Figure 4).
Weather-driven variation in vector competence and differences in the responses of individual vector species and viruses to variation in the weather may also account for patterns in arbovirus circulation. Temperature has been shown to directly affect the force of infection for arboviruses by changing the EIP5 and viral replication rates.6,7 In general, EIP is inversely associated with temperature, with increasing temperatures leading to shorter EIPs. Lambrechts and others7 found a moderate association between diurnal temperature range and vector competence for DENV, with larger diurnal temperature range being associated with lower midgut infection and dissemination rates. Wu and others28 found an increase in cumulative incidence of human dengue disease with increasing temperature in Taiwan. We found a strongly negative association between mean temperature and the MIR for DENV. In contrast, we found a strongly positive relationship between the YFV MIR and mean temperature, but in line with what we observed, positive temperature associations have been observed for infection of mosquitoes by YFV.10 Importantly, our results hold when considering only the dynamics within the wet season. Ultimately, it may be that some of the observed associations are caused by limitations in the data, including the annual timescale on which most data were collected, and bias introduced through use of human landing capture and non-systematic selection of landing sites.
DENV has been shown to have immunologic cross-reactivity with YFV29,30 and ZIKAV,31,32 which may impart partial protection from infection. We found that YFV was negatively associated with concurrent DENV isolations (though not vice versa) but the reductions were small (∼5%) and marginally significant. Similar cross-reactivity may occur with ZIKAV. An examination of sera taken from convalescent-phase patients after the outbreak of ZIKAV on Yap Island showed more frequent cross-reactivity to other aviviruses than to primary ZIKAV infection, and cross-reactivity was most frequent with DENV.31 We found that both YFV and DENV were negatively associated with ZIKAV, although the estimates were marginally not significant. As an alphavirus, CHIKV does not cross-react with DENV, YFV, and ZIKAV. Nonetheless, we found a significant negative association between CHIKV and YFV, with reductions in CHIKV MIR up to 7% per isolation of YFV, and a marginally non-significant negative association between CHIKV and ZIKAV. Negative associations between any of these viruses may be attributable to interactions in coinfected mosquitoes.33 Such interactions may be mediated by mosquito immunity; however, more research in this area is needed.34 Alternatively, the negative associations may reflect associations between the ecological conditions that favor each virus.
The data included in this study are the most comprehensive of their kind for West Africa.3,35 However, our data and this analysis have several limitations. The observed arbovirus dynamics may be heavily influenced by bias in the surveillance techniques used to generate the data. Reliance on small amounts of human landing collections may have resulted in undersampling during smaller outbreaks of DENV, YFV, CHIKV, or ZIKAV. Although techniques were kept fairly standard over the period of surveillance, secular changes in the data may reflect changes in collection methods over time. Our data on mosquito abundance were limited to Ae. luteocephalus, Ae. furcifer, and Ae. taylori and aggregated to yearly counts. Additionally, viral isolations were aggregated at the yearly level. Many of the processes examined here may function at timescales shorter than annually; however, this study summarizes 50 years of historical data and provides insight into processes that are difficult to observe. Because of the yearly aggregation, climactic variables were summarized over 1 year, which is one of a myriad ways of summarizing these data; we attempted to be as parsimonious as possible in our summaries. Climactic variables did include data that were completely missing; however, the absolute amount of missing data was small, and the data are historic and the best available. We do not have concurrent isolations of two viruses within one mosquito to examine true interaction between viruses, but isolations of multiple viruses within a season can be used to explore cocirculation and interaction. Finally, all of the associations presented here are ecological, and as such, causality cannot be asserted between associations.
Sylvatic arboviruses have the potential to cause major morbidity and mortality, and infected non-human primate hosts will continue to function as reservoirs of virus in post-vaccination scenarios. An accurate and thorough understanding of the sylvatic cycle of DENV, YFV, CHIKV, and ZIKAV, including the roles that ecological effects play on transmission dynamics, may allow prediction of epidemics and lessen the impact on humans living in rural and urban areas. Knowledge of the sylvatic cycle is especially important given evidence of recent introductions of sylvatic DENV into human populations.1,36–38 The current study is another step forward in the understanding of the determinants of sylvatic DENV transmission dynamics.
Supplementary Material
Footnotes
Financial support: This work was funded by National Institutes of Health Grant AI069145 (to K.A.H, S.C.W., and D.A.T.C.) as well as US National Institutes of Health National Institute of General Medical Sciences Models of Infectious Disease Agent Study (MIDAS) Grant 1U54GM088491-0109 (to D.A.T.C.). B.M.A. acknowledges National Science Foundation Graduate Research Fellowship Grant DGE-0707427 and the Omidyar Postdoctoral Fellowship Program. D.A.T.C. holds a Career Award at the Scientific Interface from the Burroughs Wellcome Fund.
Authors' addresses: Benjamin M. Althouse, Santa Fe Institute, Santa Fe, NM, E-mail: althouse@santafe.edu. Kathryn A. Hanley, Department of Biology, New Mexico State University, Las Cruces, NM, E-mail: khanley@nmsu.edu. Mawlouth Diallo, Amadou A. Sall, Yamar Ba, Ousmane Faye, and Diawo Diallo, Institut Pasteur de Dakar, Dakar, Senegal, E-mails: diallo@pasteur.sn, asall@pasteur.sn, yba@pasteur.sn, fayeo@orange.sn, and diawod@yahoo.com. Douglas M. Watts, Office of Research and Sponsored Projects, University of Texas, El Paso, TX, and Tropical Diseases and Department of Pathology, University of Texas Medical Branch, Galveston, TX, E-mail: dwatts2@utep.edu. Scott C. Weaver, Department of Microbiology and Immunology, University of Texas Medical Branch, Galveston, TX, E-mail: sweaver@utmb.edu. Derek A. T. Cummings, Department of Epidemiology, Johns Hopkins Bloomberg School of Public Health, Baltimore, MD, E-mail: dcumming@jhsph.edu.
References
- 1.Vasilakis N, Cardosa J, Hanley KA, Holmes EC, Weaver SC. Fever from the forest: prospects for the continued emergence of sylvatic dengue virus and its impact on public health. Nat Rev Microbiol. 2011;9:532–541. doi: 10.1038/nrmicro2595. [DOI] [PMC free article] [PubMed] [Google Scholar]
- 2.Diallo M, Thonnon J, Traore-Lamizana M, Fontenille D. Vectors of chikungunya virus in Senegal: current data and transmission cycles. Am J Trop Med Hyg. 1999;60:281–286. doi: 10.4269/ajtmh.1999.60.281. [DOI] [PubMed] [Google Scholar]
- 3.Diallo M, Ba Y, Sall AA, Diop OM, Ndione JA, Mondo M, Girault L, Mathiot C. Amplification of the sylvatic cycle of dengue virus type 2, Senegal, 1999–2000: entomologic findings and epidemiologic considerations. Emerg Infect Dis. 2003;9:362–367. doi: 10.3201/eid0903.020219. [DOI] [PMC free article] [PubMed] [Google Scholar]
- 4.Althouse BM, Lessler J, Sall AA, Diallo M, Hanley KA, Watts DM, Weaver SC, Cummings DA. Synchrony of sylvatic dengue isolations: a multi-host, multi-vector SIR model of dengue virus transmission in Senegal. PLoS Negl Trop Dis. 2012;6:e1928. doi: 10.1371/journal.pntd.0001928. [DOI] [PMC free article] [PubMed] [Google Scholar]
- 5.Watts DM, Burke DS, Harrison BA, Whitmire RE, Nisalak A. Effect of temperature on the vector efficiency of Aedes aegypti for dengue 2 virus. Am J Trop Med Hyg. 1987;36:143–152. doi: 10.4269/ajtmh.1987.36.143. [DOI] [PubMed] [Google Scholar]
- 6.Focks DA, Daniels E, Haile DG, Keesling JE. A simulation model of the epidemiology of urban dengue fever: literature analysis, model development, preliminary validation, and samples of simulation results. Am J Trop Med Hyg. 1995;53:489–506. doi: 10.4269/ajtmh.1995.53.489. [DOI] [PubMed] [Google Scholar]
- 7.Lambrechts L, Paajimans KP, Fansiri T, Carrington LB, Kramer LD, Thomas MB, Scott TW. Impact of daily temperature fluctuations on dengue virus transmission by Aedes aegypti. Proc Natl Acad Sci USA. 2011;108:7460–7465. doi: 10.1073/pnas.1101377108. [DOI] [PMC free article] [PubMed] [Google Scholar]
- 8.Bellan SE. The importance of age dependent mortality and the extrinsic incubation period in models of mosquito-borne disease transmission and control. PLoS ONE. 2010;5:e10165. doi: 10.1371/journal.pone.0010165. [DOI] [PMC free article] [PubMed] [Google Scholar]
- 9.Chan M, Johansson MA. The incubation periods of dengue viruses. PLoS ONE. 2012;7:e50972. doi: 10.1371/journal.pone.0050972. [DOI] [PMC free article] [PubMed] [Google Scholar]
- 10.Davis NC. The effect of various temperatures in modifying the extrinsic incubation period of the yellow fever virus in Aedes aegypti. Am J Epidemiol. 1932;16:163–176. [Google Scholar]
- 11.Delatte H, Gimonneau G, Triboire A, Fontenille D. Influence of temperature on immature development, survival, longevity, fecundity, and gonotrophic cycles of Aedes albopictus, vector of Chikungunya and dengue in the Indian Ocean. J Med Entomol. 2009;46:33–41. doi: 10.1603/033.046.0105. [DOI] [PubMed] [Google Scholar]
- 12.Alto BW, Juliano SA. Precipitation and temperature effects on populations of Aedes albopictus (diptera: Culicidae): implications for range expansion. J Med Entomol. 2001;38:646–656. doi: 10.1603/0022-2585-38.5.646. [DOI] [PMC free article] [PubMed] [Google Scholar]
- 13.Diallo M, Sall AA, Moncayo AC, Ba Y, Fernandez Z, Ortiz D, Coffey LL, Mathiot C, Tesh RB, Weaver SC. Potential role of sylvatic and domestic African mosquito species in dengue emergence. Am J Trop Med Hyg. 2005;73:445–449. [PubMed] [Google Scholar]
- 14.Digoutte J, Calvo-Wilson M, Mondo M, Traore-Lamizana M, Adam F. Continous cell lines and immune ascitic fluid pools in arbovirus detection. Res Virol. 1992;143:417–422. doi: 10.1016/s0923-2516(06)80135-4. [DOI] [PubMed] [Google Scholar]
- 15.Service MW. Mosquito Ecology: Field Sampling Methods. 2nd ed. London, United Kingdom: Elsevier Applied Science; 1993. [Google Scholar]
- 16.Buck AL. New equations for computing vapor pressure and enhancement factor. J Appl Meteorol. 1981;20:1527–1532. [Google Scholar]
- 17.Chatfield C. The Analysis of Time Series: An Introduction. 6th ed. Boca Raton, FL: Chapaman & Hall/CRC; 2004. [Google Scholar]
- 18.Venables WN, Ripley BD. Modern Applied Statistics with S. New York, NY: Springer; 2002. [Google Scholar]
- 19.Vittinghoff E, Glidden DV, Shiboski SC, McCulloch CE. Regression Methods in Biostatistics: Linear, Logistic, Survival, and Repeated Measures Models. New York, NY: Springer; 2011. [Google Scholar]
- 20.Gelman A, Hill J. Data Analysis Using Regression and Multilevel/Hierarchical Models. Cambridge, England: Cambridge University Press; 2006. [Google Scholar]
- 21.Tun-Lin W, Burkot TR, Kay BH. Effects of temperature and larval diet on development rates and survival of the dengue vector Aedes aegypti in North Queensland, Australia. Med Vet Entomol. 2000;14:31–37. doi: 10.1046/j.1365-2915.2000.00207.x. [DOI] [PubMed] [Google Scholar]
- 22.Black WC, 4th, Bennett KE, Gorrochótegui-Escalante N, Barillas-Mury CV, Fernández-Salas I, de Lourdes Muñoz M, Farfán-Alé JA, Olson KE, Beaty BJ. Flavivirus susceptibility in Aedes aegypti. Arch Med Res. 2002;33:379–388. doi: 10.1016/s0188-4409(02)00373-9. [DOI] [PubMed] [Google Scholar]
- 23.Jupp PG, Kemp A. Laboratory vector competence experiments with yellow fever virus and five south African mosquito species including Aedes aegypti. Trans R Soc Trop Med Hyg. 2002;96:493–498. doi: 10.1016/s0035-9203(02)90417-7. [DOI] [PubMed] [Google Scholar]
- 24.Diallo M, Ba Y, Faye O, Soumare ML, Dia I, Sall AA. Vector competence of Aedes aegypti populations from Senegal for sylvatic and epidemic dengue 2 virus isolated in West Africa. Trans R Soc Trop Med Hyg. 2008;102:493–498. doi: 10.1016/j.trstmh.2008.02.010. [DOI] [PubMed] [Google Scholar]
- 25.Sylla M, Bosio C, Urdaneta-Marquez L, Ndiaye M, Black WC., 4th Gene flow, subspecies composition, and dengue virus-2 susceptibility among Aedes aegypti collections in Senegal. PLoS Negl Trop Dis. 2009;3:e408. doi: 10.1371/journal.pntd.0000408. [DOI] [PMC free article] [PubMed] [Google Scholar]
- 26.Inoue S, Morita K, Matias RR, Tuplano JV, Resuello RRG, Candelario JR, Cruz DJM, Mapua CA, Hasebe F, Igarashi A, Natividad FF. Distribution of three arbovirus antibodies among monkeys (Macaca fascicularis) in the Philippines. J Med Primatol. 2003;32:89–94. doi: 10.1034/j.1600-0684.2003.00015.x. [DOI] [PubMed] [Google Scholar]
- 27.Cook S, Diallo M, Sall AA, Cooper A, Holmes EC. Mitochondrial markers for molecular identification of Aedes mosquitoes (diptera: Culicidae) involved in transmission of arboviral disease in West Africa. J Med Entomol. 2005;42:19–28. doi: 10.1093/jmedent/42.1.19. [DOI] [PubMed] [Google Scholar]
- 28.Wu P-C, Lay J-G, Guo H-R, Lin C-Y, Lung S-C, Su H-J. Higher temperature and urbanization affect the spatial patterns of dengue fever transmission in subtropical Taiwan. Sci Total Environ. 2009;407:2224–2233. doi: 10.1016/j.scitotenv.2008.11.034. [DOI] [PubMed] [Google Scholar]
- 29.Kurane I, Brinton MA, Samson AL, Ennis FA. Dengue virus-specific, human cd4+ cd8- cytotoxic t-cell clones: multiple patterns of virus cross-reactivity recognized by ns3-specific t-cell clones. J Virol. 1991;65:1823–1828. doi: 10.1128/jvi.65.4.1823-1828.1991. [DOI] [PMC free article] [PubMed] [Google Scholar]
- 30.Monath TP. Yellow fever: an update. Lancet Infect Dis. 2001;1:11–20. doi: 10.1016/S1473-3099(01)00016-0. [DOI] [PubMed] [Google Scholar]
- 31.Lanciotti RS, Kosoy OL, Laven JJ, Velez JO, Lambert AJ, Johnson AJ, Stanfield SM, Duffy MR. Genetic and serologic properties of zika virus associated with an epidemic, Yap State, Micronesia, 2007. Emerg Infect Dis. 2008;14:1232–1239. doi: 10.3201/eid1408.080287. [DOI] [PMC free article] [PubMed] [Google Scholar]
- 32.Hayes EB. Zika virus outside Africa. Emerg Infect Dis. 2009;15:1347–1350. doi: 10.3201/eid1509.090442. [DOI] [PMC free article] [PubMed] [Google Scholar]
- 33.Hanley KA, Monath TP, Weaver SC, Rossi SL, Richman RL, Vasilakis N. Fever versus fever: the role of host and vector susceptibility and interspecific competition in shaping the current and future distributions of the sylvatic cycles of dengue virus and yellow fever virus. Infect Genet Evol. 2013;19:292–311. doi: 10.1016/j.meegid.2013.03.008. [DOI] [PMC free article] [PubMed] [Google Scholar]
- 34.Fragkoudis R, Attarzadeh-Yazdi G, Nash AA, Fazakerley JK, Kohl A. Advances in dissecting mosquito innate immune responses to arbovirus infection. J Gen Virol. 2009;90:2061–2072. doi: 10.1099/vir.0.013201-0. [DOI] [PubMed] [Google Scholar]
- 35.Cornet M, Chateau R, Valade M, Dieng P, Raymond H, Lorand A. Données bio-écologiques sur les vecteurs potentiels du. Virus amaril au Sénégal oriental. Rôle des différentes espéces dans la transmission du virus. Cah Orstom (Entomol méd Parasitol) 1978;16:315–341. [Google Scholar]
- 36.Vasilakis N, Tesh RB, Weaver SC. Sylvatic dengue virus type 2 activity in humans, Nigeria, 1966. Emerg Infect Dis. 2008;14:502–504. doi: 10.3201/eid1403.070843. [DOI] [PMC free article] [PubMed] [Google Scholar]
- 37.Zeller HG, Traoré-Lamizana M, Monlun E, Hervy JP, Mondo M, Digoutte JP. Dengue-2 virus isolation from humans during an epizootic in southeastern Senegal in November, 1990. Res Virol. 1992;143:101–102. doi: 10.1016/s0923-2516(06)80088-9. [DOI] [PubMed] [Google Scholar]
- 38.Cardosa J, Ooi MH, Tio PH, Perera D, Holmes EC, Bibi K, Abdul Manap Z. Dengue virus serotype 2 from a sylvatic lineage isolated from a patient with dengue hemorrhagic fever. PLoS Negl Trop Dis. 2009;4:e423. doi: 10.1371/journal.pntd.0000423. [DOI] [PMC free article] [PubMed] [Google Scholar]
Associated Data
This section collects any data citations, data availability statements, or supplementary materials included in this article.


