

Abstract
Rationale: Insulin resistance and low high-density lipoprotein (HDL) are associated with pulmonary morbidity, including asthma, but the underlying mechanisms are not well elucidated.
Objectives: To investigate whether systemic inflammation underlies the association of metabolic abnormalities with pulmonary function among urban adolescents.
Methods: Th-cell responses and monocyte subsets, and their association with serum homeostatic model assessment of insulin resistance (HOMA-IR) and HDL, and pulmonary function were quantified in 168 adolescents, including 42 obese subjects with asthma, 42 normal-weight subjects with asthma, 40 obese subjects without asthma, and 44 healthy control subjects. Th-cell responses (Th1 [CD4+IFNγ+] and Th2 [CD4+IL4+] cells) to stimulation with phytohemagglutinin, leptin, and dust mite, and classical (CD14+CD16−), resident (CD14+CD16+), and patrolling (CD14dimCD16+) monocytes, and their C-C chemokine receptor type-2 (CCR2) expression were quantified by flow cytometry.
Measurements and Main Results: Th1/Th2 ratio to all three stimuli was higher in obese subjects with asthma than normal-weight subjects with asthma and directly correlated with HOMA-IR. Classical monocytes inversely associated with Th1/Th2 ratio to phytohemagglutinin (r = −0.43; P = 0.01) and directly with Asthma Control Test score (β = 1.09; P = 0.04), while patrolling monocytes correlated with Composite Asthma Severity Index score (β = 1.11; P = 0.04) only among obese subjects with asthma. HDL was inversely associated with patrolling monocytes and directly associated with CCR2 expression on resident monocytes. CCR2 expression on patrolling monocytes predicted residual volume (RV), RV/TLC ratio, and FRC, after adjusting for HDL, but not after adjusting for body mass index. Association of Th1/Th2 ratio with RV, FRC, and inspiratory capacity was attenuated after adjusting for HOMA-IR.
Conclusions: Th1 polarization and monocyte activation among obese subjects with asthma correlates with metabolic abnormalities. Association of monocyte activation with pulmonary function is mediated by body mass index, whereas that of Th1 polarization is mediated by insulin resistance.
Keywords: obesity, asthma, metabolic dysregulation, inflammation, pulmonary function
At a Glance Commentary
Scientific Knowledge on the Subject
Obesity is an independent risk factor for pediatric asthma. Obesity-mediated insulin resistance and dyslipidemia are associated with asthma prevalence and are predictors of pulmonary function deficits, but the underlying mechanisms are not known.
What This Study Adds to the Field
We found that insulin resistance and dyslipidemia are associated with nonatopic systemic inflammation among adolescents, which correlates with pulmonary function deficits associated with pediatric obesity-related asthma.
Childhood obesity is a major public health concern in the United States (1). It is an independent risk factor for several chronic diseases, including asthma (2), particularly among Hispanics and African Americans (3). Obese children have a higher incidence and severity of asthma (4) that is suboptimally responsive to inhaled steroids as compared with normal-weight children (5). However, the mechanisms underlying pulmonary morbidity among obese children are poorly understood. Recent studies have found an association between obesity-mediated metabolic abnormalities, including insulin resistance and low high-density lipoprotein (HDL), and asthma (6). Insulin resistance and low HDL are also independent predictors of pulmonary function, particularly FEV1/FVC ratio and expiratory reserve volume (7), indices known to be reduced among obese subjects with asthma. Whether obesity-mediated systemic inflammation underlies the association of metabolic abnormalities and pulmonary function deficits among obese children with asthma is not known.
Obesity is recognized as a low-grade inflammatory state. Obesity-mediated inflammation is orchestrated by metabolic abnormalities, particularly insulin resistance and dyslipidemia (8). Adipocytes secrete cytokines, including monocyte chemotactic protein (MCP-1), which lead to activation of circulating or classical monocytes (CD14+CD16− monocytes) to form resident (CD14+CD16+) and patrolling (CD14dimCD16+) monocytes that get recruited into adipose tissue. Binding of MCP-1 to monocyte cell surface receptor C-C chemokine receptor type-2 (CCR2) plays a key role in monocyte activation and recruitment into adipose tissue to form adipose tissue macrophages (9). These adipose tissue macrophages play a pivotal role in local and systemic inflammatory responses (8), including activation of Th cells, primarily of Th1 phenotype (8). Although systemic inflammation with elevated C-reactive protein (CRP) is reported among adults (10) but not among children with obesity-related asthma (11), activation patterns of monocytes and Th cells, while reported among those with obesity (12) and with asthma (13), have not been elucidated in the context of pediatric obesity-related asthma. The association of monocyte activation with nonatopic Th1 polarization among obese children with asthma (14) is also not known. Whether systemic activation patterns of these cell types underlie the epidemiologic associations of metabolic abnormalities with asthma (6) remains an open question. Thus, several gaps exist in the understanding of the association of systemic inflammation and its underlying factors with the pulmonary function deficits observed in pediatric obesity-related asthma.
Because prevalence of obesity-related asthma is higher in Hispanics and African Americans (3), we aimed to characterize systemic Th-cell responses and monocyte activation, and describe their relationship with insulin resistance and serum HDL, and with pulmonary function among Hispanic and African American obese adolescents with asthma. We compared these associations with those in adolescents with obesity alone, with asthma alone, and in healthy control subjects. We hypothesized that obese adolescents with asthma have evidence of monocyte activation that correlates with nonatopic Th-cell polarization, insulin resistance, and low serum HDL. We also hypothesized that both nonatopic Th1 polarization and monocyte activation are associated with pulmonary function deficits. Some of the results of these studies have been previously reported in the form of an abstract (15).
Methods
Study Population
One hundred and sixty-eight Hispanic and African American adolescents, ages 13–18 years, were recruited from clinics at Children’s Hospital at Montefiore, as previously described (7). The study cohort was comprised of 42 obese subjects with asthma, 42 normal-weight subjects with asthma, 40 obese subjects without asthma, and 44 healthy control subjects. Obesity was defined as body mass index (BMI) greater than 95th percentile. Asthma classification was based on physician diagnosis, and confirmed by electronic medical records. Asthma severity was classified using the Composite Asthma Severity Index (16), based on self-reported frequency of symptoms and medication use. Asthma control was classified based on responses to the Asthma Control Test questionnaire (17). The Institutional Review Board approved the study. Additional details on recruitment criteria and the study cohort are included in the online supplement.
Study Measures
Research study visit.
On the day of the study visit at the Clinical Research Center, all participants underwent anthropometric measurements, a fasting phlebotomy, and pulmonary function testing, as previously described (7) and detailed in the online supplement. Peripheral blood mononuclear cells were separated from whole blood using the Ficoll Hypaque method (14). Blood was also analyzed for total and differential white cell counts on a subset of samples (n = 114) at the hematology laboratory in the hospital.
Quantification of Systemic Inflammation
Quantification of monocyte activation.
Monocyte activation was quantified by flow-cytometric analysis of freshly isolated peripheral blood mononuclear cells. Briefly, 5 × 10⁵ peripheral blood mononuclear cells were stained with CD14–fluorescein isothiocyanate, CD16-PerCP, and CCR2-APC or APC isotype control (BD Biosciences, San Jose, CA) (13) for 30 minutes at 4°C. Following two washes, the cells were fixed with fixation buffer (BD Biosciences). After gating on monocytes (see Figure E1A in the online supplement), 5,000 events were collected on BD LSRII (Becton Dickinson, Franklin Lakes, NJ) and analyzed on FlowJo (v9.3.3; Tree Star Inc., Ashland, OR). We quantified the proportion of classical (CD14+CD16−), resident (CD14+CD16+), or patrolling (CD14dimCD16+) monocytes (see Figure E1B) (9). Because CCR2 is a high-affinity receptor for MCP-1, and regulates tissue monocyte recruitment (18), we quantified its cell surface expression on the monocyte subsets (see Figures E1C and E1D).
Quantification of Th-cell responses.
We quantified Th-cell responses to stimulation with phytohemagglutinin (PHA; 5 μg/ml for 3 d); a polyclonal T-cell mitogen, leptin (300 μg/ml for 7 d), associated with Th1 polarization among preadolescent obese children with asthma (14); and dust mite, Dermatophagoides farinae (12.5 μg/ml for 7 d), an allergen associated with Th2 responses, to which sensitization is common among urban children with asthma (19). Cell processing and staining was conducted as previously described (14). Cell collection and analysis was performed on the platforms described previously. The proportion of CD4+ T cells that stained for IFN-γ, tumor necrosis factor (TNF), IL-4, and IL-5 by intracellular cytoplasmic staining was quantified. Very few cells stained for IL-5 so it was excluded from the analysis.
Quantification of serum cytokines, adipokines, and metabolic measures.
Cytokines, adipokines (leptin and adiponectin), and metabolic measures were quantified in fasting serum, as detailed in the online supplement.
Statistical Analysis
The primary outcomes of interest were between-group differences in monocyte activation, and Th-cell responses, and their association with metabolic measures, and pulmonary function. Main effects of obesity and asthma and their interaction were examined for pulmonary function, metabolic measures, and serum cytokine measures. Multivariate linear regression analysis was performed to estimate the association of monocyte activation and Th-cell responses with pulmonary function, adjusting for HDL and homeostatic model assessment of insulin resistance (HOMA-IR), respectively, including age, sex, ethnicity, and BMI z score as covariates. All tests were two-tailed, and conducted with significance set a priori at 0.05. Analyses were performed on STATA statistical software, version 12 (StataCorp, College Station, TX) (20). Additional details are included in the online supplement.
Results
Characteristics of the Study Participants
Demographic and anthropometric characteristics in the four study groups are summarized in Table 1. As expected, obese participants had higher weight, BMI, BMI z score, and waist circumference than normal-weight participants.
Table 1.
Demographic and Anthropometric Characteristics
| Variable | Obese with Asthma (n = 42) | Normal Weight with Asthma (n = 42) | Obese without Asthma (n = 40) | Healthy Control Subjects (n = 44) |
|---|---|---|---|---|
| Age, yr | 15.5 ± 1.8 | 15.9 ± 1.7 | 16.2 ± 1.1 | 16.3 ± 1.7 |
| Males, n (%) | 23 (54.7) | 21 (50) | 15 (37.5) | 16 (36.4) |
| Hispanics, n (%) | 24 (57.1) | 24 (57.1) | 24 (57.1) | 25 (56.8) |
| Tanner stage, n (%) | ||||
| 3 | 4 (9.5) | 7 (16.7) | 1 (2.5) | 1 (2.3) |
| 4 | 16 (38.1) | 15 (35.7) | 15 (37.5) | 16 (36.4) |
| 5 | 17 (11.9) | 19 (45.2) | 21 (52.5) | 21 (47.7) |
| Height, cm | 167.2 ± 9.8 | 166.3 ± 8.5 | 166.1 ± 12.6 | 167.6 ± 10.5 |
| Weight, kg | 93.2 ± 24.3 | 61.7 ± 10.8 | 89.4 ± 20.8 | 60.1 ± 9.4 |
| Body mass index, kg/m2 | 33.2 ± 7.7 | 22.2 ± 2.6 | 32.6 ± 8.7 | 21.3 ± 2.2 |
| Body mass index z score | 2.1 ± 0.5 | 0.4 ± 0.7 | 1.9 ± 0.5 | 0.1 ± 0.7 |
| Waist circumference, cm | 102.1 ± 15.5 | 74.2 ± 5.4 | 97.1 ± 15.2 | 72.6 ± 5.6 |
| Allergic rhinitis, n (%) | 19 (45.2) | 21 (50) | 8 (20) | 4 (10) |
| Eczema, n (%) | 13 (30.9) | 16 (38.1) | 6 (15) | 2 (4.5) |
| Passive smoke exposure | 11 (26.2) | 8 (19) | 10 (25) | 5 (11.4) |
All continuous variables are reported as mean ± SD.
Categorical variables (sex, ethnicity, Tanner stage, allergic rhinitis, and eczema) are reported as group-specific numerical frequency and percentages.
Comparisons of metabolic and pulmonary function measures among the four study groups are summarized in Table 2. Participants with asthma had lower FEV1 (P = 0.003), lower FEV1/FVC ratio (P < 0.001), lower forced expiratory flow midexpiratory phase (P < 0.001), and lower HDL (P = 0.048) than participants without asthma. Obese participants had lower residual volume (RV) (P < 0.001), RV/TLC ratio (P < 0.001), expiratory reserve volume (P = 0.002), and FRC (P < 0.001), and higher inspiratory capacity (P < 0.001). Obese participants also had lower HDL levels; higher levels of insulin, HOMA, and leptin; and lower levels of adiponectin (all P < 0.001). There were no significant interactions observed between obesity and asthma for any of the metabolic or pulmonary function measures.
Table 2.
Pulmonary Function and Metabolic Measures
| Variable | Obese with Asthma (n = 42) | Normal Weight with Asthma (n = 42) | Obese without Asthma (n = 40) | Healthy Control Subjects (n = 44) | P Values |
|---|---|---|---|---|---|
| Pulmonary function indices* | |||||
| FVC | 94 ± 18.4 | 94.2 ± 12 | 98.6 ± 12.2 | 92.7 ± 12 | A 0.46 |
| O 0.20 | |||||
| A-O 0.15 | |||||
| FEV1 | 87.2 ± 11.2 | 85 ± 13.6# | 93.5 ± 12.3# | 89.9 ± 11.7 | A 0.003 |
| O 0.13 | |||||
| A-O 0.70 | |||||
| FEV1/FVC | 79.9 ± 7.4^ | 79.3 ± 8.4$ | 83.6 ± 7.3 | 85.7 ± 6.8^$ | A <0.001 |
| O 0.51 | |||||
| A-O 0.23 | |||||
| FEF25–75% | 73.1 ± 21.5**^ | 69 ± 23.5#$ | 86.8 ± 20.2**# | 83.1 ± 19.6^$ | A <0.001 |
| O 0.23 | |||||
| A-O 0.91 | |||||
| TLC | 95 ± 12.5 | 99.7 ± 14.1 | 97.7 ± 13.5 | 98.9 ± 13.7 | A 0.80 |
| O 0.14 | |||||
| A-O 0.49 | |||||
| RV | 92.6 ± 31¶^ | 122.6 ± 42.7¶# | 85.7 ± 34.3#$ | 121.6 ± 40$^ | A 0.33 |
| O <0.001 | |||||
| A-O 0.40 | |||||
| RV/TLC ratio | 21.6 ± 5¶^ | 27.2 ± 6.7¶# | 19.8 ± 5.9#$ | 27.3 ± 6.4$^ | A 0.24 |
| O <0.001 | |||||
| A-O 0.16 | |||||
| Expiratory reserve volume | 72.8 ± 21.3 | 85.2 ± 24.8 | 77.6 ± 19.1 | 85.5 ± 24.2 | A 0.64 |
| O 0.002 | |||||
| A-O 0.54 | |||||
| FRC | 79.2 ± 19.1¶^ | 98.9 ± 22.5¶# | 79.5 ± 18.2#$ | 97.1 ± 18.7^$ | A 0.55 |
| O <0.0001 | |||||
| A-O 0.95 | |||||
| Inspiratory capacity | 97.5 ± 19.2¶^ | 85.6 ± 13.5¶# | 98.1 ± 15.9#$ | 85 ± 15.1^$ | A 0.83 |
| O <0.0001 | |||||
| A-O 0.56 | |||||
| Metabolic measures† | |||||
| HDL | 43.3 ± 9.8^ | 51.3 ± 11.8 | 46.5 ± 9.3 | 55.1 ± 11.1^ | A 0.048 |
| O < 0.0001 | |||||
| A-O 0.63 | |||||
| Low-density lipoprotein | 87.3 ± 18.7 | 79.5 ± 22.3 | 83.4 ± 27.1 | 76.8 ± 24.3 | A 0.33 |
| O 0.06 | |||||
| A-O 0.90 | |||||
| Triglycerides | 81 ± 40.3 | 76.9 ± 47 | 84.3 ± 39.8 | 65.7 ± 37 | A 0.51 |
| O 0.10 | |||||
| A-O 0.21 | |||||
| Insulin | 35.3 ± 19.2¶^ | 18.8 ± 8¶# | 30.7 ± 22.4#$ | 16.4 ± 7.7^$ | A 0.30 |
| O <0.0001 | |||||
| A-O 0.87 | |||||
| HOMA | 8 ± 4.5¶^ | 4.1 ± 2¶# | 7 ± 5.4#$ | 3.6 ± 1.7^$ | A 0.30 |
| O <0.0001 | |||||
| A-O 0.87 | |||||
| Leptin | 32.4 ± 20.1¶^ | 10.2 ± 9.5¶# | 31.6 ± 21.7#$ | 10.9 ± 9.3$^ | A 0.86 |
| O <0.0001 | |||||
| A-O 0.95 | |||||
| Adiponectin | 9.7 ± 4.6^ | 14.2 ± 8.9 | 10.7 ± 6.7$ | 16.1 ± 7.9$^ | A 0.28 |
| O <0.0001 | |||||
| A-O 0.65 |
Definition of abbreviations: FEF25–75% = forced expiratory flow midexpiratory phase; HDL = high-density lipoprotein; HOMA = homeostatic model assessment; RV = residual volume.
Pulmonary function indices are reported as percent predicted values other than FEV1/FVC ratio, which is reported as a percentage.
Metabolic measures are reported in mg/dl other than insulin reported in μU/ml, leptin in ng/ml, and adiponectin in μg/ml.
Similar symbols for each variable denote significant between-group differences determined by analysis of variance followed by Bonferroni post hoc analyses.
P values are reported for the main effects and interaction between obesity and asthma: A = asthma versus nonasthma; A-O = asthma-by-obesity interaction; O = obese versus normal weight.
The clinical characteristics of obese and normal-weight subjects with asthma are summarized in Table 3. Only 25% of obese and normal-weight subjects with asthma were using inhaled corticosteroids. Metabolic measures and spirometric indices did not differ by inhaled steroid use. Although normal-weight subjects with asthma using inhaled steroids had higher percent-predicted FRC (112.15 ± 24.18 vs. 92.75 ± 19.05; P < 0.01) and TLC (108.15 ± 11.43 vs. 95.97 ± 13.66; P < 0.01) than those not using steroids, there was no association between lung volumes and inhaled corticosteroids among obese subjects with asthma.
Table 3.
Clinical Characteristics of Obese and Normal-Weight Adolescents with Asthma
| Variable* | Obese with Asthma | Normal Weight with Asthma | P Value |
|---|---|---|---|
| Age at onset of asthma, yr | 2.89 ± 3.35 | 1.86 ± 1.78 | 0.08 |
| Symptoms, % | |||
| Daytime symptoms more than twice a week | 16.7 | 19 | 0.81 |
| Night-time symptoms more than twice a month* | 26.2 | 28.6 | 0.31 |
| Interference with normal activity | 42.9 | 64.3 | 0.049 |
| Albuterol use more than twice per week | 33.3 | 31 | 0.82 |
| Controller medications, % | |||
| Inhaled steroids | 25 | 25 | 0.58 |
| Leukotriene antagonists | 25 | 23.4 | 0.13 |
| Long-acting β-agonists + inhaled corticosteroid combination | 11.9 | 11.9 | 0.56 |
| Disease severity, control, and unscheduled healthcare visits | |||
| Annual emergency department visits | 1.67 ± 2.73 | 1.98 ± 4.92 | 0.72 |
| Annual hospitalizations | 0.79 ± 1.80 | 0.55 ± 0.94 | 0.45 |
| Composite Asthma Severity Index score† | 3.10 ± 2.04 | 3.46 ± 2.12 | 0.42 |
| Asthma Control Test score | 19.92 ± 3.94 | 19.49 ± 4.65 | 0.65 |
Age of asthma onset and disease severity variables are reported as mean ± SD, whereas symptom frequency, classified per the NHLBI guidelines (50), and medication use are reported as percentages.
Composite asthma severity index score was used as an objective measure of disease severity accounting for ongoing use of controller medications (16).
Systemic Inflammation among Obese Subjects with Asthma Is Nonatopic and Correlates with Asthma Severity
Compared with normal-weight subjects with asthma, obese subjects with asthma had higher percentage of CD4+IFNγ+ cells in response to PHA (Figure 1A) and a lower percentage of CD4+IL4+ cells in response PHA, leptin, and D. farinae stimulation (Figures 1D–1F). Thus, the Th1/Th2 ratio in response to PHA, leptin, and D. farinae (Figures 1G–1I) was higher among obese subjects with asthma than normal-weight subjects with asthma. The proportion of CD4+TNF+ cells in response to the three stimuli did not differ between obese and normal-weight subjects with asthma (data not shown).
Figure 1.
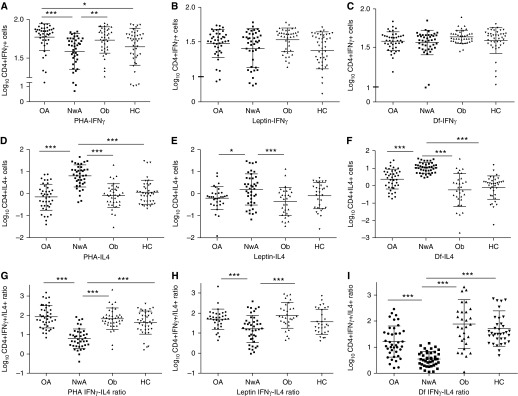
Between study group comparison of Th-cell responses. Proportion of CD4+IFNγ+ T cells (A–C), CD4+IL-4+ T cells (D–F), and their ratio (G–I) were quantified to determine Th-cell responses to phytohemagglutinin (PHA), leptin, and Dermatophagoides farinae (Df), respectively. The proportions of Th cells were log10 transformed before comparison among study groups. The middle bar represents the mean values and the side bars represent the 25th and 75th percentile. HC = healthy control subjects; NwA = normal-weight subjects with asthma; OA = obese subjects with asthma; Ob = obese subjects without asthma. The asterisks denote statistically significant between-group differences (*P < 0.05, **P < 0.01, ***P < 0.001).
Although the proportion of classical (Figure 2A) and patrolling monocytes (Figure 2B) did not differ between obese and normal-weight subjects with asthma, there were fewer classical (58.3 ± 16.3 vs. 71.7 ± 8.9; P < 0.001)) and more patrolling monocytes (22.8 ± 8.4 vs.13.2 ± 4.2; P < 0.005) among obese subjects with asthma on inhaled steroids than those not on steroids; a similar difference was not observed among normal-weight subjects with asthma (68.6 ± 14.3 vs. 69.4 ± 14.3 and 16.2 ± 8.6 vs.14.2 ± 5.9; P > 0.8 for both comparisons). Furthermore, classical monocytes correlated with Asthma Control Test score (β = 1.09; 95% confidence interval, 0.08–2.10; P = 0.04) and patrolling monocytes correlated with Composite Asthma Severity Index score (β = 1.11; 95% confidence interval, 0.05–2.16; P = 0.04) only among obese subjects with asthma. CCR2 expression (see Figures E2A–E2D) and total and differential white cell counts (see Table E1) did not differ between obese and normal-weight subjects with asthma.
Figure 2.
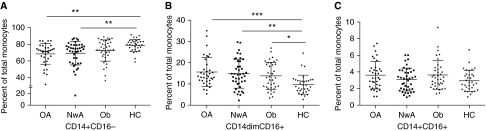
Between study group comparison of monocyte activation. Monocyte activation was defined by comparing the proportion of (A) classical, (B) patrolling, and (C) resident monocytes in each study group. The middle bar represents the mean values and the side bars represent the 25th and 75th percentile. HC = healthy control subjects; NwA = normal-weight subjects with asthma; OA = obese subjects with asthma; Ob = obese subjects without asthma. The asterisks denote statistically significant between-group differences (*P < 0.05, **P < 0.01, ***P < 0.001).
In keeping with these observations, serum MCP-1, TNF, and IFN-γ–inducible protein-10 levels were higher among obese subjects with asthma than normal-weight subjects with asthma, with significant interactions observed between asthma and obesity for all three cytokines (Table 4).
Table 4.
Comparison of Serum Cytokines among the Four Study Groups
| Cytokine* (pg/ml) | Obese with Asthma (n = 39) | Normal Weight with Asthma (n = 39) | Obese without Asthma (n = 39) | Healthy Control Subjects (n = 36) | P Values |
|---|---|---|---|---|---|
| IFN-γ | 0.47 ± 0.89 | 0.27 ± 0.81 | 0.77 ± 0.98 | 0.64 ± 1.01 | A 0.007 |
| O 0.27 | |||||
| A-O 0.87 | |||||
| TNF | 0.60 ± 0.46** | 0.29 ± 0.44**#^ | 0.56 ± 0.22# | 0.65 ± 0.43^ | A 0.008 |
| O 0.08 | |||||
| A-O 0.009 | |||||
| IL-2 | 0.06 ± 0.52 | −0.16 ± 0.30# | 0.16 ± 0.55# | 0.15 ± 0.66 | A 0.01 |
| O 0.19 | |||||
| A-O 0.33 | |||||
| IL-6 | 0.05 ± 0.6 | −0.19 ± 0.39 | 0.09 ± 0.66 | 0.03 ± 0.59 | A 0.01 |
| O 0.19 | |||||
| A-O 0.89 | |||||
| IL-8 | 0.59 ± 0.55** | 0.18 ± 0.74**#^ | 0.82 ± 0.64# | 0.78 ± 0.60^ | A <0.0001 |
| O 0.03 | |||||
| A-O 0.21 | |||||
| IL-12 | 0.04 ± 0.78 | −0.12 ± 0.62 | 0.28 ± 0.86 | 0.30 ± 0.96 | A <0.01 |
| O 0.66 | |||||
| A-O 0.94 | |||||
| IL-17 | 0.07 ± 0.78 | −0.13 ± 0.70 | 0.26 ± 0.83 | 0.27 ± 0.93 | A <0.01 |
| O 0.54 | |||||
| A-O 0.85 | |||||
| MCP-1 | 2.33 ± 0.3** | 1.82 ± 1.10**#^ | 2.31 ± 0.36# | 2.23 ± 0.28^ | A 0.05 |
| O 0.001 | |||||
| A-O 0.02 | |||||
| IP-10 | 2.33 ± 0.22** | 1.95 ± 0.78**#^ | 2.29 ± 0.23# | 2.25 ± 0.27^ | A 0.09 |
| O 0.001 | |||||
| A-O 0.007 | |||||
| IL-4 | 1.42 ± 0.8 | 1.76 ± 0.50 | 1.73 ± 0.70 | 1.10 ± 0.50 | A 0.04 |
| O 0.49 | |||||
| A-O 0.99 | |||||
| IL-10 | 0.13 ± 0.61 | 0.04 ± 0.49 | 0.21 ± 0.57 | 0.21 ± 0.71 | A 0.23 |
| O 0.46 | |||||
| A-O 0.41 | |||||
| IL-13 | 0.10 ± 0.62 | 0.60 ± 0.35# | 0.40 ± 0.80# | 0.34 ± 0.88 | A 0.001 |
| O 0.34 | |||||
| A-O 0.80 |
Definition of abbreviations: IP = IFN-γ–inducible protein; MCP = monocyte chemotactic protein.
All results are reported as mean ± SD.
All cytokines have been log10 transformed.
Similar symbols for each cytokine denote significant between-group differences determined by Bonferroni post hoc analyses.
P values are reported for the main effects and interaction between obesity and asthma: A = asthma versus nonasthma; A-O = asthma by obesity interaction; O = obese versus normal weight.
Monocyte Activation Is Associated with Th-Cell Responses among Obese Subjects with Asthma
There were no significant differences in metabolic measures, monocyte activation, Th-cell responses, and serum cytokines between obese subjects with asthma and obese subjects without asthma (Figures 1 and 2, Tables 2 and 4). We, therefore, compared the association of these inflammatory responses between obese subjects with asthma and subjects without asthma. We found that Th1/Th2 ratio in response to PHA was inversely correlated with classical monocytes (r = −0.43; P = 0.01) (Figure 3A) and there was a nonsignificant positive correlation with patrolling monocytes (r = 0.22; P = 0.1) (Figure 3B) in obese subjects with asthma but not in obese subjects without asthma.
Figure 3.
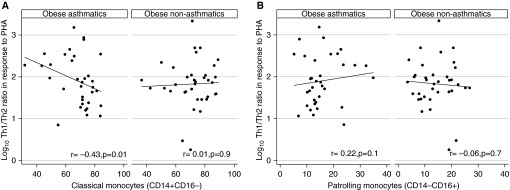
Association of monocyte activation with systemic Th-cell responses among obese subjects with asthma compared with obese subjects without asthma. Association of Th-cell response to phytohemagglutinin (PHA) with (A) classical monocytes and (B) patrolling monocytes was compared between obese subjects with asthma and obese subjects without asthma.
Metabolic Measures Are Associated with Monocyte Activation and Th-Cell Responses
We further investigated the association of monocyte activation profiles and Th-cell responses with serum HDL and HOMA-IR, metabolic measures that are associated with obesity-mediated inflammation. HOMA-IR was directly associated with Th1/Th2 ratio in response to PHA, leptin, and D. farinae stimulation, whereas HDL was inversely associated only with the ratio in response to PHA (Table 5). Serum HDL was also inversely associated with percent patrolling monocytes but was directly associated with CCR2 expression on patrolling and resident monocytes (Table 5). There was no association of monocyte activation with HOMA-IR.
Table 5.
Univariate Linear Regression Examining the Association of Monocytes and Th-Cell Responses with HOMA and HDL
| HOMA |
HDL |
|||
|---|---|---|---|---|
| β* (95% CI) | P Value | β* (95% CI) | P Value | |
| Th-cell responses† | ||||
| Th-cell responses to PHA | 0.04 (0.01 to 0.06) | 0.009 | −0.01 (−0.02 to −0.002) | 0.02 |
| Th-cell responses to leptin | 0.03 (−0.01 to 0.05) | 0.05 | −0.01 (−0.01 to 0.004) | 0.25 |
| Th-cell responses to Dermatophagoides farinae | 0.05 (0.02 to 0.08) | 0.002 | −0.01 (−0.02 to 0.003) | 0.15 |
| Monocytes | ||||
| CD14+CD16− (classical) | −0.21 (−0.69 to 0.27) | 0.39 | 0.10 (−0.07 to 0.28) | 0.25 |
| CD14−CD16+ (patrolling) | 0.07 (−0.18 to 0.32) | 0.58 | −0.14 (−0.23 to −0.05) | 0.002 |
| CD14+CCR2+ classical monocytes | 0.10 (−0.29 to 0.49) | 0.61 | 0.01 (−0.13 to 0.15) | 0.86 |
| CD14+CCR2+ resident monocytes | −0.65 (−1.37 to 0.06) | 0.07 | 0.32 (0.06 to 0.58) | 0.02 |
| CD16+CCR2+ resident monocytes | −0.52 (−1.22 to 0.17) | 0.14 | 0.29 (0.03 to 0.54) | 0.03 |
| CD16+CCR2+ patrolling monocytes | −0.02 (−0.11 to 0.06) | 0.62 | 0.03 (−0.002 to 0.06) | 0.06 |
Definition of abbreviations: CCR2 = C-C chemokine receptor type-2; CI = confidence interval; HDL = high-density lipoprotein; HOMA = homeostatic model assessment; PHA = phytohemagglutinin.
β represents a unit change in inflammatory measure for unit change in HOMA or HDL.
Log10 transformed Th1/Th2 ratios and percentage of monocyte subsets or CCR2 expression on monocytes were included as dependent variables in the regression analyses.
Association of Monocyte Activation, Th-Cell Responses, Metabolic Measures, and Pulmonary Function
Because HOMA-IR and HDL predict pulmonary function indices (7), and were associated with Th-cell responses and monocyte activation, respectively, we investigated the relationship between these inflammatory measures and pulmonary function, adjusting for HOMA-IR and HDL, in a multivariate linear regression model. Although the association of pulmonary function with Th1/Th2 ratio in response to PHA did not reach statistical significance, RV, RV/TLC ratio, and FRC were inversely associated and inspiratory capacity was positively associated with Th1/Th2 ratio to D. farinae (Table 6). After adjusting for HOMA-IR, the association of all except RV/TLC ratio was rendered nonsignificant (Table 6), and was not influenced by BMI z score. The association of CCR2 expression on classical monocytes with RV and FRC (Table 7), and that on resident monocytes with RV and RV/TLC ratio (Table 8), remained significant after adjusting for HDL and were also not influenced by inclusion of BMI z score in the model. However, although the association of CCR2 expression on patrolling monocytes with FEV1/FVC ratio, RV, RV/TLC ratio, and FRC remained significant after adjusting for HDL, it was rendered nonsignificant for all except FEV1/FVC ratio after inclusion of BMI z score in the model (Table 9).
Table 6.
Multivariate Linear Regression Examining the Association of Pulmonary Function with Th-Cell Responses
| Pulmonary Function Indices* | Unadjusted Analysis β† (95% CI) (P Value) | Adjusted Analysis‡ β† (95% CI) (P Value) |
|---|---|---|
| FEV1/FVC ratio | 1.18 (−0.41 to 2.78) (0.14) | — |
| RV | −8.56 (−16.56 to −0.56) (0.04) | −7.03 (−14.83 to 0.77) (0.08) |
| RV/TLC ratio | −1.76 (−3.07 to −0.45) (0.01) | −1.31 (−2.55 to −0.08) (0.04) |
| Expiratory reserve volume | −3.42 (−7.95 to 1.10) (0.14) | — |
| FRC | −5.30 (−9.54 to −1.06) (0.02) | −3.39 (−7.45 to 0.68) (0.10) |
| Inspiratory capacity | 4.20 (0.67 to 7.73) (0.02) | 1.82 (−1.41 to 5.07) (0.27) |
Definition of abbreviations: CI = confidence interval; RV = residual volume.
Percent predicted values of pulmonary function indices were included in the analysis other than percent FEV1/FVC ratio.
β represents a unit change in pulmonary function index with unit change in log10 Th1/Th2 ratio in response to Dermatophagoides farinae.
Adjusted for homeostatic model assessment of insulin resistance, with age, sex, ethnicity, and body mass index z score included as pertinent covariates. Multivariate linear regression analysis was performed only when a significant association was observed between Th-cell response and pulmonary function index in univariate analysis.
Table 7.
Multivariate Linear Regression Examining the Association of Pulmonary Function with CCR2 Expression on Classical Monocytes
| Pulmonary Function Indices* | Unadjusted Analysis β† (95% CI) (P Value) | Adjusted Analysis‡ β† (95% CI) (P Value) |
|---|---|---|
| FEV1/FVC ratio | −0.02 (−0.15 to 0.11) (0.76) | — |
| RV | 0.84 (0.20 to 1.47) (0.01) | 0.66 (0.09 to 1.24) (0.03) |
| RV/TLC ratio | 0.10 (−0.01 to 0.21) (0.06) | — |
| Expiratory reserve volume | 0.25 (−0.12 to 0.62) (0.18) | — |
| FRC | 0.46 (0.11 to 0.80) (0.009) | 0.37 (0.07 to 0.68) (0.02) |
| Inspiratory capacity | 0.08 (−0.20 to 0.36) (0.57) | — |
Definition of abbreviations: CCR2 = C-C chemokine receptor type-2; CI = confidence interval; RV = residual volume.
The percent predicted values of pulmonary function indices were included in the analysis other than percent FEV1/FVC ratio.
β represents a unit change in pulmonary function index with unit change in CCR2 expression on monocyte subsets.
Adjusted for serum high-density lipoprotein, with age, sex, ethnicity, and body mass index z score included as pertinent covariates. Multivariate linear regression analysis was performed only when a significant association was observed between CCR2 expression on monocyte subsets and pulmonary function index in univariate analysis.
Table 8.
Multivariate Linear Regression Examining the Association of Pulmonary Function with CCR2 Expression on Resident Monocytes
| Pulmonary Function Indices* | CCR2+CD14+ Resident
Monocytes |
CCR2+CD16+ Resident
Monocytes |
||
|---|---|---|---|---|
| Unadjusted Analysis β† (95% CI) (P Value) | Adjusted Analysis‡ β† (95% CI) (P Value) | Unadjusted Analysis β† (95% CI) (P Value) | Adjusted Analysis‡ β† (95% CI) (P Value) | |
| FEV1/FVC ratio | 0.01 (−0.06 to 0.08) (0.81) | — | −0.01 (−0.06 to 0.08) (0.85) | — |
| RV | 0.46 (0.11 to 0.80) (0.009) | 0.35 (0.03 to 0.67) (0.03) | 0.41 (0.05 to 0.76) (0.02) | 0.23 (−0.1 to 0.56) (0.17) |
| RV/TLC ratio | 0.10 (0.04 to 0.15) (0.001) | 0.07 (0.02 to 0.12) (0.006) | 0.08 (0.03 to 0.14) (0.005) | 0.05 (−0.003 to 0.10) (0.07) |
| Expiratory reserve volume | 0.04 (−0.16 to 0.24) (0.70) | — | 0.03 (−0.17 to 0.23) (0.76) | — |
| FRC | 0.17 (−0.02 to 0.35) (0.08) | — | 0.16 (−0.04 to 0.35) (0.1) | — |
| Inspiratory capacity | −0.14 (−0.29 to 0.01) (0.06) | — | −0.14 (-0.29 to 0.01) (0.06) | — |
Definition of abbreviations: CCR2 = C-C chemokine receptor type-2; CI = confidence interval; RV = residual volume.
The percent predicted values of pulmonary function indices were included in the analysis other than percent FEV1/FVC ratio.
β represents a unit change in pulmonary function index with unit change in CCR2 expression on monocyte subsets.
Adjusted for serum high-density lipoprotein, with age, sex, ethnicity, and body mass index z score included as pertinent covariates. Multivariate linear regression analysis was performed only when a significant association was observed between CCR2 expression on monocyte subsets and pulmonary function index in univariate analysis.
Table 9.
Multivariate Linear Regression Examining the Association of Pulmonary Function with CCR2 Expression on Patrolling Monocytes
| Pulmonary Function Indices* | Unadjusted Analysis β† (95% CI) (P Value) | Adjusted‡ (Model 1)§ β† (95% CI) (P Value) | Adjusted Analysis‡ (Model 2)§ β† (95% CI) (P Value) |
|---|---|---|---|
| FEV1/FVC ratio | −0.73 (−1.31 to −0.15) (0.01) | −0.82 (−1.38 to −0.25) (0.005) | −0.85 (−1.41 to −0.28) (0.004) |
| RV | 3.87 (1.02 to 6.73) (0.008) | 3.40 (0.55 to 6.24) (0.02) | 2.47 (−0.18 to 5.11) (0.07) |
| RV/TLC ratio | 0.67 (0.19 to 1.14) (0.007) | 0.55 (0.07 to 1.02) (0.02) | 0.38 (−0.06 to 0.81) (0.08) |
| Expiratory reserve volume | −0.08 (−1.7 to 1.6) (0.9) | — | — |
| FRC | 1.77 (0.21 to 3.32) (0.03) | 1.64 (0.07 to 3.21) (0.04) | 1.03 (−0.38 to 2.44) (0.15) |
| Inspiratory capacity | −0.97 (−2.21 to 0.26) (0.12) | — | — |
Definition of abbreviations: BMI = body mass index; CCR2 = C-C chemokine receptor type-2; CI = confidence interval; HDL = high-density lipoprotein; RV = residual volume.
The percent predicted values of pulmonary function indices were included in the analysis other than percent FEV1/FVC ratio.
β represents a unit change in pulmonary function index with unit change in CCR2 expression on monocyte subsets.
Adjusted for serum HDL, with age, sex, ethnicity, and BMI z score included as pertinent covariates. Multivariate linear regression analysis was performed only when a significant association was observed between CCR2 expression on monocyte subsets and pulmonary function index in univariate analysis.
The inclusion of BMI z score in the models did not influence the association of CCR2 on classical or resident monocytes with pulmonary function. However, the inclusion of BMI z score in the models modified the association of CCR2 on patrolling monocytes with pulmonary function, as detailed in Table 9. Model 1 summarizes the multivariate analysis with inclusion of HDL, age, sex, and ethnicity. Model 2 includes BMI z score, in addition to HDL, age, sex, and ethnicity.
Discussion
We found evidence of monocyte activation in obese adolescents with asthma, with fewer classical and more patrolling monocytes among those using inhaled steroids, which correlated with asthma severity and control. This was associated with systemic Th1 polarization and higher serum levels of MCP-1, TNF, and IFN-γ–inducible protein-10. Moreover, an inverse correlation between classical monocytes with Th1 polarization among obese subjects with asthma but not obese subjects without asthma suggests that a relationship exists between immune cells linked with obesity-mediated inflammation (21) among obese subjects with asthma. Together, these results indicate that systemic immune responses are nonatopic among obese subjects with asthma, differ from atopic inflammation among normal-weight subjects with asthma, and may be exaggerated as compared with obese subjects without asthma. Although Th-cell responses were associated with insulin resistance, which mediated their association with pulmonary function, monocyte activation was inversely associated with serum HDL but its association with pulmonary function was partly mediated by BMI. These results suggest that systemic nonatopic inflammation among obese urban adolescents with asthma is associated with metabolic abnormalities, and may underlie pulmonary function deficits found in childhood obesity-related asthma (7).
Monocyte activation has been extensively studied in the context of obesity-mediated inflammation (9, 21), but activation patterns in obesity-related asthma are not known. Patrolling monocytes, increased among obese subjects with asthma and associated with disease severity in our study, are rapidly recruited into lungs in response to inflammatory stimuli (22) and are potent producers of TNF (23), a cytokine that was higher among obese subjects with asthma than normal-weight subjects with asthma in our study. Furthermore, airway macrophages are derived from circulating patrolling monocytes (22), and are known to be proinflammatory in response to leptin (24) and have reduced efferocytosis in obese subjects with asthma compared with normal-weight subjects with asthma (25). These findings suggest that patrolling monocytes likely play a role in the pulmonary morbidity observed in obese subjects with asthma. However, because the proportion of patrolling monocytes among obese subjects with asthma was not higher than in normal-weight subjects with asthma or obese subjects without asthma, a synergistic or additive effect of the coexistence of asthma and obesity was not observed.
Our findings of an inverse association of HDL with the proportion of patrolling monocytes and a direct association with CCR2 expression suggested a role for obesity-mediated dyslipidemia in monocyte activation among obese subjects with asthma (26). The antiinflammatory role of HDL has been well investigated in the context of atherosclerosis (27), where HDL exerts antiinflammatory effects by inhibiting oxidation of low-density lipoprotein, and thereby decreases monocyte activation and inhibits cytokine-mediated expression of adhesion molecules on endothelial cells. The extent to which similar mechanisms may underlie the role of HDL in influencing pulmonary morbidity among obese children needs to be elucidated. Furthermore, the association of CCR2 expression on all three monocyte subsets with lung volumes that are lower among obese individuals (28) including obese subjects with asthma (14), and the attenuation of this association in patrolling monocytes, but not resident monocytes, after adjustment for BMI z score, suggests that obesity-mediated monocyte activation may, in part, drive obesity-mediated lung volume deficits (28).
Although our findings may provide an underlying mechanism for the association of dyslipidemia with incident wheeze among adults (29), and of high fat intake with lower airway obstruction (30), the inverse association of CCR2 patrolling monocytes with FEV1/FVC ratio needs to be investigated. Airway resistance in obese subjects with asthma has been proposed to be secondary to obesity-mediated reduction in RV and FRC rather than inherent reduction of FEV1/FVC ratio (28). We therefore speculate that altered end-expiratory airway smooth muscle stretch caused by reduced RV or FRC, rather than inherent airway smooth muscle hyperresponsiveness alone, may underlie airway reactivity in children with obesity-related asthma. Moreover, the mechanism underlying the relationship of monocyte activation with lung volumes needs further investigation.
Our observation of Th1 polarized systemic inflammation in obese subjects with asthma, even in response to stimulation with D. farinae, an allergen associated with Th2 responses among children with asthma, extends our prior findings among obese preadolescent children with asthma (14), and suggests persistence of nonatopic Th-cell immune responses among adolescents with obesity-related asthma. Our findings corroborate with Th1 polarized systemic inflammation with innate T-cell activation observed in adults (31, 32), and the inverse association of BMI with exhaled nitric oxide, among children with obesity-related asthma (33) but differ from the association of atopy with adiposity among Puerto Rican children with asthma (34) and higher exhaled nitric oxide (35) and submucosal eosinophils found among obese adults with asthma (36). These discordant results may also be indicative of heterogeneity in the presentation of obesity-related asthma (37), similar to that in normal-weight asthma (38) that may be influenced by age of onset (39), ancestry (40, 41), body fat distribution (42), and metabolic dysregulation (6). The results also highlight the importance of simultaneous investigation of airway and systemic inflammation. Dynamic change in airway inflammatory markers, which were low among obese subjects with asthma but increased after bariatric surgery, even though their lung function improved, has been previously reported (43). These studies highlight the dynamic interaction between systemic and airway-specific inflammation that is known in normal-weight asthma but needs better elucidation in obesity-related asthma.
We also found that insulin resistance was associated with Th1 polarization, and attenuated the relationship of Th-cell responses with lung volume indices influenced by obesity (28), suggesting that inflammation mediated by insulin resistance may be a potential factor underlying the epidemiologic associations between insulin resistance and incident asthma in adults (44) and asthma prevalence among children (6). There is increasing evidence that glucose metabolism is intricately linked with Th-cell activation (45). Activated effector T cells, including CD4+ cells, use glycolysis as the preferred metabolic pathway, with increased expression of insulin and Glut 1 receptors, and this pathway is proposed to play a key role in adipose tissue inflammation among the obese (46). Moreover, glucose use by Th cells is dependent on the PI3K/Akt pathway, which is intricately linked with both Th-cell activation and insulin resistance. We therefore hypothesize that PI3K/Akt pathway may be at play in Th-cell activation among obese subjects with asthma, a speculation supported by our previous findings of hypomethylated PI3K promoter gene among obese subjects with asthma compared with obese subjects without asthma (47).
Although we found evidence of monocyte activation and Th1 polarization, total white cell count, a general measure of systemic inflammation, was not elevated among obese subjects with asthma. These results are in keeping with prior studies that did not find elevated CRP among obese children with asthma (11). Because obesity is associated with low-grade inflammation and participants included in prior studies and ours had well-controlled asthma with no recent rapid weight gain, it is possible that overt systemic inflammatory measures, such as white cell count or CRP, may not be altered. Furthermore, CRP was elevated among obese adults with asthma (10), suggesting that young age and the relatively short duration of existence of obesity-related asthma among children may also contribute to the absence of overt signs of systemic inflammation.
Together, our findings suggest that immunometabolism may play a role among obese subjects with asthma (48). The association of monocytes with HDL levels and Th cells with insulin resistance begins to elucidate the complex interactive relationship between obesity-mediated metabolic dysregulation with immune cell activation, which contributes to obesity-related asthma via varied pathways, which may underlie the heterogeneity of the disease. Because not all obese children develop asthma, we speculate that the subset of obese children who develop metabolic dysregulation and exaggerated inflammatory responses to adiposity may be predisposed to obesity-mediated pulmonary morbidity. Our results therefore highlight the need for longitudinal studies to address the relationship between onset of obesity and associated metabolic dysregulation, systemic immune responses, and pulmonary morbidity to better define the role of these mechanisms in the pathogenesis of pediatric obesity-related asthma. As the relationship between metabolism and immune responses is better identified (26), diet modification rather than weight loss alone may offer a more feasible option to address the burden of obesity-related asthma (49).
Although the strength of our study is the detailed investigation of systemic inflammatory profiles among urban adolescents and their association with metabolic abnormalities and pulmonary function, there are limitations to our study. We studied a limited panel of Th cells and recognize that others including Th17 and Th22 cells or innate lymphoid cells (32) may play a role in the observed inflammatory patterns. We did not quantify measures of atopy, including total or allergen-specific IgE, or measures of airway inflammation in conjunction with systemic inflammation. The negative association of CCR2 expression on patrolling monocytes with FEV1/FVC ratio is intriguing and needs further investigation. Moreover, we studied systemic inflammation in urban Hispanic and African American adolescents with well-controlled asthma; our findings are therefore not generalizable to the general population or reflective of inflammatory patterns in the setting of an exacerbation and likely explain our modest yet significant associations. However, we limited our investigations to these ethnic groups because of their high disease burden (3) and the greater effect of adiposity on pulmonary function among Hispanics and African Americans compared with whites. Furthermore, the cross-sectional nature of our study did not allow elucidation of the temporal relationship between obesity, metabolic abnormalities, systemic inflammation, and development of asthma.
In summary, we found evidence of nonatopic systemic inflammation, with monocyte activation and Th1 polarization, among obese urban adolescents with asthma that was associated with metabolic abnormalities and pulmonary function indices. Our findings are pertinent because we report these associations for the first time in a pediatric population with well-controlled asthma, identifying systemic inflammation as a potential mechanism linking metabolic dysregulation and pulmonary function deficits among the obese. Because not all obese individuals develop insulin resistance or dyslipidemia, the association of monocyte activation with HDL levels, and that of Th-cell responses primarily with insulin resistance, may begin to elucidate mechanisms that may underlie heterogeneity in and susceptibility to pediatric obesity-related asthma (37).
Footnotes
Supported in part by NHLBI grant K23 HL118733 (D.R.); National Institutes of Health (NIH)/National Center for Research Resources (NCRR) grant 5KL2 RR025749-04 (D.R.); and Clinical and Translational Science Award grants 1 UL1 TR001073-01, 1 TL1 TR001072-01, and 1 KL2 TR001071-01 (Albert Einstein Institute of Clinical and Translational Research) from the National Center for Advancing Translational Sciences, a component of the NIH. The views expressed in this article do not communicate an official position of the NIH/NCRR.
Author Contributions: Conception and design, D.R., L.T., and F.M. Laboratory testing, S.F., J.O., and A.M.H. Data collection, Y.S., R.H.B., and Z.S.K. Data analysis and interpretation, D.R., A.M.H., J.O., and C.B.H. Drafting of manuscript, D.R., L.T., C.B.H., and F.M.
This article has an online supplement, which is accessible from this issue's table of contents at www.atsjournals.org
Originally Published in Press as DOI: 10.1164/rccm.201409-1587OC on December 2, 2014
Author disclosures are available with the text of this article at www.atsjournals.org.
References
- 1.Ogden CL, Carroll MD, Kit BK, Flegal KM. Prevalence of obesity and trends in body mass index among US children and adolescents, 1999-2010. JAMA. 2012;307:483–490. doi: 10.1001/jama.2012.40. [DOI] [PMC free article] [PubMed] [Google Scholar]
- 2.Gold DR, Damokosh AI, Dockery DW, Berkey CS. Body-mass index as a predictor of incident asthma in a prospective cohort of children. Pediatr Pulmonol. 2003;36:514–521. doi: 10.1002/ppul.10376. [DOI] [PubMed] [Google Scholar]
- 3.Black MH, Zhou H, Takayanagi M, Jacobsen SJ, Koebnick C. Increased asthma risk and asthma-related health care complications associated with childhood obesity. Am J Epidemiol. 2013;178:1120–1128. doi: 10.1093/aje/kwt093. [DOI] [PMC free article] [PubMed] [Google Scholar]
- 4.Lang JE, Hossain J, Smith K, Lima JJ. Asthma severity, exacerbation risk, and controller treatment burden in underweight and obese children. J Asthma. 2012;49:456–463. doi: 10.3109/02770903.2012.677895. [DOI] [PubMed] [Google Scholar]
- 5.Forno E, Lescher R, Strunk R, Weiss S, Fuhlbrigge A, Celedón JC Childhood Asthma Management Program Research Group. Decreased response to inhaled steroids in overweight and obese asthmatic children. J Allergy Clin Immunol. 2011;127:741–749. doi: 10.1016/j.jaci.2010.12.010. [DOI] [PMC free article] [PubMed] [Google Scholar]
- 6.Cottrell L, Neal WA, Ice C, Perez MK, Piedimonte G. Metabolic abnormalities in children with asthma. Am J Respir Crit Care Med. 2011;183:441–448. doi: 10.1164/rccm.201004-0603OC. [DOI] [PMC free article] [PubMed] [Google Scholar]
- 7.Rastogi D, Bhalani K, Hall CB, Isasi CR. Association of pulmonary function with adiposity and metabolic abnormalities in urban minority adolescents. Ann Am Thorac Soc. 2014;11:744–752. doi: 10.1513/AnnalsATS.201311-403OC. [DOI] [PMC free article] [PubMed] [Google Scholar]
- 8.Lumeng CN, Saltiel AR. Inflammatory links between obesity and metabolic disease. J Clin Invest. 2011;121:2111–2117. doi: 10.1172/JCI57132. [DOI] [PMC free article] [PubMed] [Google Scholar]
- 9.Dalmas E, Clément K, Guerre-Millo M. Defining macrophage phenotype and function in adipose tissue. Trends Immunol. 2011;32:307–314. doi: 10.1016/j.it.2011.04.008. [DOI] [PubMed] [Google Scholar]
- 10.Scott HA, Gibson PG, Garg ML, Wood LG. Airway inflammation is augmented by obesity and fatty acids in asthma. Eur Respir J. 2011;38:594–602. doi: 10.1183/09031936.00139810. [DOI] [PubMed] [Google Scholar]
- 11.Jensen ME, Gibson PG, Collins CE, Wood LG. Airway and systemic inflammation in obese children with asthma. Eur Respir J. 2013;42:1012–1019. doi: 10.1183/09031936.00124912. [DOI] [PubMed] [Google Scholar]
- 12.Breslin WL, Johnston CA, Strohacker K, Carpenter KC, Davidson TR, Moreno JP, Foreyt JP, McFarlin BK. Obese Mexican American children have elevated MCP-1, TNF-α, monocyte concentration, and dyslipidemia. Pediatrics. 2012;129:e1180–e1186. doi: 10.1542/peds.2011-2477. [DOI] [PubMed] [Google Scholar]
- 13.Moniuszko M, Bodzenta-Lukaszyk A, Kowal K, Lenczewska D, Dabrowska M. Enhanced frequencies of CD14++CD16+, but not CD14+CD16+, peripheral blood monocytes in severe asthmatic patients. Clin Immunol. 2009;130:338–346. doi: 10.1016/j.clim.2008.09.011. [DOI] [PubMed] [Google Scholar]
- 14.Rastogi D, Canfield SM, Andrade A, Isasi CR, Hall CB, Rubinstein A, Arens R. Obesity-associated asthma in children: a distinct entity. Chest. 2012;141:895–905. doi: 10.1378/chest.11-0930. [DOI] [PubMed] [Google Scholar]
- 15.Rastogi D, Oh J, Fraser S, Schulman Y, Bhagtani R, Khan Z, Tesfa L. Monocyte activation patterns associated with asthma and obesity among urban minority adolescents. Am J Respir Crit Care Med. 2013;187:A5004. [Google Scholar]
- 16.Wildfire JJ, Gergen PJ, Sorkness CA, Mitchell HE, Calatroni A, Kattan M, Szefler SJ, Teach SJ, Bloomberg GR, Wood RA, et al. Development and validation of the Composite Asthma Severity Index—an outcome measure for use in children and adolescents. J Allergy Clin Immunol. 2012;129:694–701. doi: 10.1016/j.jaci.2011.12.962. [DOI] [PMC free article] [PubMed] [Google Scholar]
- 17.Koolen BB, Pijnenburg MW, Brackel HJ, Landstra AM, van den Berg NJ, Merkus PJ, Hop WC, Vaessen-Verberne AA. Validation of a web-based version of the asthma control test and childhood asthma control test. Pediatr Pulmonol. 2011;46:941–948. doi: 10.1002/ppul.21458. [DOI] [PubMed] [Google Scholar]
- 18.Weisberg SP, Hunter D, Huber R, Lemieux J, Slaymaker S, Vaddi K, Charo I, Leibel RL, Ferrante AW., Jr CCR2 modulates inflammatory and metabolic effects of high-fat feeding. J Clin Invest. 2006;116:115–124. doi: 10.1172/JCI24335. [DOI] [PMC free article] [PubMed] [Google Scholar]
- 19.Christiansen SC, Martin SB, Schleicher NC, Koziol JA, Hamilton RG, Zuraw BL. Exposure and sensitization to environmental allergen of predominantly Hispanic children with asthma in San Diego’s inner city. J Allergy Clin Immunol. 1996;98:288–294. doi: 10.1016/s0091-6749(96)70152-5. [DOI] [PubMed] [Google Scholar]
- 20.StataCorpStata statistical software: Release 12. College Station, TX: StatCorp; 2011 [Google Scholar]
- 21.Ferrante AW., Jr The immune cells in adipose tissue. Diabetes Obes Metab. 2013;15:34–38. doi: 10.1111/dom.12154. [DOI] [PMC free article] [PubMed] [Google Scholar]
- 22.Landsman L, Varol C, Jung S. Distinct differentiation potential of blood monocyte subsets in the lung. J Immunol. 2007;178:2000–2007. doi: 10.4049/jimmunol.178.4.2000. [DOI] [PubMed] [Google Scholar]
- 23.Ziegler-Heitbrock L. The CD14+ CD16+ blood monocytes: their role in infection and inflammation. J Leukoc Biol. 2007;81:584–592. doi: 10.1189/jlb.0806510. [DOI] [PubMed] [Google Scholar]
- 24.Lugogo NL, Hollingsworth JW, Howell DL, Que LG, Francisco D, Church TD, Potts-Kant EN, Ingram JL, Wang Y, Jung SH, et al. Alveolar macrophages from overweight/obese subjects with asthma demonstrate a proinflammatory phenotype. Am J Respir Crit Care Med. 2012;186:404–411. doi: 10.1164/rccm.201109-1671OC. [DOI] [PMC free article] [PubMed] [Google Scholar] [Retracted]
- 25.Fernandez-Boyanapalli R, Goleva E, Kolakowski C, Min E, Day B, Leung DY, Riches DW, Bratton DL, Sutherland ER. Obesity impairs apoptotic cell clearance in asthma. J Allergy Clin Immunol. 2013;131:1041–1047, e1–e3. doi: 10.1016/j.jaci.2012.09.028. [DOI] [PMC free article] [PubMed] [Google Scholar]
- 26.Wood LG, Gibson PG. Dietary factors lead to innate immune activation in asthma. Pharmacol Ther. 2009;123:37–53. doi: 10.1016/j.pharmthera.2009.03.015. [DOI] [PubMed] [Google Scholar]
- 27.Rolin J, Maghazachi AA. Implications of chemokines, chemokine receptors, and inflammatory lipids in atherosclerosis. J Leukoc Biol. 2014;95:575–585. doi: 10.1189/jlb.1113571. [DOI] [PubMed] [Google Scholar]
- 28.Salome CM, King GG, Berend N. Physiology of obesity and effects on lung function. J Appl Physiol (1985) 2010;108:206–211. doi: 10.1152/japplphysiol.00694.2009. [DOI] [PubMed] [Google Scholar]
- 29.Fenger RV, Gonzalez-Quintela A, Linneberg A, Husemoen LL, Thuesen BH, Aadahl M, Vidal C, Skaaby T, Sainz JC, Calvo E. The relationship of serum triglycerides, serum HDL, and obesity to the risk of wheezing in 85,555 adults. Respir Med. 2013;107:816–824. doi: 10.1016/j.rmed.2013.02.001. [DOI] [PubMed] [Google Scholar]
- 30.Berthon BS, Macdonald-Wicks LK, Gibson PG, Wood LG. Investigation of the association between dietary intake, disease severity and airway inflammation in asthma. Respirology. 2013;18:447–454. doi: 10.1111/resp.12015. [DOI] [PubMed] [Google Scholar]
- 31.Dixon AE, Johnson SE, Griffes LV, Raymond DM, Ramdeo R, Soloveichik A, Suratt BT, Cohen RI. Relationship of adipokines with immune response and lung function in obese asthmatic and non-asthmatic women. J Asthma. 2011;48:811–817. doi: 10.3109/02770903.2011.613507. [DOI] [PMC free article] [PubMed] [Google Scholar]
- 32.Kim HY, Lee HJ, Chang YJ, Pichavant M, Shore SA, Fitzgerald KA, Iwakura Y, Israel E, Bolger K, Faul J, et al. Interleukin-17-producing innate lymphoid cells and the NLRP3 inflammasome facilitate obesity-associated airway hyperreactivity. Nat Med. 2014;20:54–61. doi: 10.1038/nm.3423. [DOI] [PMC free article] [PubMed] [Google Scholar]
- 33.Han Y-Y, Forno E, Celedón JC. Adiposity, fractional exhaled nitric oxide, and asthma in U.S. children. Am J Respir Crit Care Med. 2014;190:32–39. doi: 10.1164/rccm.201403-0565OC. [DOI] [PMC free article] [PubMed] [Google Scholar]
- 34.Forno E, Acosta-Pérez E, Brehm JM, Han YY, Alvarez M, Colón-Semidey A, Canino G, Celedón JC.Obesity and adiposity indicators, asthma, and atopy in Puerto Rican children J Allergy Clin Immunol 20141331308–1314.e1–e5 [DOI] [PMC free article] [PubMed] [Google Scholar]
- 35.Sutherland ER, Goleva E, King TS, Lehman E, Stevens AD, Jackson LP, Stream AR, Fahy JV, Leung DY Asthma Clinical Research Network. Cluster analysis of obesity and asthma phenotypes. PLoS ONE. 2012;7:e36631. doi: 10.1371/journal.pone.0036631. [DOI] [PMC free article] [PubMed] [Google Scholar]
- 36.Desai D, Newby C, Symon FA, Haldar P, Shah S, Gupta S, Bafadhel M, Singapuri A, Siddiqui S, Woods J, et al. Elevated sputum interleukin-5 and submucosal eosinophilia in obese individuals with severe asthma. Am J Respir Crit Care Med. 2013;188:657–663. doi: 10.1164/rccm.201208-1470OC. [DOI] [PMC free article] [PubMed] [Google Scholar]
- 37.Peters MC, Fahy JV. Type 2 immune responses in obese individuals with asthma. Am J Respir Crit Care Med. 2013;188:633–634. doi: 10.1164/rccm.201307-1360ED. [DOI] [PubMed] [Google Scholar]
- 38.Wenzel SE. Asthma phenotypes: the evolution from clinical to molecular approaches. Nat Med. 2012;18:716–725. doi: 10.1038/nm.2678. [DOI] [PubMed] [Google Scholar]
- 39.Holguin F, Bleecker ER, Busse WW, Calhoun WJ, Castro M, Erzurum SC, Fitzpatrick AM, Gaston B, Israel E, Jarjour NN, et al. Obesity and asthma: an association modified by age of asthma onset. J Allergy Clin Immunol. 2011;127:1486–1493, e2. doi: 10.1016/j.jaci.2011.03.036. [DOI] [PMC free article] [PubMed] [Google Scholar]
- 40.Huang SL, Shiao G, Chou P. Association between body mass index and allergy in teenage girls in Taiwan. Clin Exp Allergy. 1999;29:323–329. doi: 10.1046/j.1365-2222.1999.00455.x. [DOI] [PubMed] [Google Scholar]
- 41.Nagel G, Koenig W, Rapp K, Wabitsch M, Zoellner I, Weiland SK. Associations of adipokines with asthma, rhinoconjunctivitis, and eczema in German schoolchildren. Pediatr Allergy Immunol. 2009;20:81–88. doi: 10.1111/j.1399-3038.2008.00740.x. [DOI] [PubMed] [Google Scholar]
- 42.Appleton SL, Adams RJ, Wilson DH, Taylor AW, Ruffin RE North West Adelaide Health Study Team. Central obesity is associated with nonatopic but not atopic asthma in a representative population sample. J Allergy Clin Immunol. 2006;118:1284–1291. doi: 10.1016/j.jaci.2006.08.011. [DOI] [PubMed] [Google Scholar]
- 43.Dixon AE, Pratley RE, Forgione PM, Kaminsky DA, Whittaker-Leclair LA, Griffes LA, Garudathri J, Raymond D, Poynter ME, Bunn JY, et al. Effects of obesity and bariatric surgery on airway hyperresponsiveness, asthma control, and inflammation. J Allergy Clin Immunol. 2011;128:508–515, e1–e2. doi: 10.1016/j.jaci.2011.06.009. [DOI] [PMC free article] [PubMed] [Google Scholar]
- 44.Thuesen BH, Husemoen LLN, Hersoug LG, Pisinger C, Linneberg A. Insulin resistance as a predictor of incident asthma-like symptoms in adults. Clin Exp Allergy. 2009;39:700–707. doi: 10.1111/j.1365-2222.2008.03197.x. [DOI] [PubMed] [Google Scholar]
- 45.MacIver NJ, Michalek RD, Rathmell JC. Metabolic regulation of T lymphocytes. Annu Rev Immunol. 2013;31:259–283. doi: 10.1146/annurev-immunol-032712-095956. [DOI] [PMC free article] [PubMed] [Google Scholar]
- 46.Gerriets VA, MacIver NJ. Role of T cells in malnutrition and obesity. Front Immunol. 2014;5:379. doi: 10.3389/fimmu.2014.00379. [DOI] [PMC free article] [PubMed] [Google Scholar]
- 47.Rastogi D, Suzuki M, Greally JM. Differential epigenome-wide DNA methylation patterns in childhood obesity-associated asthma. Sci Rep. 2013;3:2164. doi: 10.1038/srep02164. [DOI] [PMC free article] [PubMed] [Google Scholar]
- 48.Periyalil HA, Gibson PG, Wood LG. Immunometabolism in obese asthmatics: are we there yet? Nutrients. 2013;5:3506–3530. doi: 10.3390/nu5093506. [DOI] [PMC free article] [PubMed] [Google Scholar]
- 49.Dixon AE. Breathing what we eat. Respirology. 2013;18:391–392. doi: 10.1111/resp.12056. [DOI] [PubMed] [Google Scholar]
- 50.Bethesda (MD): National Institute of Health: National Heart, Lung, and Blood Institute; 2007. Expert Panel Report 3: guidelines for the diagnosis and management of asthma. [Google Scholar]