

Summary
Recent studies have demonstrated that expression of the Staphylococcus aureus lrgAB operon is specifically expressed within tower structures during biofilm development. To gain a better understanding of the mechanisms underlying this spatial control of lrgAB expression, we carried out a detailed analysis of the LytSR two-component system. Specifically, a conserved aspartic acid (Asp53) of the LytR response regulator was shown to be the target of phosphorylation, which resulted in enhanced binding to the lrgAB promoter and activation of transcription. In addition, we identified His390 of the LytS histidine kinase as the site of autophosphorylation and Asn394 as a critical amino acid involved in phosphatase activity. Interestingly, LytS-independent activation of LytR was observed during planktonic growth, with acetyl phosphate acting as a phosphodonor to LytR. In contrast, mutations disrupting the function of LytS prevented tower-specific lrgAB expression, providing insight into the physiologic environment within these structures. In addition, over activation of LytR led to increased lrgAB promoter activity during planktonic and biofilm growth and a change in biofilm morphology. Overall, the results of this study are the first to define the LytSR signal transduction pathway, as well as determine the metabolic context within biofilm tower structures that triggers these signaling events.
Keywords: Two-component system, biofilm, signal transduction, lrgAB, LytSR
Introduction
S. aureus is a gram-positive pathogen that asymptomatically colonizes approximately 30% of the human population. It also has the potential to cause a wide variety of diseases ranging from simple skin and soft tissue infections to life-threatening septicemia and endocarditis (Lowy, 1998, Costerton et al., 1999, Fowler et al., 2005, Boucher et al., 2010, Fey, 2010). This dual nature as a pathogen and as a commensal organism is attributed to its ability to adapt to a wide variety of environments/lifestyles, combined with the large arsenal of virulence factors it possesses (reviewed in (Nizet, 2007, Brown et al., 2014)). These virulence factors include many cell wall-associated and secreted molecules that not only damage host tissue but also are defense mechanisms against host immune factors. To be successful, S. aureus must adapt quickly to changes in its environment. Like other bacteria, this adaptation is mediated through a complex network of regulatory proteins, small stable RNAs (ssRNAs), quorum sensing molecules, and two-component systems (TCSs) (Novick, 2003, Morrison & Dunman, 2011).
TCSs are ubiquitous signaling mechanisms used in bacteria to adapt to a wide array of environmental signals (Capra & Laub, 2012) and are typically composed of a membrane bound sensor kinase and a cognate response regulator (Stock et al., 2000). Typically, the sensor kinase is responsible for signal recognition, which activates the catalytic domain, resulting in the autophosphorylation of a conserved histidine residue in the histidine phosphotransfer domain of the protein. The phosphorylated sensor kinase acts as a phosphodonor for its cognate response regulator, which receives the phosphate on a conserved aspartic acid residue in the receiver domain of the protein. The phosphorylated version of the response regulator mediates the appropriate cellular response. To return the system to a “pre-stimulus” state, the response regulator must be dephosphorylated. Although the phosphorylated response regulator can undergo autodephosphorylation, it is common for other proteins to augment this process (Gao & Stock, 2009). In many TCSs, phosphatase activity associated with the cognate sensor kinase and/or auxiliary phosphatases regulate the dephosphorylation of the response regulator. Sensor kinase-associated phosphatase activity is thought to function both to return response regulators to their inactive states, as well as to limit the impact of aberrant activation of the response regulator by non-cognate sensor kinases or small phosphodonor molecules (Laub & Goulian, 2007).
LytSR was originally described as a putative TCS that affects the control of murein hydrolase activity and autolysis (Brunskill & Bayles, 1996a). Further characterization of the lytSR operon led to the discovery of the adjacent lrgAB operon whose expression was found to be LytSR dependent (Brunskill & Bayles, 1996b). Additionally, microarray analysis revealed that a lytSR mutation affected expression of 267 genes encoding proteins involved in a variety of functions including carbohydrate, energy, and nucleotide metabolism (Sharma-Kuinkel et al., 2009). Analysis of the transcription of Staphylococcus epidermidis (Zhu et al., 2010) and Streptococcus mutans (Ahn et al., 2012) lytSR mutants found similar effects on gene expression. In all species analyzed, the lrgAB operon was one of the most highly differentially-regulated loci in response to the disruption of the lytSR operon.
Multiple studies have revealed that environmental heterogeneity exists within a biofilm due to gradients of nutritional and oxygen supplies, causing alterations in the metabolic states of the bacteria depending on their location within the biofilm (reviewed in (Stewart & Franklin, 2008)). As a TCS, LytSR likely has a function in S. aureus biofilm formation by sensing and responding to one of these many cues. Previous studies have shown that lrgAB promoter activity during biofilm formation is primarily expressed in tower structures (Moormeier et al., 2013), suggesting that the signal to which LytS responds is present more abundantly in these structures. Although the specific identity of the LytS signal is not known, the presence of up to six potential membrane spanning sequences in the LytS sensor domain (Brunskill & Bayles, 1996a), combined with the observation that lrgAB expression is induced by membrane potential dissipating agents (Patton et al., 2006, Muthaiyan et al., 2008, Sharma-Kuinkel et al., 2009), suggests that the signal is closely associated with the cytoplasmic membrane. However, lrgAB expression also has been shown to be induced during overflow metabolism, which occurs during growth on excess glucose in the presence oxygen (Rice et al., 2005, Patton et al., 2006, Sharma-Kuinkel et al., 2009). A primary intermediate of overflow metabolism, acetyl phosphate, has been shown to act as a small phosphodonor to response regulators (reviewed in (Wolfe, 2005)), leading to the hypothesis that acetyl phosphate, may directly activate LytR in an alternative signaling pathway (Rice & Bayles, 2008, Sadykov & Bayles, 2012).
In the current study, we characterized the molecular elements important in signaling between LytS and LytR, and examine the effects of signal transduction perturbation on lrgAB promoter activity during biofilm formation and overall biofilm morphology. Point mutations were generated to define the essential amino acids in LytSR signal transduction, revealing that LytS has both kinase and phosphatase activities. Additionally, mutations conferring constitutive activation of LytR or loss of LytS phosphatase activity resulted in lrgAB over expression. These results provide essential clues to the environmental signals controlling tower-specific gene expression during biofilm development.
Results
Construction of a chromosomal lrgAB reporter
Previous studies of the S. aureus LytSR TCS revealed its role in the regulation of lrgAB expression and biofilm formation (Brunskill & Bayles, 1996a, Sharma-Kuinkel et al., 2009). Given the tower-specific localization of lrgAB promoter activity observed during biofilm development (Moormeier et al., 2013), we sought to gain insight into the control of LytSR-dependent gene expression by studying, in detail, the signal transduction mechanisms associated with the LytS and LytR proteins. Thus, a variety of LytS and LytR deletion and point mutations were generated and their effects on lrgAB promoter activity and biofilm development were examined. To streamline the analysis of lytS and lytR mutations on lrgAB expression, we first constructed a chromosomally integrated PlrgAB::lacZ reporter by inserting the lacZ gene downstream of lrgB, resulting in the co-transcription of lacZ with the lrgAB operon. The resulting strain allowed for the use of β-galactosidase assays as a measure of LytSR-dependent regulation of lrgAB promoter activity, and eliminated the adverse effects of plasmid-based reporter constructs. To test the utility of the integrated reporter construct, we introduced a complete lytSR deletion mutation into this strain and assessed the β-galactosidase activity generated. Consistent with previous reports (Chandramohan et al., 2009, Sharma-Kuinkel et al., 2009, Zhu et al., 2010, Ahn et al., 2012), the lytSR mutation abolished lrgAB promoter activity (Supplemental Figure 1) indicating that this lacZ reporter construct provides an accurate assessment of lrgAB expression. As expected, deletion of lytR alone also abolished lrgAB promoter activity compared to the wild-type and complemented strains, consistent with the putative role of LytR as a response regulator (Supplemental Figure 1).
Asp53 of LytR is required for lrgAB expression
The prototypic response regulator encodes an essential aspartic acid residue that is phosphorylated by its cognate sensor kinase (Stock et al., 2000). Based on sequence alignment with other characterized response regulators, the aspartic acid residue at position 53 (Asp53) of LytR was predicted to be the target of LytS-mediated phosphorylation (Brunskill & Bayles, 1996a). To test this prediction, we performed site-directed mutagenesis on the chromosomal locus of lytR, converting the Asp53 to an alanine (LytRD53A). Indeed, this mutation led to the loss of lrgAB promoter activity (Figure 1), confirming the essential nature of Asp53 in LytR activity. Expression of wild-type lytR in trans on a multicopy plasmid restored lrgAB promoter activity in this mutant strain.
Figure 1. Asp53 of LytR is important for lrgAB promoter activity.
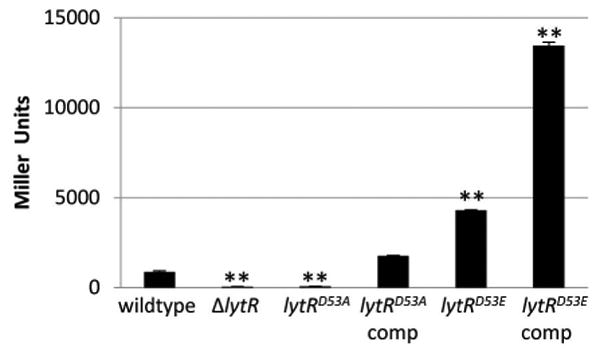
Cultures of KB5019 (wildtype), KB5020 (ΔlytR), KB5036 (lytRD53A), KB5036 (pML74) (lytR complement), KB5038 (lytRD53E), and KB5038 (pML74) were grown in TSB to late exponential phase, harvested, and the β-galactosidase activity (Miller Units) generated by the chromosomal PlrgAB-lacZ was measured. The data presented are the average of two biological replicates (n=2) with standard error of the mean indicated. A two-tailed Student T-test assuming equal variances was used to determine statistical significance compared to wildtype. **p<0.005
Previous reports have shown that mutating the conserved aspartic acid residue in some response regulators to a glutamic acid results in a conformational change similar to what occurs when the aspartic acid residue is phosphorylated, thus resulting in a constitutively active response regulator (Klose et al., 1993, Lan & Igo, 1998, Siam & Marczynski, 2003). To test if altering Asp53 of LytR to a glutamic acid results in constitutive activity, we performed site-directed mutagenesis of the lytR chromosomal allele, resulting in a strain that produces the D53E mutant derivative of LytR (designated LytRD53E). As anticipated, lrgAB promoter activity was increased in the lytRD53E mutant compared to the wild-type strain (Figure 1), suggesting enhanced activity of LytR. Consistent with this observation, when the wild-type lytR allele was expressed from a plasmid in the lytRD53E mutant, the levels of lrgAB promoter activity were approximately 15 times higher than the wild-type strain, suggesting an additive effect of the wild-type LytR and constitutively active LytRD53E variant. Overall, these data demonstrate that Asp53 is essential for lrgAB expression and is likely the amino acid phosphorylated by LytS.
Asp53 is required for LytR binding to the lrgAB promoter
Although lrgAB expression has previously been shown to be dependent on lytSR (Brunskill & Bayles, 1996a, Patton et al., 2006, Sharma-Kuinkel et al., 2009), the direct interaction of LytR with the lrgAB promoter region has not been demonstrated. As shown in Figure 2A, electrophoretic mobility shift assays revealed that wild-type full-length LytR binds to a DNA fragment spanning the lrgAB promoter region in a dose-dependent manner, even resulting in the inability of the bound DNA to enter the gel at higher protein concentrations. Unlike the wild-type protein, similar quantities of the LytRD53A protein failed to bind to the lrgAB promoter fragment. In contrast, LytRD53E protein, which mimics phosphorylated LytR, bound to the lrgAB promoter fragment at all concentrations tested. Notably, the binding of LytRD53E to the lrgAB promoter was distinct compared to the binding by the wild-type protein, as indicated by the absence of a “super shift” of the DNA in the presence of higher concentrations of this mutant protein (Figure 2A). Cold competitor DNA in excess resulted in a complete loss of shift (data not shown) suggesting that the binding was specific to the lrgAB promoter region.
Figure 2. LytSR signal transduction is dependent on aspartic acid 53.
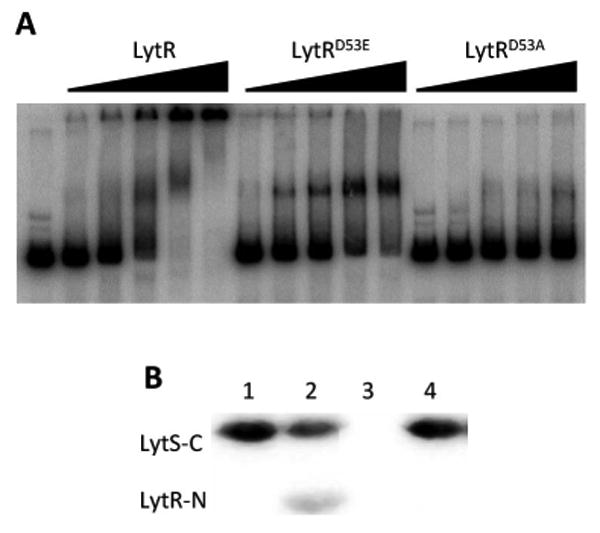
A. Electrophoretic mobility shift assay. Increasing concentrations (0, 1.8, 3.6, 5.4, 7.2, and 9.0 pmole) of purified LytR, LytRD53A, and LytRD53E were incubated with a 32P-labeled 320 bp DNA fragment spanning the lrgAB promoter region. The binding reactions were incubated for 30 minutes at 37°C, separated in a 4.0% native acrylamide gel, dried, and analyzed using a Storm Scanner following exposure to a phosphor imager screen. B. Phosphotransfer to LytR. Purified LytS-C was autophosphorylated with [γ32P] ATP and then incubated with purified LytR-N (lane 2) and LytR-ND53A (lane 4). The reaction was stopped after 15 seconds. Radiolabeled LytS-C (lane 1) and LytR-N incubated with [γ32P] ATP only (lane 3) were used as controls. The samples were separated in a 15% SDS-PAGE gel and radiolabeled proteins were visualized using a phosphor imager.
Signal Transduction from LytS to LytR requires Asp53
The results presented in Figures 1 and 2A demonstrate that Asp53 is necessary for LytR activation, suggesting that this is the amino acid targeted by the LytS sensor kinase for phosphorylation. To test this directly, we examined the ability of LytR to phosphorylate in the presence of LytS in vitro. Similar to a previous report (Shala et al., 2013), we were unable to purify sufficient quantities of full length LytS and LytR for these assays, so we purified and tested only the transmitter domain of LytS (designated LytS-C) and the receiver domain of LytR (designated LytR-N). In this experiment, LytS-C was autophosphorylated (Figure 2B, Lane 1) and subsequently incubated with LytR-N or LytR-ND53A. We observed rapid phosphorylation (within 15 seconds) of LytR-N by LytS-C (Lane 2), but no phosphorylation of LytR-N in the absence of radiolabeled LytS-C (Lane 3). In contrast, no LytS-C-dependent phosphorylation of LytR-ND53A was observed (Lane 4), confirming that Asp53 is the site of LytR phosphorylation.
Effect of lytS mutation on lrgAB promoter activity
Experiments in our laboratory have demonstrated that lrgAB promoter activity in a lytSR mutant can be restored by expressing lytR alone in trans, suggesting that lytS-independent lrgAB expression can occur (Supplemental Figure 2). Thus, to investigate the role of LytS in the control of LytSR-mediated gene expression, we initially created a ΔlytS mutation leaving intact the native lytSR promoter region. However, this mutation had a polar effect on lytR (data not shown), thus, making it unsuitable for assessing the specific role of lytS in lrgAB expression. In an alternative strategy, the lytS gene was rendered nonfunctional by inserting an in-frame stop codon after the first 34 codons of the lytS gene. This mutant allele, designated lytSTAA, was shown to have no effect on the size or quantity of lytSR transcripts produced (data not shown). As shown in Figure 3A, lrgAB promoter activity was observed in the lytSTAA mutant during planktonic growth, consistent with the observation that LytR alone can induce lrgAB expression under these conditions. Indeed, promoter activity was observed to be even higher in the lytSTAA mutant compared to the wild-type and complemented strains, suggesting that LytS can suppress the non-LytS dependent activation of the lrgAB promoter.
Figure 3. LytS independent lrgAB expression during planktonic growth.
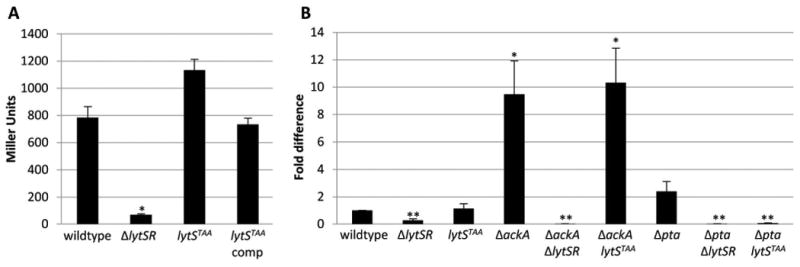
A. Cultures of KB5019 (wildtype), KB5020 (ΔlytSR), KB5024 (lytSTAA), KB5024 (pML11) (lytS complement) were grown in TSB to late exponential phase, harvested, and the β-galactosidase activity (Miller Units) generated by the chromosomal PlrgAB-lacZ was measured. The data presented are the average of two biological replicates (n=2) with standard error of the mean indicated. A two-tailed Student T-test assuming equal variances was used to determine statistical significance compared to wildtype. *p<0.05 B. Cultures of UAMS-1 (wildtype), KB5010 (ΔlytSR), KB5014 (lytSTAA), KB8000 (ΔackA), KB5050 (ΔackA-ΔlytSR), KB5051 (ΔackA-lytSTAA), KB8001 (Δpta), KB5046 (Δpta-ΔlytSR), and KB5047 (Δpta-lytSTAA) were grown in TSB to late exponential phase and harvested. RNA was isolated from the cells and qRT-PCR was utilized to quantify lrgA transcripts relative to the wild-type strains. The data presented are the average of two biological replicates (n=2) with standard error of the mean indicated. A two-tailed Student T-test assuming equal variances was used to determine statistical significance compared to wildtype. *p<0.05, **p<0.005
Acetyl phosphate acts as a phosphodonor for LytR in the absence of LytS
The observation that lrgAB expression occurs in the absence of lytS-mediated signal transduction suggests the presence of alternative ways for activation of LytR. Multiple studies have shown that acetyl phosphate can act as small phosphodonor molecules for response regulators in vitro and in vivo (Wolfe, 2005, Wolfe, 2010). To test if LytSR integrates the signal transduction of LytS and metabolic cues from acetyl phosphate pools, we manipulated the intracellular acetyl phosphate levels by mutating individual genes of the phosphotransacetylase-acetate kinase (Pta-AckA) pathway and determined the impact of these mutations on lrgAB expression. The Pta-AckA pathway consists of two enzymes: Pta catalyzes the conversion of acetyl-CoA into acetyl phosphate, while AckA converts acetyl phosphate into acetate and generates ATP during the reaction. It has been demonstrated in S. aureus that inactivation of the gene encoding Pta (pta) significantly decreased acetyl phosphate levels whereas inactivation of the gene encoding AckA (ackA) led to accumulation of intracellular acetyl phosphate pools compared to the wild-type strain (Sadykov et al., 2013). Using real-time RT PCR analysis to quantify lrgAB transcripts, we observed an approximately 10-fold increase in lrgAB transcripts in the ackA mutant (but no effect in the pta mutant) compared to the wild-type strain (Figure 3B), suggesting that increased acetyl phosphate pools can influence lrgAB transcription. The increase in lrgAB expression in the ackA mutant was dependent on LytSR, as an ackA-lytSR double mutant exhibited reduced expression compared to the wild-type strain. Moreover, when the acetyl phosphate levels were manipulated in the lytSTAA strain, we observed increased lrgAB expression (similar to those of the ackA mutant) in the ΔackA-lytSTAA strain and decreased expression in the Δpta-lytSTAA strain compared to wildtype. Overall, these data suggest that in addition to LytS-mediated signal transduction, the response regulator LytR can also be directly phosphorylated and activated by acetyl phosphate, resulting in the LytS-independent induction of lrgAB expression.
H390 is the site of LytS autophosphorylation
Upon signal recognition, sensor kinases autophosphorylate a conserved histidine residue and then act as a phosphodonor for their cognate response regulators. Through sequence alignment of the lytS gene from various bacteria, we identified one conserved histidine residue (His390) in the putative histidine phosphotransfer domain of LytS (data not shown). To test the importance of His390 in LytSR-mediated regulation, a mutation was introduced into the lytS gene on the S. aureus chromosome so that it would produce an altered LytS protein containing an alanine rather than histidine at position 390 (designated LytSH390A). We predicted that this mutation would lead to a sensor kinase that could not autophosphorylate, and in turn, could not activate LytR. Using an autophosphorylation assay, we confirmed that, unlike wild-type LytS-C, the LytS-CH390A protein was unable to autophosphorylate (Figure 4A). To test the effect of this mutation on lrgAB promoter activity, we again made use of the chromosomal lacZ reporter strain. Indeed, introduction of the lytSH390A mutation into this strain abolished lrgAB promoter activity and could be restored when wild-type lytS was expressed from a plasmid (Figure 4B), demonstrating that His390 is critical for LytS activity. Interestingly, these data are in contrast to the lytSTAA strain in which we observed increased lrgAB promoter activity (Figure 3A), suggesting that other functions of LytS modulate LytR phosphorylation. This observation led us to hypothesize that LytS, like many other sensor kinases (Laub & Goulian, 2007), contains a phosphatase activity that functions to maintain an optimal level of LytR activation, and that this activity is unaffected by the lytSH390A mutation.
Figure 4. Histidine 390 is the site of LytS phosphorylation.
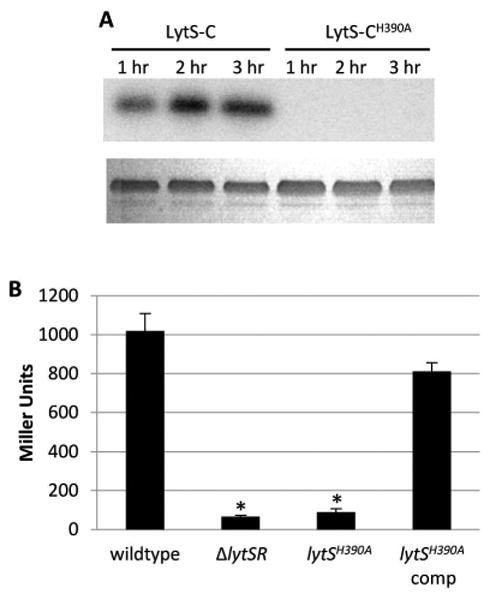
A. Autophosphorylation assays. Purified LytS-C and LytS-CH390A were incubated with [γ32P] ATP and samples were taken every hour for 3 hours, separated in a 12% SDS-PAGE gel, and radiolabeled proteins visualized using a phosphor imager. The lower panel is a Coomassie stained gel demonstrating equal loading of protein. B. β-galactosidase assays. Cultures of KB5019 (wildtype), KB5020 (ΔlytSR), KB5027 (lytSH390A), KB5027 (pML11) (lytS complement) were grown in TSB to late exponential phase, harvested, and the β-galactosidase activity (Miller Units) generated by the chromosomal PlrgAB-lacZ was measured. The data presented are the average of two biological replicates (n=2) with standard error of the mean indicated. A two-tailed Student T-test assuming equal variances was used to determine statistical significance compared to wildtype. *p<0.05
LytS exhibits phosphatase activity in vitro
To determine if LytS contains phosphatase activity important in the dephosphorylation of LytR, we performed an in vitro phosphatase assay. As shown in Figure 5A, this assay revealed the time-dependent dephosphorylation of phosphorylated LytR by both LytS-C and LytS-CH390A proteins. Recently, Willet and Kirby (2012) identified an asparagine residue involved in the phosphatase activity of CrdS of Myxcococcus xanthus that was located four amino acids downstream of the autophosphorylated histidine. Analysis of the LytS amino acid sequence revealed the presence of an asparagine in the same relative position, suggesting that this may be important for LytS phosphatase activity. To test this, a mutant derivative of LytS-C was generated in which Asn394 was replaced with an alanine (designated LytS-CN394A), and then assayed for phosphatase activity. In contrast to the LytS-C protein, LytS-CN394A was unable to dephosphorylate LytR (Figure 5A), suggesting that Asn394 was indeed important for the phosphatase activity of LytS. The LytS-CH390A protein also exhibited phosphatase activity but it appeared to be slightly reduced in comparison to the wild-type protein. We also generated a chromosomal version of this lytS mutation (lytSN394A) and examined the effects of this mutation on lrgAB promoter activity using the lrgAB-lacZ chromosomal reporter. Consistent with its role as a phosphatase that dephosphorylates (and inactivates) LytR, the lytSN394A mutation resulted in approximately four-times higher lrgAB promoter activity compared to the wild-type and complemented strains (Figure 5B), similar to the 5-fold increase in lrgAB promoter activity observed in our lytRD53E mutant, which encodes a constitutively-active LytR protein (Figure 1). Together, these data suggest that LytS is a bifunctional enzyme, with kinase and phosphatase activities, that coordinates the transcriptional output of LytSR signal transduction.
Figure 5. Alteration of asparagine 394 abolishes LytS phosphatase activity.
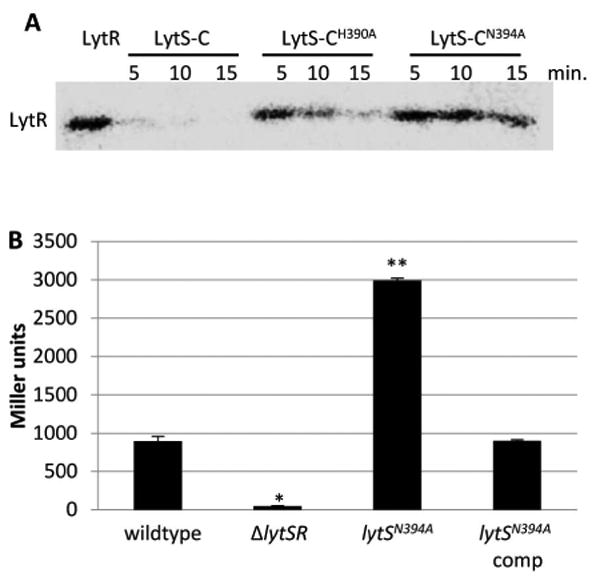
A. Phosphatase assays. Purified LytR-N was radiolabeled with [γ32P]AcP and mixed with equal molar amounts of LytS-C, LytS-CH390A, or LytS-CN394A. Samples were taken every 5 minutes, separated in a 15% SDS-PAGE gel and radiolabeled proteins visualized using a phosphor imager. Phosphatase activity is manifested as a reduction of LytR phosphorylation. B. β-galactosidase assays. Cultures of KB5019 (wildtype), KB5020 (ΔlytSR), KB5032 (lytSN394A), KB5032 (pML11) (lytS complement) were grown in TSB to late exponential phase, harvested, and the β-galactosidase activity (Miller Units) generated by the chromosomal PlrgAB-lacZ was measured. The data presented are the average of two biological replicates (n=2) with standard error of the mean indicated. A two-tailed Student T-test assuming equal variances was used to determine statistical significance compared to wildtype. *p<0.05, **p<0.005
CCCP-mediated induction of lrgAB promoter activity is dependent on LytS
The signal to which LytSR responds is unknown, but membrane potential dissipating agents such as CCCP and gramicidin have been shown to induce lrgAB expression in a LytSR-dependent manner (Patton et al., 2006, Muthaiyan et al., 2008, Sharma-Kuinkel et al., 2009). To determine if the induction of lrgAB promoter activity by CCCP is dependent on LytS signal transduction, we used the lytS mutant strains with the lrgAB-lacZ chromosomal reporter. In this assay, a lawn of each strain was swabbed to a sector of a TSA plate supplemented with 40 μg ml-1 5-bromo-4-chloro-3-indolyl-beta-D-galacto-pyranoside (X-gal) and then exposed to CCCP by the placement of a CCCP-saturated disk in the center of the plate. Thus, lrgAB promoter activity was detected by the appearance of blue color resulting from the hydrolysis of X-gal by β-galactosidase. As shown in Figure 6, basal levels of lrgAB promoter activity (as indicated by the presence of a pale blue color) was observed throughout the lawn produced by the wild-type strain, with a ring of induction by CCCP (intense blue) closest to the zone of growth inhibition. In contrast, the ΔlytSR strain did not produce color formation indicating the absence of, or greatly reduced basal and inducible lrgAB promoter activity. Similar to the experiments using planktonic cultures (Figure 3), the lytSTAA strain exhibited basal levels of lrgAB promoter activity throughout the lawn similar to the wild-type strain. However, in contrast to the wild-type strain, the lytSTAA mutant did not produce CCCP-inducible lrgAB promoter activity, consistent with the model that the effects of CCCP are sensed by LytS. In addition, as observed in planktonic cultures (Figures 4 and 5), no lrgAB promoter activity was detected in the in the lytSH390A mutant and increased activity was generated by lytSN394A mutant. Furthermore, a ring of induction by CCCP closest to the zone of growth inhibition was observed the lytSN394A mutant. Overall, these data are consistent with the findings of the planktonic growth studies and demonstrate that CCCP induction of lrgAB promoter activity is dependent on LytS-mediated activation of LytR.
Figure 6. CCCP induction of lrgAB expression is LytS-dependent.
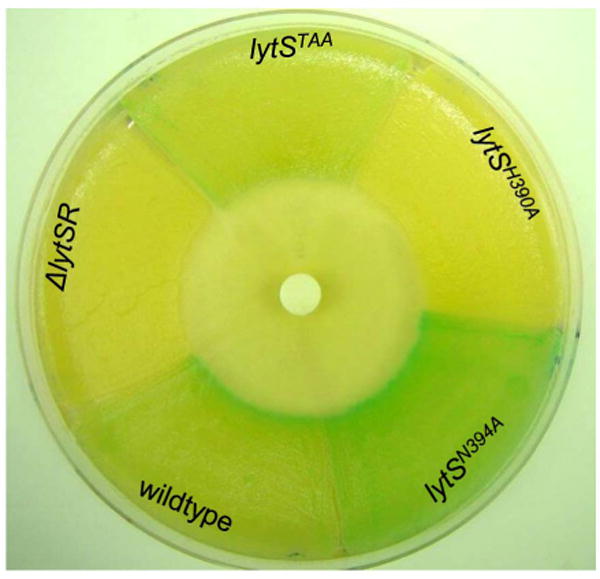
Lawns of KB5019 (wildtype), KB5020 (ΔlytSR), KB5024 (lytSTAA), KB5027 (lytSH390A), and KB5032 (lytSN394A) were spread into sectors on TSA containing 40 μg ml-1 X-gal. A blank disk infused with 10 μl of 50 μM CCCP was placed at the center of the plate. The blue color is indicative of β-galactosidase activity as expressed from the PlrgAB-lacZ chromosomal reporter. This image is representative of multiple independent experiments.
Effect of lytSR mutations on tower-specific lrgAB expression
Previous studies have shown that lrgAB expression is most prominently expressed in tower structures when grown under microfluidic flow-cell conditions (Moormeier et al., 2013). Considering that there appears to be a LytS-dependent and LytS-independent pathway to LytR activation, we used our mutants to gain a better understanding of the signaling pathways present in a developing biofilm. To accomplish this, we monitored a PlrgAB::dsRed promoter fusion construct during biofilm growth using the BioFlux microfluidics system. As anticipated, in the wild-type strain we observed high lrgAB promoter activity in the tower structures, with some lower level activity detected in the basal layer of the biofilm (Figure 7, Supplemental Video 1). In contrast to planktonic growth (Figure 3), we observed little to no lrgAB promoter activity in the lytSTAA strain (Supplemental Figure 3) during biofilm development, indicating that LytSR-mediated signal transduction is required for tower-specific lrgAB expression. Interestingly, a rare number of small towers formed by the lytSTAA mutant were found to still produce high lrgAB promoter activity, illustrating the heterogeneity of this phenotype. Additionally, we observed no lrgAB promoter activity in the lytSH390A mutant (Supplemental Figure 3), suggesting that LytS autophosphorylation is required for the activation of this promoter during biofilm development. Similarly, the ΔlytSR (Figure 7A), ΔlytR, and lytRD53A (Supplemental Figure 3) mutations all abolished lrgAB promoter activity but otherwise, did not have any observable effect on biofilm development. Finally, the lytSN394A and lytRD53E mutations resulted in LytR over-activation and, thus, constitutive lrgAB promoter activity (Figure 7A and Supplemental Videos 2 and 3).
Figure 7. Effect of lytSR mutations on biofilm formation.
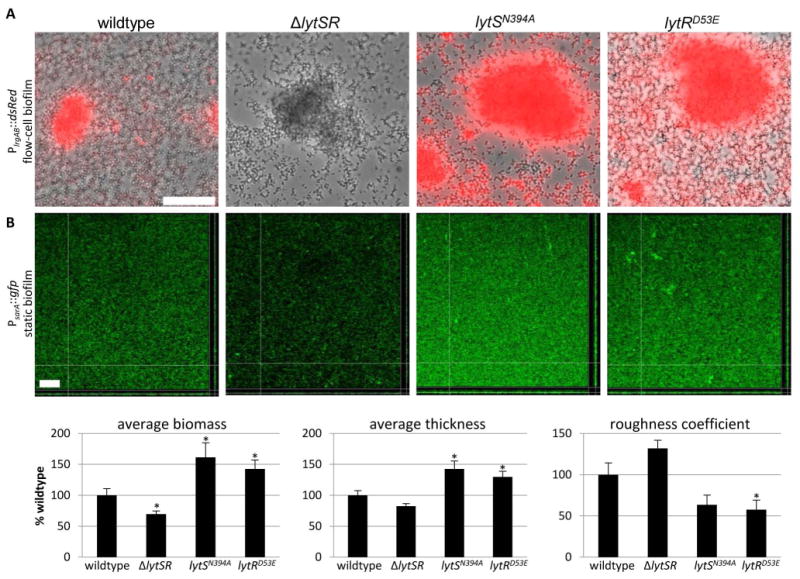
A. Biofilms were grown in 50% TSB under constant flow conditions using the BioFlux1000 microfluidic system for a total of 18 hours. Epifluorescence images of UAMS-1 (wildtype), KB5010 (ΔlytSR), KB5031 (lytSN394A) and KB5037 (lytRD53E) cells containing a PlrgAB::dsRed reporter construct (pDM4) were captured after approximately 13 hours of growth. The scale bar denotes 50 μm and the images presented are representative of three experimental replicates. B. Static biofilms grown in 50% TSB for 24 hours in glass chamber slides. Biofilms of UAMS-1 (wildtype), KB5010 (ΔlytSR), KB5031 (lytSN394A), and KB5037 (lytRD53E) containing a PsarA::gfp (constitutive gfp) reporter construct were imaged via confocal microscopy. COMSTAT analysis was used to quantify the average biomass, average thickness, and roughness coefficient. The scale bar denotes 50 μm and the images are representative of four experimental replicates. The data presented are the average of two experiments each with four biological replicates (n=8) with standard error of the mean indicated. *p<0.05
To determine if the over-activation of LytR had an effect on biofilm development, we performed static biofilm assays on strains constitutively expressing gfp and analyzed biofilm morphology using confocal laser scanning microscopy (CLSM) (Figure 7B). As shown in figure 7B, strains containing the lytSN394A and lytRD53E mutations produced biofilms with higher average biomass and thickness than wildtype (Figure 7B). In addition, COMSTAT analysis of the mutant biofilms revealed lower roughness coefficients compared to the wild-type biofilm, suggesting LytR over-activation affects biofilm development. In contrast, the ΔlytSR strain produced biofilms that had less average biomass and thickness, and a higher roughness coefficient, compared to the wild-type strain. Combined, these data demonstrate that LytR-mediated gene expression in tower structures occurs primarily through LytS signaling, and that this is important for normal biofilm development.
Discussion
The presence of heterogeneous gene expression during biofilm development provides compelling evidence for the existence of different microniches in which the bacteria reside. One mechanism bacteria utilize to sense and adapt to changing environments is mediated by TCSs. Expression of the lrgAB operon, which is controlled by the S. aureus LytSR TCS has been shown to be upregulated in tower structures during biofilm formation (Moormeier et al., 2013), indicating that the environmental cues inside the towers differ from those in the basal layer of the biofilm. To further our understanding of LytSR-mediated signal transduction, as well as to provide tools for the study of the physiological heterogeneity within biofilms, we made a series of point mutations affecting key functional amino acids within LytS and LytR. We also generated lrgAB transcription reporter constructs in which expression of reporter genes co-transcribed with the lrgAB operon on the S. aureus chromosome could be used as a convenient readout of LytSR activity. Using these tools, Asp53 of LytR was identified as the probable site of phosphorylation, and that phosphorylation at this site is likely required for LytR binding to the lrgAB promoter region. In addition, we confirmed that like many other sensor kinases, LytS is a bifunctional protein, with both kinase and phosphatase activities, suggesting that there is tight regulation of lrgAB expression.
The results of this study, which are consistent with studies of other TCSs (Galperin, 2010, Bourret, 2010, Gao & Stock, 2010), confirmed that phosphorylation of the response regulator, LytR, is necessary for LytSR-mediated gene expression. The predicted site of phosphorylation and activation of LytR, Asp53 (Brunskill & Bayles, 1996a), was shown to be important for LytR phosphorylation, binding to the lrgAB promoter region, and the induction of lrgAB transcription. In addition, substitution of Asp53 in LytR with glutamic acid, which has been shown to mimic the phosphorylation state of response regulators (Klose et al., 1993, Lan & Igo, 1998, Siam & Marczynski, 2003), resulted in constitutive activity during both planktonic and biofilm growth. We also noted that the LytRD53E protein binds to the lrgAB promoter in a different manner than the wild-type strain, resulting in a distinctly shifted banding pattern in EMSA experiments compared to the wild-type protein (Figure 2A), which caused a much more dramatic shift in the mobility of the lrgAB promoter fragments. These results suggest that wild-type LytR protein oligomerizes on the lrgAB promoter region, whereas LytRD53E associates with the lrgAB promoter, but in a less oligomerized form. Previously it has been shown that phosphorylation mediates the dimerization of the response regulator which then targets the specific DNA sequences (Toro-Roman et al., 2005, Gao et al., 2008, Gao & Stock, 2010). In addition, there is evidence that some response regulators dimerize prior to phosphorylation, with phosphorylation promoting oligomerization of multiple dimers (Doucleff et al., 2005, Batchelor et al., 2008). There is also evidence of response regulators that form heterodimers, comprised of one phosphorylated and one unphosphorylated monomer (Jeon et al., 2001, Creager-Allen et al., 2013). Therefore, it is possible that the LytRD53E variant, while active, has altered oligomerization and DNA-binding properties that are important in the induction of lrgAB transcription. More detailed protein interaction studies will be necessary to address this hypothesis.
Another finding of this study is that the phosphorylation of LytR can be mediated by both LytS-dependent and -independent mechanisms. Although the specific signal(s) to which LytSR responds is unknown, membrane dissipating agents and over-flow metabolism have been shown to induce lrgAB expression in a lytSR-dependent manner (Patton et al., 2006, Sharma-Kuinkel et al., 2009, Rice et al., 2005). It has been speculated that the increased acetyl phosphate pools produced during overflow metabolism may result in LytR phosphorylation independent of LytS (Rice & Bayles, 2008, Sadykov & Bayles, 2012). Consistent with this hypothesis, we observed increased lrgAB transcription (Figure 3B) when acetyl phosphate levels are high (as in the ΔackA lytSTAA mutant), and decreased lrgAB transcription when acetyl phosphate levels are low (as in the Δpta lytSTAA mutant). Although we did not observe a decrease in lrgAB transcription in the pta single mutant, it is likely that the presence of lytS suppressed the effect of the pta mutation on lrgAB transcription as a result of baseline signaling through the LytSR TCS. While the effects of acetyl phosphate on LytR activation are likely due to the phosphorylation of LytR at Asp53, it is also possible that the control of LytR activity is modulated by acetyl phosphate-dependent acetylation, similar to the control of RcsB in E. coli (Hu et al., 2013). Clearly, additional studies will be necessary to test this intriguing possibility. Regardless, the data generated in this study strongly suggest that the phosphatase activity of LytS determines the phosphorylation state of LytR, limiting phosphorylation by acetyl phosphate. In contrast to planktonic growth, we observed reduced lrgAB expression in a biofilm produced by the lytSTAA mutant strain compared to the wild-type strain. With this observation, we speculate that most lrgAB expression occurring during biofilm formation is a result of LytS-dependent mechanisms; therefore, only when the signal that LytS recognizes is present.
Although we noted that lrgAB expression during biofilm formation was primarily dependent on LytS, it was noted that a small fraction of the towers produced by the lytSTAA strain exhibited prominent lrgAB expression, suggesting that these cells have an altered signaling pathway leading to LytR cross-activation by other phosphodonors, and illustrating the metabolic heterogeneity of the towers within a biofilm. It has been well documented that biofilms are heterogeneous multicellular assemblies with different structural, chemical, metabolic, and environmental cues that alter the physiology of the cells (reviewed in (Stewart & Franklin, 2008)). Many of the environmental differences are due to the concentration gradients of solutes such as oxygen, nutrients, and metabolic by-products. However, it is unlikely that differences in environmental signals can explain the differential expression observed in different towers since they are all growing within, and exposed to the same growth medium. Indeed, this is reminiscent of the identification of different towers exhibiting differential expression of the cidABC promoter within the same field of a developing S. aureus biofilm, likely as a result of the differing metabolic environments associated with different tower structures (Moormeier et al, 2013). Similar to the conclusions of this study, we hypothesize that the differential lrgAB expression observed arises as a result of the distinct metabolic environments within different towers.
Previous reports indicate that lrgAB expression is important for biofilm formation, with the lrgAB mutant exhibiting increased static biofilm formation as well as eDNA release (Mann et al., 2009). In addition, a lytSR mutant displayed a similar phenotype, with increased static biofilm formation and eDNA release (Sharma-Kuinkel et al., 2009). In contrast, using a microfluidic system to observe gene expression during biofilm formation, we did not detect any differences in a lytSR (Figure 7) or lrgAB (Moormeier et al., 2013) mutant biofilms compared to the wild-type strain. Although lytS and lytR deletion mutations did not have a visible effect on biofilm structure under microfluidic conditions, we observed differences in average biomass, average thickness, and roughness under static conditions in the LytR overactive strains and the ΔlytSR strain compared to the wild-type strain (Figure 7B). These data suggest that LytSR-regulated genes play some role in biofilm formation. The differences in observed biofilm phenotypes is likely due to the differences in the conditions in which the biofilms are grown and the sensitivity of analyses. For example, the current studies utilized glass surfaces unlike the previous studies, which used plastic substrates with and without pretreatment, all conditions known to affect biofilm formation. The previously published static biofilm assays were grown in TSB-NaCl-Glc (3% NaCl, 0.5% glucose), whereas the current biofilms (both microfluidic and static) were grown in 50% TSB. It has been characterized that high salt levels enhance autolysis (Yabu & Kaneda, 1995) which may alter the biofilm phenotypes of the LytSR mutants. The CLSM and COMSTAT analysis of the static biofilms had much higher resolution than the previously performed static biofilm assays (Sharma-Kuinkel et al., 2009), resulting in clearer differences in biofilm formation by the LytSR-deficient strain and the LytR-overactive strains.
Previous studies have also demonstrated that lrgAB expression is induced by membrane potential dissipating agents (Patton et al., 2006, Muthaiyan et al., 2008, Sharma-Kuinkel et al., 2009). Consistent with these findings, we observed that lrgAB promoter activity was induced by CCCP at sub-MIC concentrations and that this expression is dependent on LytS signal transduction (Figure 6). The induction of lrgAB promoter activity as visualized on a plate suggests that there is a narrow window in which induction occurs, as there is not a broad gradient of induction, rather a distinct ring of promoter activity present in the lawn near the zone of growth inhibition. Considering the observation that mutations in the LytS sensor kinase abrogate lrgAB expression in tower structures, we hypothesize that a membrane potential-associated signal present within these structures is the inducing trigger. Although we do not know if LytS is a direct sensor of membrane potential, these findings provide important clues to the physiology of these structures that distinguish them from the surrounding cells not expressing lrgAB.
In conclusion, we have generated point mutations in the LytSR TCS to identify the amino acids important for signal transduction as well as to provide tools to assist in the characterization of the physiological heterogeneity occurring within a biofilm. The data from this study further underscores the metabolic diversity of biofilms and provides more clues to the regulation and response to different environmental signals within these environments. Overall, these data demonstrate that the chemical and metabolic cues recognized and integrated into LytSR signaling are important for fine-tuning the expression of the S. aureus lrgAB operon within a developing biofilm, and provide key clues that inform us about the complex metabolic heterogeneity that exists within these multicellular structures.
Experimental Procedures
Strains, plasmids, and growth conditions
Bacterial strains and plasmids used in this study are described in Table 1. All bacteria were cultured at 37°C with shaking at 250 rpm. Escherichia coli cultures were grown in Luria Broth (LB) in the presence of ampicillin (100 μg ml-1), spectinomycin (100 μg ml-1), or kanamycin (50 μg ml-1) for selection of plasmid-based markers. S. aureus cultures were grown in TSB in the presence of erythromycin (5 μg ml-1) or chloramphenicol (10 μg ml-1) as needed. Chemicals were purchased from Sigma Aldrich (St. Louis, MO), EMD Chemical Inc. (Gibbstown, NJ), or Becton, Dickinson, and Company (Sparks, MD).
Table 1.
Select bacterial strains and plasmids used in this study
| Bacterial Strains | ||
|---|---|---|
| E. coli | ||
| DH5α | Host strain for construction of recombinant plasmids | (Hanahan, 1983) |
| BL21 (DE3) | Protein over expression strain | Invitrogen |
| Rosetta II | BL21 (DE3) derivative for expression of proteins that use rare codons | Invitrogen |
| S. aureus | ||
| RN4220 | Highly transformable restriction-deficient strain | (Kreiswirth et al., 1983) |
| UAMS-1 | wildtype osteomyelitis isolate | (Gillaspy et al., 1995) |
| KB5010 | UAMS-1 ΔlytSR | This study |
| KB5012 | UAMS-1 ΔlytR | This study |
| KB5014 | UAMS-1 lytSTAA | This study |
| KB5017 | UAMS-1 lytSH390A | This study |
| KB5031 | UAMS-1 lytSN394A | This study |
| KB5035 | UAMS-1 lytRD53A | This study |
| KB5037 | UAMS-1 lytRD53E | This study |
| KB5019 | UAMS-1 lrgAB-lacZ reporter strain | This study |
| KB5020 | UAMS-1 ΔlytSR with lrgAB-lacZ reporter | This study |
| KB5022 | UAMS-1 ΔlytR with lrgAB-lacZ reporter | This study |
| KB5024 | UAMS-1 lytSTAA with lrgAB-lacZ reporter | This study |
| KB5027 | UAMS-1 lytSH390A with lrgAB-lacZ reporter | This study |
| KB5032 | UAMS-1 lytSN394A with lrgAB-lacZ reporter | This study |
| KB5036 | UAMS-1 lytRD53A with lrgAB-lacZ reporter | This study |
| KB5038 | UAMS-1 lytRD53E with lrgAB-lacZ reporter | This study |
| KB5046 | UAMS-1 Δpta, ΔlytSR | This study |
| KB5047 | UAMS-1 Δpta, lytSTAA | This study |
| KB5050 | UAMS-1 ΔackA::ermB, ΔlytSR; Emr | This study |
| KB5051 | UAMS-1 ΔackA::ermB, lytSTAA; Emr | This study |
| KB8000 | UAMS-1 ΔackA::ermB; Emr | (Sadykov et al., 2013) |
| KB8001 | UAMS-1Δpta | (Sadykov et al., 2013) |
| Plasmids | ||
| pDM4 | lrgAB promoter::sDsRed, cidABC promoter::sGFP | (Moormeier et al., 2013) |
| pCM29 | sarA promoter::sGFP | (Pang et al., 2010) |
| pJB38 | Temperature-sensitive allelic exchange plasmid | (Bose et al., 2013) |
| pJB39 | UAMS-1 lrgAB-reporter integration plasmid | This study |
| pCL52.2 | Temperature-sensitive cloning vector | (Sau et al., 1997) |
| pCN51 | Cadmium-inducible S. aureus expression plasmid | (Charpentier et al., 2004) |
| pML3 | UAMS-1 ΔlytR allelic exchange plasmid | This study |
| pML10 | UAMS-1 lrgAB-lacZ integration plasmid | This study |
| pML11 | UAMS-1 lytS complement plasmid | This study |
| pML15 | UAMS-1 ΔlytSR allelic exchange plasmid | This study |
| pML36 | UAMS-1 lytSTAA allelic exchange plasmid | This study |
| pML38 | UAMS-1 lytSH390A allelic exchange plasmid | This study |
| pML42 | LytS-C expression plasmid | This study |
| pML44 | LytS-CH390A expression plasmid | This study |
| pML47 | UAMS-1 lytSN394A allelic exchange plasmid | This study |
| pML60 | UAMS-1 lytRD53A allelic exchange plasmid | This study |
| pML61 | UAMS-1 lytRD53E allelic exchange plasmid | This study |
| pML62 | LytS-CN394A expression plasmid | This study |
| pML75 | LytR-N expression plasmid | This study |
| pML76 | LytR-ND53A expression plasmid | This study |
| pML74 | UAMS-1 lytR complement plasmid | This study |
| pJB127 | Insertless complement plasmid | This study |
| pBK9 | LytR expression plasmid | This study |
| pBK10 | LytRD53A expression plasmid | This study |
| pBK11 | LytRD53E expression plasmid | This study |
Molecular genetic techniques
DNA fragments were PCR amplified using KOD DNA polymerase (Novagen, Madison, WI) and oligonucleotides (Supplemental Table 2) synthesized by Integrated DNA Technologies (Coralville, IA) or the Eppley Molecular Biology Core Lab (University of Nebraska Medical Center, Omaha, NE). DNA was digested and ligated using restriction endonucleases and ligase obtained from New England Biolabs (Beverly, MA) or Monserate Biotechnology Group (San Diego, CA). Purification of DNA fragments prior to subsequent cloning steps was achieved by recovery from an agarose gel using a DNA Clean and Concentrator-5 Kit (Zymo Research, Orange, CA). Recombinant plasmids were purified using a Wizard Plus SV Minipreps DNA purification system (Promega Corporation, Madison, WI). All plasmid inserts were sequenced at the High-Throughput DNA Sequencing and Genotyping Core Facility (University of Nebraska Medical Center, Omaha, NE) to ensure the absence of mutations.
To construct the allelic exchange plasmids for chromosomal point mutations, the lytSR operon was first cloned into the plasmid, pCR-Blunt (Life Technologies, Grand Island, NY), which was subsequently used as a template for PCR using 5′ phosphorylated primers that contained the desired nucleotide change and were oriented such that they amplified the entire plasmid. The PCR products were treated with T4 DNA ligase to promote intramolecular ligation, and then digested with DpnI to eliminate any methylated template plasmid prior to transformation into E. coli DH5α. After the point mutations were confirmed in the plasmid by DNA sequencing, the lytSR fragment was removed from the pCR-Blunt backbone and ligated into the temperature-sensitive E. coli-S. aureus shuttle vector, pJB38. Once in pJB38, allelic replacement to introduce the point mutations into the S. aureus chromosome was performed as previously described (Bose et al., 2012). Deletion mutations were constructed essentially as described by (Bose et al., 2012) resulting in the replacement of the lytSR and lytR coding sequences with BamHI sites.
To examine lrgAB expression in the context of the chromosome, a chromosomally-encoded lacZ reporter was engineered by placing the lacZ gene in the lrgAB operon downstream of lrgB. Approximately 1 kb of DNA directly downstream of lrgB was amplified and engineered to encode a 5′ XhoI site. Additionally, 1 kb of DNA spanning the lrgAB operon was amplified and engineered to encode a 3′ XhoI site at the end of the lrgAB operon. The two PCR fragments were digested and sequentially ligated into pCL52.2, generating the plasmid pJB39 which has a unique XhoI site for cloning genes downstream of lrgAB. Next, the lacZ gene with the TIR RBS (Bose et al., 2013) was cloned into the XhoI site of pJB39 to create pML10, which was subsequently used to integrate the lacZ gene downstream of the lrgAB operon by allelic exchange as described by Bose et al. (2012). Importantly, all of the lytSR mutants generated in this study, as well as the chromosomal PlrgAB::lacZ construct, exhibited growth rates similar to the parent strain (Supplemental Figure 4).
Complement plasmids were generated using the native promoter of the mutated gene to drive expression. In the case of the lytS complement plasmid, the UAMS-1 lytS gene was PCR amplified and cloned into the plasmid, pJB127 (a pCN51 (Charpentier et al., 2004) derivative lacking Pcad), yielding pML11. For LytR complementation, genomic DNA from KB5014 (containing the lytSTAA allele) was used as the template for PCR resulting in the amplification of the entire mutated lytSR operon encoding a truncated lytS gene. In this case, the mutant lytSR gene was cloned into pJB127 to produce pML74, which encodes a non-functional and truncated LytS protein, but an unaltered LytR, thus, ensuring that lytR expression was under the control of its native promoter.
β-galactosidase assays
Overnight cultures were diluted to an OD600 of 0.1 in 12.5 ml TSB supplemented with erythromycin in a 125-ml flask. One ml of cells was centrifuged and the cell pellet was resuspended in 1.2 ml Z-buffer (60 mM Na2HPO4, 40 mM NaH2PO4, 10 mM KCl, 1 mM MgSO4, 50 mM β-mercaptoethanol, pH 7.0) and disrupted using a FastPrep FP120 (MP Biomedicals, Santa Ana, California). Cellular debris was pelleted by centrifugation for 5 minutes at maximum speed using a Spectrafuge 24D Digital Microcentrifuge (Labnet International, Edison, NJ). Seven hundred μl of the supernatant was transferred to a 1.5 ml microcentrifuge tube and 140 μl of ONPG (4 mg ml-1 (w/v)) was added. The samples were incubated at 37°C until they turned slightly yellow (under OD420 1.0). To stop the reactions, 200 μl of 1 M sodium carbonate was added. The samples were centrifuged for 30 seconds at maximum speed to remove any remaining cellular debris, and the OD420 was measured. Protein concentrations were determined by performing Bradford Assays using the Protein Assay Dye Solution (Bio-Rad, Hercules, California). Miller units were calculated using protein concentration instead of OD600 as previously described (Haskell et al., 2003).
Protein purification of truncated LytS and LytR
To examine the biochemical activities associated with the transmitter domain of LytS, we expressed and purified only the cytoplasmic portion of LytS (amino acids 212-584), which we designated LytS-C. Overnight cultures of E. coli BL21 cells containing the LytS-C, LytS-CH390A, and LytS-CN394A overexpression plasmids (pML42, pML44, and pML62) were diluted to an OD600 of 0.1 in 100 ml LB (kanamycin 50 mg ml-1) in a 500 ml flask. Cultures were grown to an OD600 between 0.6 and 1.0 at 37°C, with shaking at 250 rpm prior to induction with 1 mM IPTG (Life Technologies Corporation, Carlsbad, CA). After induction, the cultures were incubated at 16°C with shaking at 250 rpm for 18 hours. These cultures were centrifuged and cell pellets were frozen at -20°C.
Overexpression of the LytR receiver domain (amino acids 1-134), designated LytR-N, was performed as outlined by Shala et al. (2013). Briefly, overnight cultures of E. coli Rosetta II cells containing the LytR-N and LytR-ND53A overexpression plasmids (pML75 and pML76) were diluted to an OD600 of 0.1 in 100 ml LB (kanamycin 50 mg ml-1) in a 500 ml flask. Cultures were grown to an OD600 between 0.6 and 1.0 at 37°C, 250 rpm. The culture was cooled to 4°C, prior to induction with 0.5 M IPTG at 25°C with shaking at 250 rpm for 18 hours. The cultures were centrifuged and the cell pellets frozen at -20°C.
The frozen pellets from above were resuspended in BugBuster solution (EMD Millipore, Billerica, MA) supplemented with 1x EDTA-free cOmplete Mini protease inhibitor (Roche, Basel, Switzerland) and Benzonase (EMD Millipore, Billerica, MA) to degrade any DNA present. The cells lysates were centrifuged at 4°C and supernatants collected and prepared for application to a His-Cobalt column (Thermo Fisher Scientific, Waltham, MA) for purification following the manufacturer's instructions. After elution, salts were removed using Microcon-10 centrifuge spin tubes (EMD Millipore, Billerica, MA). Concentrated proteins were resuspended in kinase buffer (10 mM Hepes-KOH, pH 8.0, 50 mM KCl, 10% glycerol, 0.1 mM EDTA, 1 mM DTT) for subsequent biochemical analyses. Final preparations of LytS-C and LytR-N (and mutant derivatives) were analyzed by SDS-PAGE and estimated to be between 80-90% pure.
In vitro biochemical assays
Autokinase, phosphotransfer, and phosphatase assays were performed as described previously (Willett & Kirby, 2011). For the initial autokinase assays, 20 μg of LytS-C preparation was incubated with 5 mM MgCl2, 2 mM DTT and kinase buffer (10mM Hepes-KOH, pH 8.0, 50 mM KCl, 10% glycerol, 0.1 mM EDTA, 1 mM DTT) to a final volume of 90 μl. Five μM ATP and 5 μCi [γ32P] ATP were added to the autokinase reaction and incubated for 2.75 hours with 6 μl samples taken every 15 minutes and mixed with 3 μl of 3x SDS loading buffer (New England Biolabs, Beverly, MA) to stop the reaction. The proteins were separated in a 12% SDS-PAGE gel and the labeled proteins were detected using a Typhoon FLA 7000 Imager (GE Healthcare, Little Chalfont, United Kingdom). For the autokinase assay to identify the site of LytS phosphorylation, 4.5 μg LytS-C and LytS-CH390A preparations were incubated with 5 mM MgCl2, 2 mM DTT, and kinase buffer to a final volume of 50 μl. Five μM ATP and 5 μCi [γ32P] ATP were added to the autokinase reaction and incubated for 3 hours with 15 μl samples taken every hour and mixed with 7.5 μl of 3x SDS loading buffer to stop the reaction. The proteins were separated and detected as above. A separate gel with equal volumes of protein was stained with Coomassie stain to demonstrate equal loading.
For the phosphotransfer assays, wild-type LytS-C was autophosphorylated as described above using 15 μg of LytS-C preparation per reaction, for 1.5 hours at room temperature. LytR-N proteins were prepared by mixing 33 μg LytR-N per reaction with 5 mM MgCl2 and kinase buffer. To start the phosphotransfer reaction, 15 μg of the autophosphorylated LytS-C reaction was mixed with 33 μg of LytR-N preparation. Samples were taken after 15 seconds and analyzed in a 15% SDS-PAGE gel. Labeled proteins were detected using a Typhoon FLA 7000. Phosphotransfer was evident as a shift in phosphorylation from LytS-C to LytR-N. In control experiments, LytR-N (33 μg) was incubated with 5 μCi [γ32P]-ATP in kinase buffer to 20 μl.
For the phosphatase assay, radiolabeled acetyl phosphate ([γ32P]AcP) was generated by incubating 0.3 units of acetate kinase (Sigma-Aldrich, St. Louis, MO), 5 μCi [γ32P] ATP, and 91 μl TKM-Buffer (25 mM Tris-HCl [pH 7.4], 60 mM potassium acetate, 10 mM MgCl2; final pH 7.6) at room temperature for 20 minutes. [γ32P]AcP was collected by filtration through a Microcon-10 microconcentrator (10,000 MW cut-off, with [γ32P]AcP in the flow-through) and used to phosphorylate wild-type LytR-N by mixing an equal volume (110 μl) of [γ32P]AcP and LytR-N (342 μg) and incubating at room temperature for 30 minutes. To wash away excess [γ32P]AcP, the reaction was passed through Microcon-10 microconcentrator (10,000 MW cut-off) and washed with kinase buffer supplemented with 5 mM MgCl2. 102 μg of this phosphorylated LytR-N preparation was incubated with 90 μg LytS-C, LytS-CH394A, or LytS-CN394A in kinase buffer at room temperature. Reactions were stopped every 5 minutes by adding a 50% volume of 3x SDS buffer and labeled proteins were analyzed by SDS-PAGE and visualized as described above.
Electrophoretic mobility shift assay (EMSA)
For purification of LytR, LytRD53A, and LytRD53E, E. coli BL21 cells containing LytR protein overexpression plasmids (pBK9, pBK10, and pBK11) were diluted to an OD600 of 0.1 in 250 ml LB (kanamycin 50 mg ml-1) and grown for 4 hours at 37°C. Protein production was induced by the addition of 0.1 mM IPTG and grown at 28°C for 2 hours. Cultures were centrifuged and the pellets were stored at -20°C. Cell pellets were homogenized in 6 ml of lysis buffer (20 mM Tris, pH8.0, 0.5 M NaCl, 3 mM 2-mercaptoethanol, and 10 mM imidazole), followed by sonication of the culture. Lysed cells were pelleted, and the supernatant was mixed with a 0.5 ml (bed volume) of Ni NTA (Qiagen, Germantown, Maryland), loaded into an elution column, and washed with lysis buffer containing 20 mM imidazole. Finally, the protein was eluted with 250 mM imidazole, dialyzed against 20 mM Tris-Cl, pH 7.5, 100 mM NaCl, 5 mM MgCl2, 1 mM DTT, and 10% glycerol, concentrated, and stored at -20°C.
EMSAs were carried out essentially as described previously (Biswas & Biswas, 2006). Briefly, primers plrgAB-Fwd and plrgAB-Rvs (Supporting Information Table S2) were used to amplify a DNA fragment containing the 320-bp promoter region of lrgAB using S. aureus UAMS-1 genomic DNA. Initially, 100 μmoles of the plrgAB-Rvs were labeled with T4 polynucleotide kinase (New England Biolabs, Beverly, MA) in a reaction mixture containing 3 μl of [γ32P] ATP in a final volume of 50 μl for 45 minutes at 37°C. The labeled primer was passed through Biorad's Microbiospin 30 column (Biorad, Hercules, CA) to eliminate unincorporated [γ32P] ATP. The labeled primer was used in PCR with unlabeled plrgAB-Fwd. The PCR generated radiolabeled fragments (∼320 bp) were purified by passing through Biorad's Microbiospin 30 column to eliminate unincorporated [γ32P] ATP. The labeled PCR fragment (0.25 pmole) was incubated with increasing concentrations (0, 1.8, 3.6, 5.4, 7.2, and 9.0 pmol) of LytR, LytRD53A, and LytRD53E in binding buffer (50 mM NaPO4, pH6.5, 50 mM NaCl, 1 mM MgCl2, 1 mM CaCl2, 1 mM DTT, 2 μg ml-1 poly (dI-dC), and 10% glycerol). Each binding reaction was performed in a 40 μl volume, and incubated at room temperature for 30 minutes. After incubation, the samples were loaded into a 4.0% native acrylamide gel containing 50 mM NaPO4 buffer (pH 6.5) and 4% glycerol. The gel was dried and analyzed using a Storm Scanner (GE Healthcare, Piscataway, NJ) following exposure of the dried gel to a phosphor imager screen.
Real-time RT PCR
Overnight cultures were resuspended to an OD600 of 0.1 in 25 ml of TSB in a 250 ml flask. Cultures were grown for 6 hours at 37° C, shaking at 250 rpm. Five milliliters of culture was spun down, the pellet was resuspended in 1 ml RNAprotect (Qiagen, Venlo, Limburg), and incubated at room temperature for 1 hour. The suspension was spun down and the cell pellets frozen at -20° C. The cell pellets were resuspended in RLT buffer and disrupted using a FastPrep FP120 instrument (Thermo Scientific). RNA was isolated and purified using the RNeasy Mini Kit (Qiagen, Venlo, Limburg) as directed my manufacturer's instructions. 500 nanograms of total RNA was converted into cDNA using the QuantiTect Reverse Transcription Kit (Qiagen, Venlo, Limburg). The cDNA was diluted 1:50, and 10 μl was mixed with 2 μl gene specific primer (5 μM each) (Supplemental Table 2), 8 μl water, and 20 μl LightCycler 480 Sybr green I master mix (Roche). The samples were equally split into two wells of a white 96-well conical plate and real-time PCR was performed using a Roche LightCycler 480 instrument II. The values of the two wells were averaged and used for analysis. Transcript levels for lrgAB were normalized to transcript levels for sigA and reported as a fold change as compared to wild-type. The data presented is the average of independently-grown replicates.
CCCP plate assay
Bacteria from overnight agar plates were resuspended in a 0.85% NaCl solution to an OD600 of 0.5. The cells were swabbed onto a TSA plate supplemented with 40 μg ml-1 X-gal into their respective sectors using sterile cotton swabs. At the center of the plate, a blank paper disk was placed and infused with 10 μl of 50 μM CCCP. The plates were grown overnight at 37° C and imaged the following day.
BioFlux1000 biofilm assays
To monitor biofilm development, a BioFlux1000 microfluidic system (Fluxion Biosciences Inc., San Francisco, CA) was used as described previously (Moormeier et al., 2013) with slight modifications. Briefly, the channels were first primed by pumping 200 μl of TSB from the output wells into the input wells for 5 minutes at 5.0 dyn/cm2. Once primed, excess TSB was aspirated from the output wells and replaced with 200 μl of overnight cultures adjusted to an OD600 of 0.8 in TSB. To limit gravity flow during the adherence incubation, 300 μl of 50% TSB (v/v) was added to the input wells. The adjusted inocula were then seeded in the channels by pumping at 2.0 dyn/cm2 for 5 seconds and allowing the cells to adhere to bottom of channels for 1 hour at 37°C. After adherence, excess inocula were carefully removed by aspiration and an additional 1 ml of 50% TSB was added to the input wells and media flowed over the cells at 0.6 dyn/cm2 (64 μl/hr) for 18 hours at 37°C. Brightfield and epifluorescence images were acquired at 5 min intervals (217 time points) at 200x magnification. Gain and exposure settings (FITC; gain: 5, exposure: 500 ms and TRITC; gain: 10, exposure: 600ms) were kept consistent for all images. Images and videos were rendered using BioFlux Montage software.
Static biofilm assays
Overnight cultures were resuspended to an OD600 of 0.05 in 50% TSB. Subsequently, 200 μl of each inoculum was placed in one well of an eight-chamber Lab-Tek chambered number 1.0 borosilicate coverglass system (Nunc, Rochester, NY) in quadruplicate. Biofilms were grown for 24 hours and washed two times with 100 μl PBS. Three individual images for each well were imaged on a Zeiss 510 Meta CLSM with a Plan-Apochromat 20x0.8 objective. GFP was excited with an argon laser at 488nm and the emission band-pass filter used was 505±45 nm. Z-stacks were collected at 1.0 μm intervals. The images were rendered with the Imaris 7.0.0 software suite (Bitplane, Saint Paul, MN). COMSTAT (Heydorn et al., 2000) was utilized to quantify the average biomass, average thickness, and roughness coefficient of the biofilms.
Supplementary Material
Acknowledgments
This work was supported by National Institutes of Health grants R01-AI038901 and PO1-AI83211 (to K.W.B.) and UNMC Emley Assistantship/Fellowship and Dr. Fred W. Upson Grant-in-Aid Scholarship (to M.K.L).
References
- Ahn SJ, Qu MD, Roberts E, Burne RA, Rice KC. Identification of the Streptococcus mutans LytST two-component regulon reveals its contribution to oxidative stress tolerance. Bmc Microbiol. 2012;12:187. doi: 10.1186/1471-2180-12-187. [DOI] [PMC free article] [PubMed] [Google Scholar]
- Batchelor JD, Doucleff M, Lee CJ, Matsubara K, De Carlo S, Heideker J, Lamers MH, Pelton JG, Wemmer DE. Structure and regulatory mechanism of Aquifex aeolicus NtrC4: variability and evolution in bacterial transcriptional regulation. Journal of molecular biology. 2008;384:1058–1075. doi: 10.1016/j.jmb.2008.10.024. [DOI] [PubMed] [Google Scholar]
- Biswas S, Biswas I. Regulation of the glucosyltransferase gtfBC operon by CovR in Streptococcus mutans. J Bacteriol. 2006;188:988–998. doi: 10.1128/JB.188.3.988-998.2006. [DOI] [PMC free article] [PubMed] [Google Scholar]
- Bose JL, Fey PD, Bayles KW. Genetic tools to enhance the study of gene function and regulation in Staphylococcus aureus. Applied and environmental microbiology. 2013;79:2218–2224. doi: 10.1128/AEM.00136-13. [DOI] [PMC free article] [PubMed] [Google Scholar]
- Bose JL, Lehman MK, Fey PD, Bayles KW. Contribution of the Staphylococcus aureus Atl AM and GL murein hydrolase activities in cell division, autolysis, and biofilm formation. Plos One. 2012;7:e42244. doi: 10.1371/journal.pone.0042244. [DOI] [PMC free article] [PubMed] [Google Scholar]
- Boucher H, Miller LG, Razonable RR. Serious infections caused by methicillin-resistant Staphylococcus aureus. Clinical infectious diseases : an official publication of the Infectious Diseases Society of America. 2010;51(Suppl 2):S183–197. doi: 10.1086/653519. [DOI] [PubMed] [Google Scholar]
- Bourret RB. Receiver domain structure and function in response regulator proteins. Current opinion in microbiology. 2010;13:142–149. doi: 10.1016/j.mib.2010.01.015. [DOI] [PMC free article] [PubMed] [Google Scholar]
- Brown AF, Leech JM, Rogers TR, McLoughlin RM. Colonization: Modulation of Host Immune Response and Impact on Human Vaccine Design. Frontiers in immunology. 2014;4:507. doi: 10.3389/fimmu.2013.00507. [DOI] [PMC free article] [PubMed] [Google Scholar]
- Brunskill EW, Bayles KW. Identification and molecular characterization of a putative regulatory locus that affects autolysis in Staphylococcus aureus. Journal of Bacteriology. 1996a;178:611–618. doi: 10.1128/jb.178.3.611-618.1996. [DOI] [PMC free article] [PubMed] [Google Scholar]
- Brunskill EW, Bayles KW. Identification of LytSR-regulated genes from Staphylococcus aureus. Journal of Bacteriology. 1996b;178:5810–5812. doi: 10.1128/jb.178.19.5810-5812.1996. [DOI] [PMC free article] [PubMed] [Google Scholar]
- Capra EJ, Laub MT. Evolution of two-component signal transduction systems. Annual review of microbiology. 2012;66:325–347. doi: 10.1146/annurev-micro-092611-150039. [DOI] [PMC free article] [PubMed] [Google Scholar]
- Chandramohan L, Ahn JS, Weaver KE, Bayles KW. An overlap between the control of programmed cell death in Bacillus anthracis and sporulation. J Bacteriol. 2009;191:4103–4110. doi: 10.1128/JB.00314-09. [DOI] [PMC free article] [PubMed] [Google Scholar]
- Charpentier E, Anton AI, Barry P, Alfonso B, Fang Y, Novick RP. Novel cassette-based shuttle vector system for gram-positive bacteria. Applied and environmental microbiology. 2004;70:6076–6085. doi: 10.1128/AEM.70.10.6076-6085.2004. [DOI] [PMC free article] [PubMed] [Google Scholar]
- Costerton JW, Stewart PS, Greenberg EP. Bacterial biofilms: A common cause of persistent infections. Science. 1999;284:1318–1322. doi: 10.1126/science.284.5418.1318. [DOI] [PubMed] [Google Scholar]
- Creager-Allen RL, Silversmith RE, Bourret RB. A link between dimerization and autophosphorylation of the response regulator PhoB. The Journal of biological chemistry. 2013;288:21755–21769. doi: 10.1074/jbc.M113.471763. [DOI] [PMC free article] [PubMed] [Google Scholar]
- Doucleff M, Chen B, Maris AE, Wemmer DE, Kondrashkina E, Nixon BT. Negative regulation of AAA + ATPase assembly by two component receiver domains: a transcription activation mechanism that is conserved in mesophilic and extremely hyperthermophilic bacteria. Journal of molecular biology. 2005;353:242–255. doi: 10.1016/j.jmb.2005.08.003. [DOI] [PubMed] [Google Scholar]
- Fey PD. Modality of bacterial growth presents unique targets: how do we treat biofilm-mediated infections? Current opinion in microbiology. 2010;13:610–615. doi: 10.1016/j.mib.2010.09.007. [DOI] [PMC free article] [PubMed] [Google Scholar]
- Fowler VG, Jr, Miro JM, Hoen B, Cabell CH, Abrutyn E, Rubinstein E, Corey GR, Spelman D, Bradley SF, Barsic B, Pappas PA, Anstrom KJ, Wray D, Fortes CQ, Anguera I, Athan E, Jones P, van der Meer JT, Elliott TS, Levine DP, Bayer AS. Staphylococcus aureus endocarditis: a consequence of medical progress. JAMA : the journal of the American Medical Association. 2005;293:3012–3021. doi: 10.1001/jama.293.24.3012. [DOI] [PubMed] [Google Scholar]
- Galperin MY. Diversity of structure and function of response regulator output domains. Current opinion in microbiology. 2010;13:150–159. doi: 10.1016/j.mib.2010.01.005. [DOI] [PMC free article] [PubMed] [Google Scholar]
- Gao R, Stock AM. Biological insights from structures of two-component proteins. Annual review of microbiology. 2009;63:133–154. doi: 10.1146/annurev.micro.091208.073214. [DOI] [PMC free article] [PubMed] [Google Scholar]
- Gao R, Stock AM. Molecular strategies for phosphorylation-mediated regulation of response regulator activity. Current opinion in microbiology. 2010;13:160–167. doi: 10.1016/j.mib.2009.12.009. [DOI] [PMC free article] [PubMed] [Google Scholar]
- Gao R, Tao Y, Stock AM. System-level mapping of Escherichia coli response regulator dimerization with FRET hybrids. Molecular microbiology. 2008;69:1358–1372. doi: 10.1111/j.1365-2958.2008.06355.x. [DOI] [PMC free article] [PubMed] [Google Scholar]
- Gillaspy AF, Hickmon SG, Skinner RA, Thomas JR, Nelson CL, Smeltzer MS. Role of the accessory gene regulator agr in pathogenesis of staphylococcal osteomyelitis. Infect Immun. 1995;63:3373–3380. doi: 10.1128/iai.63.9.3373-3380.1995. [DOI] [PMC free article] [PubMed] [Google Scholar]
- Hanahan D. Studies on transformation of Escherichia coli with plasmids. Journal of molecular biology. 1983;166:557–580. doi: 10.1016/s0022-2836(83)80284-8. [DOI] [PubMed] [Google Scholar]
- Haskell RE, Hughes SM, Chiorini JA, Alisky JM, Davidson BL. Viral-mediated delivery of the late-infantile neuronal ceroid lipofuscinosis gene, TPP-I to the mouse central nervous system. Gene therapy. 2003;10:34–42. doi: 10.1038/sj.gt.3301843. [DOI] [PubMed] [Google Scholar]
- Heydorn A, Nielsen AT, Hentzer M, Sternberg C, Givskov M, Ersboll BK, Molin S. Quantification of biofilm structures by the novel computer program COMSTAT. Microbiology. 2000;146(Pt 10):2395–2407. doi: 10.1099/00221287-146-10-2395. [DOI] [PubMed] [Google Scholar]
- Hu LI, Chi BK, Kuhn ML, Filippova EV, Walker-Peddakotla AJ, Basell K, Becher D, Anderson WF, Antelmann H, Wolfe AJ. Acetylation of the response regulator RcsB controls transcription from a small RNA promoter. J Bacteriol. 2013;195:4174–4186. doi: 10.1128/JB.00383-13. [DOI] [PMC free article] [PubMed] [Google Scholar]
- Jeon Y, Lee YS, Han JS, Kim JB, Hwang DS. Multimerization of phosphorylated and non-phosphorylated ArcA is necessary for the response regulator function of the Arc two-component signal transduction system. The Journal of biological chemistry. 2001;276:40873–40879. doi: 10.1074/jbc.M104855200. [DOI] [PubMed] [Google Scholar]
- Klose KE, Weiss DS, Kustu S. Glutamate at the site of phosphorylation of nitrogen-regulatory protein NTRC mimics aspartyl-phosphate and activates the protein. Journal of molecular biology. 1993;232:67–78. doi: 10.1006/jmbi.1993.1370. [DOI] [PubMed] [Google Scholar]
- Kreiswirth BN, Lofdahl S, Betley MJ, O'Reilly M, Schlievert PM, Bergdoll MS, Novick RP. The toxic shock syndrome exotoxin structural gene is not detectably transmitted by a prophage. Nature. 1983;305:709–712. doi: 10.1038/305709a0. [DOI] [PubMed] [Google Scholar]
- Lan CY, Igo MM. Differential expression of the OmpF and OmpC porin proteins in Escherichia coli K-12 depends upon the level of active OmpR. J Bacteriol. 1998;180:171–174. doi: 10.1128/jb.180.1.171-174.1998. [DOI] [PMC free article] [PubMed] [Google Scholar]
- Laub MT, Goulian M. Specificity in two-component signal transduction pathways. Annual review of genetics. 2007;41:121–145. doi: 10.1146/annurev.genet.41.042007.170548. [DOI] [PubMed] [Google Scholar]
- Lowy FD. Staphylococcus aureus infections. The New England journal of medicine. 1998;339:520–532. doi: 10.1056/NEJM199808203390806. [DOI] [PubMed] [Google Scholar]
- Mann EE, Rice KC, Boles BR, Endres JL, Ranjit D, Chandramohan L, Tsang LH, Smeltzer MS, Horswill AR, Bayles KW. Modulation of eDNA Release and Degradation Affects Staphylococcus aureus Biofilm Maturation. Plos One. 2009;4 doi: 10.1371/journal.pone.0005822. [DOI] [PMC free article] [PubMed] [Google Scholar]
- Moormeier DE, Endres JL, Mann EE, Sadykov MR, Horswill AR, Rice KC, Fey PD, Bayles KW. Use of microfluidic technology to analyze gene expression during Staphylococcus aureus biofilm formation reveals distinct physiological niches. Applied and environmental microbiology. 2013;79:3413–3424. doi: 10.1128/AEM.00395-13. [DOI] [PMC free article] [PubMed] [Google Scholar]
- Morrison JM, Dunman PM. The modulation of Staphylococcus aureus mRNA turnover. Future Microbiol. 2011;6:1141–1150. doi: 10.2217/fmb.11.102. [DOI] [PMC free article] [PubMed] [Google Scholar]
- Muthaiyan A, Silverman JA, Jayaswal RK, Wilkinson BJ. Transcriptional profiling reveals that daptomycin induces the Staphylococcus aureus cell wall stress stimulon and genes responsive to membrane depolarization. Antimicrobial agents and chemotherapy. 2008;52:980–990. doi: 10.1128/AAC.01121-07. [DOI] [PMC free article] [PubMed] [Google Scholar]
- Nizet V. Understanding how leading bacterial pathogens subvert innate immunity to reveal novel therapeutic targets. The Journal of allergy and clinical immunology. 2007;120:13–22. doi: 10.1016/j.jaci.2007.06.005. [DOI] [PubMed] [Google Scholar]
- Novick RP. Autoinduction and signal transduction in the regulation of staphylococcal virulence. Molecular microbiology. 2003;48:1429–1449. doi: 10.1046/j.1365-2958.2003.03526.x. [DOI] [PubMed] [Google Scholar]
- Pang YY, Schwartz J, Thoendel M, Ackermann LW, Horswill AR, Nauseef WM. agr-Dependent interactions of Staphylococcus aureus USA300 with human polymorphonuclear neutrophils. Journal of innate immunity. 2010;2:546–559. doi: 10.1159/000319855. [DOI] [PMC free article] [PubMed] [Google Scholar]
- Patton TG, Yang SJ, Bayles KW. The role of proton motive force in expression of the Staphylococcus aureus cid and lrg operons. Molecular microbiology. 2006;59:1395–1404. doi: 10.1111/j.1365-2958.2006.05034.x. [DOI] [PubMed] [Google Scholar]
- Rice KC, Bayles KW. Molecular control of bacterial death and lysis. Microbiol Mol Biol R. 2008;72:85–+. doi: 10.1128/MMBR.00030-07. [DOI] [PMC free article] [PubMed] [Google Scholar]
- Rice KC, Nelson JB, Patton TG, Yang SJ, Bayles KW. Acetic acid induces expression of the Staphylococcus aureus cidABC and lrgAB murein hydrolase regulator operons. Journal of Bacteriology. 2005;187:813–821. doi: 10.1128/JB.187.3.813-821.2005. [DOI] [PMC free article] [PubMed] [Google Scholar]
- Sadykov MR, Bayles KW. The control of death and lysis in staphylococcal biofilms: a coordination of physiological signals. Current opinion in microbiology. 2012;15:211–215. doi: 10.1016/j.mib.2011.12.010. [DOI] [PMC free article] [PubMed] [Google Scholar]
- Sadykov MR, V, Thomas C, Marshall DD, Wenstrom CJ, Moormeier DE, Widhelm TJ, Nuxoll AS, Powers R, Bayles KW. Inactivation of the Pta-AckA pathway causes cell death in Staphylococcus aureus. J Bacteriol. 2013;195:3035–3044. doi: 10.1128/JB.00042-13. [DOI] [PMC free article] [PubMed] [Google Scholar]
- Sau S, Sun J, Lee CY. Molecular characterization and transcriptional analysis of type 8 capsule genes in Staphylococcus aureus. J Bacteriol. 1997;179:1614–1621. doi: 10.1128/jb.179.5.1614-1621.1997. [DOI] [PMC free article] [PubMed] [Google Scholar]
- Shala A, Patel KH, Golemi-Kotra D, Audette GF. Expression, purification, crystallization and preliminary X-ray analysis of the receiver domain of Staphylococcus aureus LytR protein. Acta crystallographica Section F, Structural biology and crystallization communications. 2013;69:1418–1421. doi: 10.1107/S1744309113030972. [DOI] [PMC free article] [PubMed] [Google Scholar]
- Sharma-Kuinkel BK, Mann EE, Ahn JS, Kuechenmeister LJ, Dunman PM, Bayles KW. The Staphylococcus aureus LytSR two-component regulatory system affects biofilm formation. J Bacteriol. 2009;191:4767–4775. doi: 10.1128/JB.00348-09. [DOI] [PMC free article] [PubMed] [Google Scholar]
- Siam R, Marczynski GT. Glutamate at the phosphorylation site of response regulator CtrA provides essential activities without increasing DNA binding. Nucleic Acids Res. 2003;31:1775–1779. doi: 10.1093/nar/gkg271. [DOI] [PMC free article] [PubMed] [Google Scholar]
- Stewart PS, Franklin MJ. Physiological heterogeneity in biofilms. Nature reviews Microbiology. 2008;6:199–210. doi: 10.1038/nrmicro1838. [DOI] [PubMed] [Google Scholar]
- Stock AM, V, Robinson L, Goudreau PN. Two-component signal transduction. Annual review of biochemistry. 2000;69:183–215. doi: 10.1146/annurev.biochem.69.1.183. [DOI] [PubMed] [Google Scholar]
- Toro-Roman A, Mack TR, Stock AM. Structural analysis and solution studies of the activated regulatory domain of the response regulator ArcA: a symmetric dimer mediated by the alpha4-beta5-alpha5 face. Journal of molecular biology. 2005;349:11–26. doi: 10.1016/j.jmb.2005.03.059. [DOI] [PMC free article] [PubMed] [Google Scholar]
- Willett JW, Kirby JR. CrdS and CrdA comprise a two-component system that is cooperatively regulated by the Che3 chemosensory system in Myxococcus xanthus. mBio. 2011;2 doi: 10.1128/mBio.00110-11. [DOI] [PMC free article] [PubMed] [Google Scholar]
- Wolfe AJ. The acetate switch. Microbiology and molecular biology reviews : MMBR. 2005;69:12–50. doi: 10.1128/MMBR.69.1.12-50.2005. [DOI] [PMC free article] [PubMed] [Google Scholar]
- Wolfe AJ. Physiologically relevant small phosphodonors link metabolism to signal transduction. Current opinion in microbiology. 2010;13:204–209. doi: 10.1016/j.mib.2010.01.002. [DOI] [PMC free article] [PubMed] [Google Scholar]
- Yabu K, Kaneda S. Salt-induced cell lysis of Staphylococcus aureus. Current microbiology. 1995;30:299–303. doi: 10.1007/BF00295505. [DOI] [PubMed] [Google Scholar]
- Zhu T, Lou QA, Wu Y, Hu JA, Yu FY, Qu D. Impact of the Staphylococcus epidermidis LytSR two-component regulatory system on murein hydrolase activity, pyruvate utilization and global transcriptional profile. Bmc Microbiol. 2010;10 doi: 10.1186/1471-2180-10-287. [DOI] [PMC free article] [PubMed] [Google Scholar]
Associated Data
This section collects any data citations, data availability statements, or supplementary materials included in this article.