Abstract
The zebrafish pronephros is a well-established model to study glomerular development, structure, and function. A few methods have been described to evaluate glomerular barrier function in zebrafish larvae so far. However, there is a need to assess glomerular filtration as well. In the present study, we extended the available methods by simultaneously measuring the intravascular clearances of Alexa fluor 647-conjugated 10-kDa dextran and FITC-conjugated 500-kDa dextran as indicators of glomerular filtration and barrier function, respectively. After intravascular injection of the dextrans, mean fluorescence intensities of both dextrans were measured in the cardinal vein of living zebrafish (4 days postfertilization) by confocal microscopy over time. We demonstrated that injected 10-kDa dextran was rapidly cleared from the circulation, became visible in the lumen of the pronephric tubule, quickly accumulated in tubular cells, and was detectably excreted at the cloaca. In contrast, 500-kDa dextran could not be visualized in the tubule at any time point. To check whether alterations in glomerular function can be quantified by our method, we injected morpholino oligonucleotides (MOs) against zebrafish nonmuscle myosin heavy chain IIA (zMyh9) or apolipoprotein L1 (zApol1). While glomerular filtration was reduced in zebrafish nonmuscle myosin heavy chain IIA MO-injected larvae, glomerular barrier function remained intact. In contrast, in zebrafish apolipoprotein L1 MO-injected larvae, glomerular barrier function was compromised as 500-kDa dextran disappeared from the circulation and became visible in tubular cells. In summary, we present a novel method that allows to simultaneously assess glomerular filtration and barrier function in live zebrafish.
Keywords: glomerular filtration, in vivo observations, kidney, pronephros, zebrafish
genome-wide clinical screenings have produced numerous gene candidates that are currently being discussed for their relevance as risk factors for chronic kidney disease (5). Validating such candidates in mouse knockout models, however, is an expensive and time-consuming task. It would therefore be of great interest to establish a rapid screening method that is easy to handle, accurate, and dependable. The zebrafish seems to ideally fulfill this request. The zebrafish pronephros contains a single glomerulus that is structurally identical to mouse and human glomeruli and is fully developed after 3–4 days (1, 6). Moreover, its high reproduction rate and the possibility of knocking down specific genes via injection of morpholino oligonucleotides (MOs) make the zebrafish ideally suited for rapid screening experiments. Being highly transparent, the zebrafish larva is a powerful model for microscopy-based in vivo analysis of the integrity of the glomerular filtration barrier. However, whereas routine assays of fluorescent dextran clearance have been established for the mouse (12), the same degree of reliability has yet to be reached working with zebrafish larvae.
In most studies, defects of the filtration barrier in zebrafish are determined only qualitatively by detecting 500-kDa dextran within epithelial cells of the pronephric tubule in fixed sections (6). However, it has been shown that the clearance of fluorescent 70-kDa dextran can be observed and analyzed in living zebrafish by quantitative imaging (4). We propose that the analysis of quantitative dextran clearance can be improved by measuring the mean fluorescence intensities in large vessels, e.g., the dorsal aorta or cardinal vein. Furthermore, attention has been focused on glomerular barrier function so far, whereas glomerular filtration in zebrafish as a phenotype after gene knockdown has remained largely unexplored. The clearance of low-molecular-weight dextran from the circulation appears to be well suited for the assessment of glomerular filtration (7). In the present study, we demonstrate that quantification of fluorescence intensities by confocal microscopy in the cardinal vein allowed us to determine the clearance of injected 10- and 500-kDa dextrans from the circulation to simultaneously assess glomerular filtration and barrier function in live zebrafish larvae.
MATERIALS AND METHODS
Zebrafish stocks.
Zebrafish were grown, mated, and maintained at 28.5°C, according to standard protocols (9) and as previously described (7). Zebrafish husbandry and experiments on larvae were performed in accordance with German animal protection law overseen by the agencies of the Federal State of Mecklenburg-Pomerania. Embryos were kept and handled in E3 solution. Zebrafish larvae of the AB strain were used for the quantification of dextran clearances from the vasculature. In addition, we observed the clearance of an endogenously expressed fluorescent plasma protein. As we have recently shown, imaging of the zebrafish pronephros is greatly improved in transparent zebrafish mutants (2). Therefore, we crossed the transparent zebrafish casper (10) with the transgenic l-fabp:DBP-EGFP zebrafish line, in which vitamin D-binding protein (DBP) coupled to enhanced green fluorescent protein (EGFP) is expressed in the blood plasma (11). In the text, this zebrafish line is referred to as the CADE [Tg(Casper; l-fabp:DBP-EGFP)] line.
Dextran microinjection and confocal microscopy.
Tricaine (Sigma-Aldrich, Munich, Germany) at a concentration of 0.1–0.5% (in E3 solution) was used to anesthetize larvae before microinjection and microscopy. Larvae at 4 days postfertilization (dpf) were injected with a 1:1 mixture of 20 mg/ml Alexa fluor 647-conjugated 10-kDa dextran and 10 mg/ml FITC-conjugated 500-kDa dextran (Invitrogen, San Diego, CA) dissolved in PBS. About 6 nl of the solution were injected into the caudal vein using Femtotips micropipettes (Eppendorf, Hamburg, Germany). After recovery in E3 medium for 40 min, larvae were anesthetized again. For confocal microscopy, a Leica TCS SP5 (Leica Microsystems, Wetzlar, Germany) was used, and larvae were positioned on their sides in a glass-bottom petri dish. The vasculature, pronephric tubule, and cloaca were imaged over time to study the distribution of injected dextrans. For the quantitative analysis of dextran clearance (see below), image stacks of the dorsal aorta and cardinal vein caudal of the swim bladder were recorded for both fluorescence channels at fixed time points after injection. Between recordings, larvae were transferred to E3 medium at 28°C for recovery. We used a ×20 water-immersion objective (HCX PL APO 20x/0.7) and a step size of 630 nm.
MO-mediated knockdown.
MOs were designed by Gene Tools (Philomath, OR). To target the 5′-untranslated region, including the start codon of zebrafish nonmuscle myosin heavy chain IIA (zMyh9) mRNA (ENSDARG00000063295), the following sequence was used: 5′-GAACTTCTCTGCGTCTGACATTTTG-3′ (zMyh9 MO). To target the 5′-untranslated region, including the start codon of zebrafish apolipoprotein L1 (zApol1) mRNA (ENSDARG00000007425), the following MO was used: 5′-CCTTATAAAAGGCCCACCTGCATGA-3′ (zApol1 MO). For control larvae, eggs were injected with standard control MO provided by Gene Tools with the following sequence: 5′-CCTCTTACCTCAGTTACAATTTATA-3′ (Ctrl MO). MOs were diluted to a concentration of 1 mM. A volume of ∼3 nl/zebrafish embryo was injected into the yolk at the two- to four-cell stage using a microinjector (Transjector 5246, Eppendorf).
Quantitative image analysis of intravascular fluorescence.
Confocal image stacks were recorded with optimal contrast settings at the first time point. Later recordings were done without changing the initial settings. Each image stack was transformed into a two-dimensional image using the maximum intensity projection algorithm, which selects for each xy-position the pixel with the highest intensity along the z-profile of the stack. Fluorescence intensity was measured in the dorsal aorta or cardinal vein by defining regions of interest using ImageJ software (version 1.47i, National Institutes of Health). Care was taken to place the regions of interest outside of bright speckles, most likely reflecting dextran taken up by endocytosis. For quantitative analysis of the fluorescence intensities over time (cf. Figs. 4 and 5), confocal image stacks were recorded at 3, 6, 10, and 24 h. Fluorescence intensities at 3 h were set to 100% for each zebrafish larva. Data are presented as means ± SE.
Fig. 4.
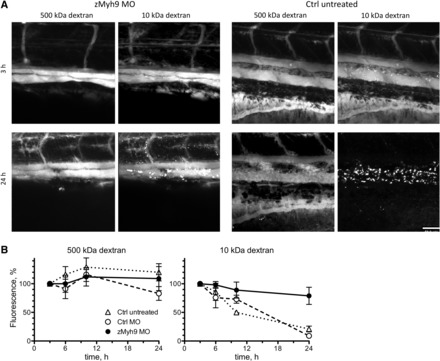
Effect of zebrafish nonmuscle myosin heavy chain IIA (zMyh9) knockdown on glomerular function. A: whereas Alexa fluor 647-conjugated 10-kDa dextran was almost completely cleared after 24 h from the circulation of control larvae (4 dpf), it was retained in zMyh9 knockdown larvae. The vascular signal of FITC-conjugated 500-kDa dextran remained relatively stable over time in control (Ctrl) as well as zMyh9 knockdown larvae. B: fluorescence intensity measurements over time demonstrated reduced glomerular filtration but unaffected glomerular barrier function in zMyh9 knockdown larvae. MO, morpholino oligonucleotide. Data are means ± SE of 4 larvae. Scale bar = 50 μm.
Fig. 5.
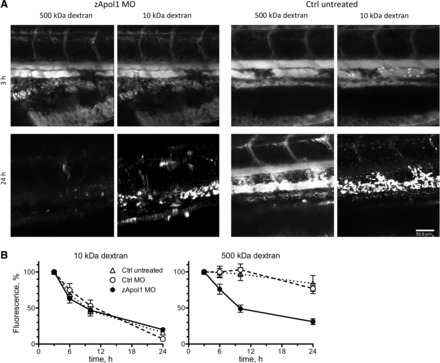
Effect of zebrafish apolipoprotein L1 (zApol1) knockdown on glomerular function. A: alexa Fluor 647-conjugated 10-kDa dextran was almost completely cleared after 24 h from the circulation of control as well as zApol1 knockdown larvae (4 dpf). The vascular signal of FITC-conjugated 500-kDa dextran remained relatively stable over time in control larvae but was practically lost in zApol1 knockdown larvae. B: fluorescence intensity measurements over time demonstrated unaffected glomerular filtration but compromised glomerular barrier function in zApol1 knockdown larvae. Data are means ± SE of 12 larvae. Scale bar = 50 μm.
RESULTS AND DISCUSSION
Distribution and excretion of dextrans.
Figure 1A shows a zebrafish larva at 4 dpf, anesthetized and positioned on its side for imaging. Larvae were anesthetized for brief imaging periods of 5–10 min only and transferred to E3 medium between recordings taking place at several time points after injection. Alexa fluor 647-conjugated 10-kDa dextran (20 mg/ml) was mixed 1:1 with FITC-conjugated 500-kDa dextran (10 mg/ml) and injected into the caudal vein. The dyes were chosen for their completely separate spectra, thus avoiding any risk of channel cross-talk or dye energy transfer. After injection, the complete vasculature was fluorescent in both channels (Fig. 1, B–D).
Fig. 1.
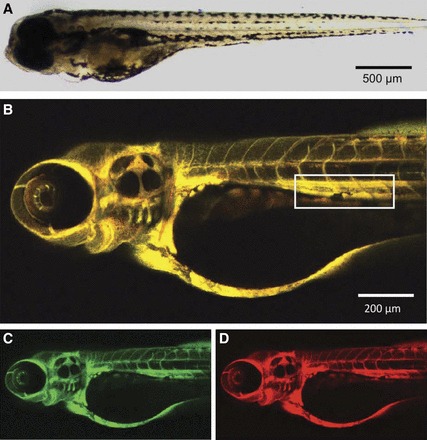
Intravascular injection of dextrans in zebrafish larvae (4 days postfertilization). A: an anesthetized larva positioned on its side for imaging. B–D: maximum intensity projection of a z-stack 45 min after injection of Alexa fluor 647-conjugated 10-kDa dextran (red) and FITC-conjugated 500-kDa dextran (green). The box in B marks the region of interest for the quantification of dextran clearance, comprising a part of the dorsal aorta and of the cardinal vein.
As a result of filtration, 10-kDa dextran was present within the pronephric tubule, and fluorescent outflow could be seen at the cloaca (Fig. 2, A and C). Due to endocytosis, 10-kDa dextran could be detected within tubular epithelial cells (arrow in Fig. 2A). At the same time, 10-kDa dextran started to accumulate in the tissue of the tail region (Fig. 2B) and in distinct spots around the vascular lumen. After 24 h, the vasculature was cleared of 10-kDa dextran, leaving only isolated spots of high fluorescent intensity where it was internalized. 500-kDa dextran did not show in the pronephric tubule, within tubular cells, or at the cloaca at any time (Fig. 2, A and C). However, a noticeable drop in the fluorescence signal intensity within the vasculature could be detected within the first few hours, continuing until the last measurement. Simultaneously, 500-kDa dextran began to appear in extravascular tissues (Fig. 2B). It was never internalized by tissue within the region that was used for quantification (box in Fig. 1B). In both channels, a clear signal could be found in the fins at different times (Fig. 2B). 10-kDa dextran was present in the fins at 45 min after injection. Its signal intensity gradually dropped during later measurements, being compatible with an equilibrium between intra- and extravascular spaces. The 500-kDa dextran signal maintained high intensity in the fins between 3 and 10 h, decreasing slightly at 24 h after injection.
Fig. 2.
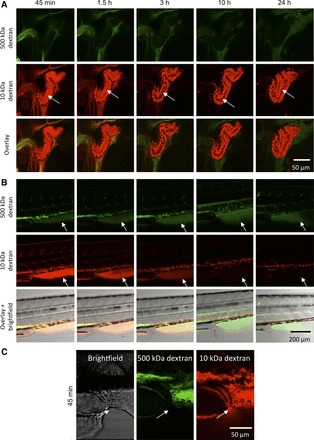
Dextran signals in the pronephric tubule, anal fin, and outflow from the cloaca. A: Alexa fluor 647-conjugated 10-kDa dextran reached the pronephric tubule earlier than 45 min after injection and was visible within the tubular lumen (arrow) and inside tubular epithelial cells. After 3 h, the luminal signal had diminished considerably, indicating that most of 10-kDa dextran was removed from the blood stream. FITC-conjugated 500-kDa dextran was absent from the tubule at all time points. B: both dextrans diffused into extravascular tissues, such as the fins (the arrow marks the anal fin). The 10-kDa dextran signal in the fins was strong at the beginning and decreased over time. The 500-kDa dextran signal in the fins reached a maximum at 10 h after injection and declined slowly over time. C: beginning at 45 min after injection, outflow of 10 kDa dextran could be observed at the cloaca, in contrast to 500-kDa dextran.
Vascular clearance of dextrans in zebrafish larvae with intact glomerular function.
For a reliable quantification of fluorescent intensities in long-term imaging experiments, it is important to choose an appropriate region of interest. We decided to focus on a section of the dorsal aorta and cardinal vein directly caudal of the swim bladder (box in Fig. 1B). Use of this region combines several advantages: it is easily recognizable, allowing for highly reproducible measurements at different time points, it is largely invariant to small shifts in specimen positioning and to changes due to growth during long-term measurements, and it contains two large blood vessels. This provides a large luminal area for quantitative measurements, decreasing the error of mean values. Furthermore, these vessels are close to the surface but far from the tail region, where 10-kDa dextran is concentrated in bright spots due to internalization by surrounding tissues.
Ten zebrafish larvae at 4 dpf were prepared, and the region of interest was imaged as described above at several time points (Fig. 3). As expected, the Alexa fluor 647 intensity of 10-kDa dextran dropped faster than the FITC intensity of 500-kDa dextran, especially at later stages, approaching zero after 24 h. FITC fluorescence intensities dropped to a level of ∼70–80% of the starting value after 3 h, approaching a plateau later on. Since we could detect filtration of 10-kDa dextran only, we conclude that the loss of 500-kDa dextran from the vasculature is due to a very slow distribution into the extravascular space. In contrast, the distribution phase of 10-kDa dextran seems to be completed within several minutes. The different timescales of dextran distributions are further supported by the different fluorescence intensities over time within the fin tissue (Fig. 2B). 10-kDa dextran, which reached an equilibrium between intra- and extravascular spaces very fast, exhibited a strong signal in the fins at 45 min after injection, diminishing gradually as it was cleared from the blood stream. 500-kDa dextran reached its maximum intensity in the fins only after 3–10 h, strongly supporting the notion of slow 500-kDa dextran distribution and late equilibrium.
Fig. 3.
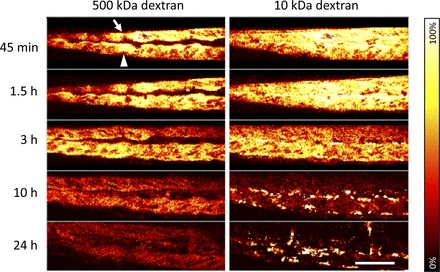
Dextran clearance from the blood stream. Intensity time series of a section of the dorsal aorta (arrow) and cardinal vein (arrowhead) in vivo after injection of Alexa fluor 647-conjugated 10-kDa dextran and FITC-conjugated 500-kDa dextran are shown. The intensity in both channels decreased over time. The intravascular signal of 10-kDa dextran approached zero between 10 and 24 h after injection. At the same time, bright, isolated spots developed due to endocytosis of 10-kDa dextran. Scale bar = 50 μm.
Vascular clearance of dextrans in zebrafish larvae with glomerular dysfunction.
To demonstrate the utility of our method to detect glomerular dysfunction, we measured the simultaneous vascular clearance of dextrans after knockdown of zMyh9 and zApol1, respectively. Mutations in MYH9 and APOL1 are associated with chronic kidney disease in humans (3, 8). However, it remains unclear whether zMyh9 and zApol1 serve similar or identical functions in zebrafish. While humans possess seven members of the apolipoprotein L family, zebrafish possess a single apolipoprotein L protein, i.e., zApol1, bearing moderate homology to several members of the human apolipoprotein L family with the highest BLAST score for apolipoprotein L3 (Table 1 and Supplemental Material).1 The vascular clearance of 500-kDa dextran in zebrafish larvae (4 dpf) remained unaffected by injection of zMyh9 MO (Fig. 4). In contrast, the vascular clearance of 10-kDa dextran was significantly reduced compared with controls (injection of Ctrl MO or no injection). These findings are in agreement with those of our earlier study (7), suggesting that knockdown of zMyh9 results in a reduced glomerular filtration rate but does not compromise glomerular filtration barrier function.
Table 1.
BLAST results for zebrafish Apol1 (Q7T131) against members of the human apolipoprotein L family using UniProt BLAST (www.uniprot.org/blast)
| UniProt Identifier | Identities, amino acids | Positives, amino acids | Score | E Value | |
|---|---|---|---|---|---|
| APOL1 | O14791 | 73 | 126 | 200 | 1 × 10⁻¹⁶ |
| APOL2 | Q9BQE5 | 68 | 120 | 180 | 4 × 10⁻¹⁴ |
| APOL3 | O95236 | 74 | 117 | 226 | 4 × 10⁻²⁰ |
| APOL4 | Q9BPW4 | 69 | 122 | 209 | 5 × 10⁻¹⁸ |
| APOL5 | Q9BWW9 | 63 | 111 | 169 | 2 × 10⁻¹² |
| APOL6 | Q9BWW8 | 74 | 117 | 222 | 8 × 10⁻²⁰ |
| APOLD1 | Q96LR9 | 46 | 75 | 218 | 1 × 10⁻¹⁹ |
The BLAST score was highest for apolipoprotein (APO)L3. The number of similar amino acids (positives) was highest for APOL1.
Knockdown of zApol1 resulted in a significant decrease of the intravascular fluorescence intensity of 500-kDa dextran over time (Fig. 5). Twenty-four hours after injection of 500-kDa dextran, the fluorescence was practically lost. On the other hand, the decline of 10-kDa dextran fluorescence did not differ between zApol1 knockdown and control larvae. Thus, zApol1 knockdown results in compromised glomerular filtration barrier function, whereas glomerular filtration rate is maintained.
Vascular clearance of a plasma protein.
Since knockdown of zApol1 has not been reported so far, we aimed to confirm our results by investigating the clearance of 78-kDa DBP fused to EGFP (DBP-EGFP), which has been reported to be unable to pass the intact blood-brain or blood-retina barrier (11) and to be retained by the glomerular filtration barrier (13). To be able to image vascular and pronephric structures, we generated the transgenic zebrafish CADE line by crossing the transparent zebrafish line casper (10) with the transgenic zebrafish line that expresses DBP-EGFP in blood plasma (11).
Knockdown of zApol1 resulted in the accumulation of DBP-EGFP in endocytic vesicles of the pronephric tubule in CADE zebrafish (arrows in Fig. 6), whereas DBP-EGFP was absent from the pronephric tubule in zMyh9 knockdown and control larvae. Intravascularly injected Alexa fluor 647-conjugated 10-kDa dextran, which passes the glomerular filtration barrier and is taken up in the pronephric tubule (cf. Fig. 2), colocalized with DBP-EGFP in zApol1 knockdown larvae only (n = 6; Fig. 6). These results demonstrate that DBP-EGFP is retained by the intact glomerular filtration barrier. Knockdown of zApol1, but not of zMyh9, compromises the glomerular filtration barrier, consistent with our vascular clearance results obtained with 500-kDa dextran. Leakage of DBP-EGFP through the glomerular filtration barrier in zApol1 knockdown larvae results in an elevated clearance of DBP-EGFP from the blood. Accordingly, the intravascular fluorescence intensity of DBP-EGFP was clearly reduced in zApol1 knockdown larvae compared with zMyh9 knockdown and control larvae (n = 6; Fig. 7).
Fig. 6.
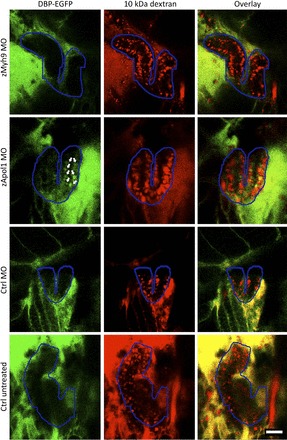
Accumulation of filtered vitamin D-binding protein (DBP) coupled to enhanced green fluorescent protein (EGFP) (DBP-EGFP) in the pronephric tubular epithelium after zApol1 knockdown. Transparent CADE zebrafish larvae (4 dpf), expressing DBP-EGFP in the circulation, were injected with Alexa fluor 647-conjugated 10-kDa dextran at 3 dpf to visualize the pronephric tubular epithelium (outlined in blue) due to uptake of the filtered dextran. DBP-EGFP was absent from the tubular epithelium in control and zMyh9 knockdown larvae. In contrast, DBP-EGFP was present in the tubular epithelium of zApol1 knockdown larvae, indicating leakage of DBP-EGFP through the glomerular filtration barrier. Note that knockdowns did not affect the morphology of tubules, which were imaged in vivo in somewhat differently orientated larvae. Scale bar = 50 μm.
Fig. 7.
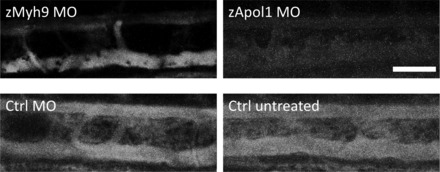
Reduced DBP-EGFP fluorescence in the vasculature of zApol1 knockdown larvae. The same area that was used for the quantification of fluorescence intensities of injected dextrans is shown in CADE larvae (4 dpf). Compared with control and zMyh9 knockdown larvae, the fluorescence signal of DBP-EGFP in the dorsal aorta and cardinal vein was strongly diminished in zApol1 knockdown larvae. Scale bar = 50 μm.
Our data demonstrate that intensity measurements of intravascularly injected, fluorescently labeled 10- and 500-kDa dextran over time allowed us to simultaneously assess filtration rate and filtration barrier function of the pronephric glomerulus in zebrafish in a quantitative way. Furthermore, we show that our method can be applied to detect alterations of glomerular filtration rate as well as alterations of glomerular barrier function.
GRANTS
This work was supported by European Union Grant FP7-REGPOT-2010-1, EnVision Grant 264143, and German Federal Ministry of Education and Research Grant 03IS2061A (to N. Endlich and K. Endlich).
DISCLOSURES
No conflicts of interest, financial or otherwise, are declared by the author(s).
AUTHOR CONTRIBUTIONS
Author contributions: A.M.K., T.M., J.X., and N.E. performed experiments; A.M.K., T.M., K.E., and N.E. analyzed data; A.M.K., T.M., B.A.-A., K.E., and N.E. interpreted results of experiments; A.M.K., T.M., K.E., and N.E. prepared figures; J.X., B.A.-A., and K.E. approved final version of manuscript; K.E. and N.E. conception and design of research; T.M., K.E. and N.E. drafted manuscript.
ACKNOWLEDGMENTS
Present address of T. Müller: BioOptics Core Facility, Research Institute of Molecular Pathology and Institute of Molecular Biotechnology of the Austrian Academy of Sciences, Vienna, Austria.
Footnotes
Supplemental Material for this article is available at the American Journal of Physiology-Renal Physiology website.
REFERENCES
- 1.Drummond IA, Davidson AJ. Zebrafish kidney development. Methods Cell Biol 100: 233–260, 2010. [DOI] [PubMed] [Google Scholar]
- 2.Endlich N, Simon O, Gopferich A, Wegner H, Moeller MJ, Rumpel E, Kotb AM, Endlich K. Two-photon microscopy reveals stationary podocytes in living zebrafish larvae. J Am Soc Nephrol 25: 681–686, 2014. [DOI] [PMC free article] [PubMed] [Google Scholar]
- 3.Genovese G, Friedman DJ, Ross MD, Lecordier L, Uzureau P, Freedman BI, Bowden DW, Langefeld CD, Oleksyk TK, Uscinski Knob AL, Bernhardy AJ, Hicks PJ, Nelson GW, Vanhollebeke B, Winkler CA, Kopp JB, Pays E, Pollak MR. Association of trypanolytic ApoL1 variants with kidney disease in African Americans. Science 329: 841–845, 2010. [DOI] [PMC free article] [PubMed] [Google Scholar]
- 4.Hentschel DM, Mengel M, Boehme L, Liebsch F, Albertin C, Bonventre JV, Haller H, Schiffer M. Rapid screening of glomerular slit diaphragm integrity in larval zebrafish. Am J Physiol Renal Physiol 293: F1746–F1750, 2007. [DOI] [PubMed] [Google Scholar]
- 5.Kottgen A, Pattaro C, Boger CA, Fuchsberger C, Olden M, Glazer NL, Parsa A, Gao X, Yang Q, Smith AV, O'Connell JR, Li M, Schmidt H, Tanaka T, Isaacs A, Ketkar S, Hwang SJ, Johnson AD, Dehghan A, Teumer A, Pare G, Atkinson EJ, Zeller T, Lohman K, Cornelis MC, Probst-Hensch NM, Kronenberg F, Tonjes A, Hayward C, Aspelund T, Eiriksdottir G, Launer LJ, Harris TB, Rampersaud E, Mitchell BD, Arking DE, Boerwinkle E, Struchalin M, Cavalieri M, Singleton A, Giallauria F, Metter J, de Boer IH, Haritunians T, Lumley T, Siscovick D, Psaty BM, Zillikens MC, Oostra BA, Feitosa M, Province M, de Andrade M, Turner ST, Schillert A, Ziegler A, Wild PS, Schnabel RB, Wilde S, Munzel TF, Leak TS, Illig T, Klopp N, Meisinger C, Wichmann HE, Koenig W, Zgaga L, Zemunik T, Kolcic I, Minelli C, Hu FB, Johansson A, Igl W, Zaboli G, Wild SH, Wright AF, Campbell H, Ellinghaus D, Schreiber S, Aulchenko YS, Felix JF, Rivadeneira F, Uitterlinden AG, Hofman A, Imboden M, Nitsch D, Brandstatter A, Kollerits B, Kedenko L, Magi R, Stumvoll M, Kovacs P, Boban M, Campbell S, Endlich K, Volzke H, Kroemer HK, Nauck M, Volker U, Polasek O, Vitart V, Badola S, Parker AN, Ridker PM, Kardia SL, Blankenberg S, Liu Y, Curhan GC, Franke A, Rochat T, Paulweber B, Prokopenko I, Wang W, Gudnason V, Shuldiner AR, Coresh J, Schmidt R, Ferrucci L, Shlipak MG, van Duijn CM, Borecki I, Kramer BK, Rudan I, Gyllensten U, Wilson JF, Witteman JC, Pramstaller PP, Rettig R, Hastie N, Chasman DI, Kao WH, Heid IM, Fox CS. New loci associated with kidney function and chronic kidney disease. Nat Genet 42: 376–384, 2010. [DOI] [PMC free article] [PubMed] [Google Scholar]
- 6.Kramer-Zucker AG, Wiessner S, Jensen AM, Drummond IA. Organization of the pronephric filtration apparatus in zebrafish requires nephrin, podocin and the FERM domain protein mosaic eyes. Dev Biol 285: 316–329, 2005. [DOI] [PMC free article] [PubMed] [Google Scholar]
- 7.Muller T, Rumpel E, Hradetzky S, Bollig F, Wegner H, Blumenthal A, Greinacher A, Endlich K, Endlich N. Non-muscle myosin IIA is required for the development of the zebrafish glomerulus. Kidney Int 80: 1055–1063, 2011. [DOI] [PubMed] [Google Scholar]
- 8.Sekine T, Konno M, Sasaki S, Moritani S, Miura T, Wong WS, Nishio H, Nishiguchi T, Ohuchi MY, Tsuchiya S, Matsuyama T, Kanegane H, Ida K, Miura K, Harita Y, Hattori M, Horita S, Igarashi T, Saito H, Kunishima S. Patients with Epstein-Fechtner syndromes owing to MYH9 R702 mutations develop progressive proteinuric renal disease. Kidney Int 78: 207–214, 2010. [DOI] [PubMed] [Google Scholar]
- 9.Westerfield M. The Zebrafish Book. Eugene, OR: Univ. of Oregon Press, 2000. [Google Scholar]
- 10.White RM, Sessa A, Burke C, Bowman T, LeBlanc J, Ceol C, Bourque C, Dovey M, Goessling W, Burns CE, Zon LI. Transparent adult zebrafish as a tool for in vivo transplantation analysis. Cell Stem Cell 2: 183–189, 2008. [DOI] [PMC free article] [PubMed] [Google Scholar]
- 11.Xie J, Farage E, Sugimoto M, Anand-Apte B. A novel transgenic zebrafish model for blood-brain and blood-retinal barrier development. BMC Dev Biol 10: 76, 2010. [DOI] [PMC free article] [PubMed] [Google Scholar]
- 12.Yu W, Sandoval RM, Molitoris BA. Rapid determination of renal filtration function using an optical ratiometric imaging approach. Am J Physiol Renal Physiol 292: F1873–F1880, 2007. [DOI] [PubMed] [Google Scholar]
- 13.Zhou W, Hildebrandt F. Inducible podocyte injury and proteinuria in transgenic zebrafish. J Am Soc Nephrol 23: 1039–1047, 2012. [DOI] [PMC free article] [PubMed] [Google Scholar]


