

Abstract
The purpose of this study was to demonstrate a neural respiratory gating system using a paired stimuli paradigm. The N1 peak of the respiratory-related evoked potential (RREP) represents early perceptual processing of respiratory sensory information. This is similar to the N100 peak shown with tactile sensation, where the second peak amplitude (S2) of the N100 peak from the somatosensory evoked potential (SEP) was smaller than the first peak amplitude (S1) when the stimuli were presented 500 ms apart. We hypothesized that paired inspiratory occlusions would result in a reduced amplitude of the S2 N1 RREP peak amplitude, indicating respiratory central neural gating. Twenty healthy subjects (10 men and 10 women; 25.8 ± 6.5 yr old) completed the paired inspiratory occlusion (RREP) trial. Thirteen of the subjects also completed the paired mouth air puffs [mouth-evoked potential (MEP) trial], and the paired hand air puffs (SEP) trial. All paired presentations were separated by 500 ms. The N1 peak amplitudes of the RREP trial and the N100 peak amplitudes of the MEP and SEP trials for S1 and S2 and the S2/S1 ratios were determined. The S1 RREP N1 peak amplitude was significantly greater than S2, and the S2/S1 ratio was 0.43. The S1 MEP and SEP N100 peak amplitudes were significantly greater than S2, and the N100 ratio was 0.49 and 0.49, respectively. These results are consistent with central neural gating of respiratory afferent input. The RREP gating response is similar to somatosensory mechanoreceptor gating.
Keywords: respiratory sensation, inspiratory occlusion, cerebral cortex, mechanosensation
cortical neuronal activation, measured by the respiratory-related evoked potential (RREP), can be elicited by inspiratory occlusion, inspiratory resistive loads, and expiratory occlusions (11, 12). Airway obstruction activates mechanoreceptors that project to the somatosensory cortex (28). The RREP is similar to somatosensory evoked potentials (SEPs) recorded in animals and humans (11). There is also a relationship between the inspiratory load detection threshold, magnitude estimation, and the RREP (8, 25). The RREP is only elicited when resistive load magnitudes exceed the detection threshold (8). The RREP peak amplitudes are directly related to the magnitude estimation of the resistive loads (25). These results suggest that the RREP is a neural measure of the perceptual response to respiratory loads.
The component peaks Nf, P1, N1, and P300 have been identified in the RREP waveforms. The short-latency peak, Nf, occurs approximately between 25 and 45 ms after the onset of stimulation. The frontal Nf peak is a result of neural activation in the frontal supplementary motor cortex (28). It was also reported that the Nf peak is parallel to the somatosensory P1 activation (9). Davenport et al. (9) suggested that Nf has a separate cortical generator in the premotor cortex independent of P1. The Nf peak is unique to the RREP as there is no peak in the SEP corresponding to the RREP Nf. The role of the Nf in cognitive processing of respiratory sensation is unclear. The Nf peak precedes the P1 peak and may be indicative of a predictive process in cognitive functioning. Davenport et al. (8) reported that the Nf peak, similar to the P1 peak, was only elicited when the resistive load was over the detection threshold, and its peak amplitudes increased with resistive load magnitude. The P1 peak latency was between 45 and 70 ms after the onset of stimulation. The P1 peak is a result of neural activation of the somatosensory cortex (28). Davenport et al. (11) suggested that the P1 peak is an indicator of the arrival of respiratory load-related sensory information to the somatosensory cortex, similar to the limb SEP P50 peak. Knafelc and Davenport (26) found that the amplitude of the RREP P1 peak increased with the magnitude of the inspiratory resistive load. Subsequently, Knafelc and Davenport (25) confirmed this finding and also reported that the P1 amplitude increased with magnitude estimation (ME). The P1 peak is only elicited by the resistive loads that exceed the detection threshold (8), and is abolished when background loads are applied making resistive loads undetectable (7). The N1 peak latency was between 85 and 120 ms after the stimulus onset. The respiratory N1 peak is similar in latency and scalp location to the auditory and somatosensory evoked potential N100 peak (11, 46). The respiratory N1 peak has not been investigated in detail, but this peak is consistently observed in the RREP studies (10, 11, 26). Localization studies have shown the greatest N1 peak amplitude to be found at the vertex, Cz (28, 45). The scalp distribution of the N1 peak suggested an extensive activation of the somatomotor cortex (46). Webster and Colrain (46) reported that the N1 peak amplitude increased with attention to respiratory stimuli. They suggested that the N1 is a compound peak consisting of multiple negative components, one unassociated with attention and the other related to attention. This is supported by the report that the auditory N100 peak is similarly a composite of two negative components (30). The N1 peak may represent the triggering or gating process related to subjects attending to the stimulus, which is followed by cortical and subcortical neural activity related to cognitive processing of load information (P300). Thus we hypothesized that conscious perception of inspiratory resistive loads may be the result of gated central neural processes that are represented by both short-latency and long-latency RREP components.
The above evidence suggests that there is an intensity-based mechanism governing the postulated “gate” and dictates whether the gate opens or closes for the respiratory sensory information. It is proposed in this study that there is a frequency-based gating mechanism, which reflects the cortical response to the stimuli based on stimulus frequency. Frequency-based gating has been extensively investigated with auditory, visual, and somatosensory modalities (3, 5). Sensory gating is defined as “a scalp-recorded electroencephalographic measure that reflects reduced neural activity in response to increased stimulus redundancy (1).” Cortical evoked potentials were recorded with modality-specific stimulation using a paired stimuli paradigm. The P50 and N100 peaks from auditory and somatosensory evoked potentials were identified as the “gating peaks” (5). The auditory and somatosensory P50 was found to be a positive peak between 15 and 80 ms after the sensory stimulus onset (18). The N100 is a negative peak found between 75 and 150 ms after the stimulus onset (18). Arnfred et al. (5) reported that a paired muscle twitch lasting for 0.2 ms delivered to the median nerve with an interstimulus interval (ISI) of 500 ms elicited a somatosensory N100 peak. The N100 peak amplitude for the second stimulus (S2) was significantly reduced compared with the amplitude for the first (S1). The ratio of S2/S1 was found to be less than 0.5 in normal control subjects, which indicates the existence of somatosensory neural gating (5). Similar results for the visual and auditory P50 and N100 peaks have been reported (5, 18, 50). When the ISI is longer than 6 s, the P50 peak amplitudes of S2 become closer to the peak amplitudes of S1 (2, 50). The neural activation elicited by the S2 is suppressed by S1 when the ISI is less than 6 s, indicative of stimulus frequency-dependent gating of cortical activity (2, 50). Individuals with psychiatric disorders (e.g., schizophrenia, bipolar disorders, posttraumatic stress disorders, or anxiety disorders) that experienced “sensory flooding” have S2/S1 ratios (with 500-ms ISI) approaching 1.0, suggesting reduced gating of sensory stimuli (1, 29, 31, 34, 40).
While respiratory sensory information can activate the cerebral cortex, eupneic breathing is normally not perceived, suggesting that respiratory neural cognitive pathways function as a gated system. If respiratory sensation follows similar pathways to somatosensory sensation, we hypothesized that gating can also be observed in the RREP with a similar paired stimuli paradigm. If the RREP is similar to the SEP, then the RREP P1 and N1 peaks should correspond to the SEP P50 and N100 peaks. Somatosensory gating can be tested with the SEP elicited by paired mechanical stimuli applied to the body, such as the hands or chest (5), and respiratory gating can be tested with the RREP elicited by paired respiratory occlusions. The purpose of this study was to investigate respiratory sensory gating using paired occlusion-elicited RREPs. It was further hypothesized that the S2 peak amplitude of the RREP P1, and N1 peak in a paired occlusion paradigm will be less than the S1 amplitude. In addition, the S2/S1 ratio of the RREP was hypothesized to be similar to the SEP. Finally, it is expected that the P1, N1, P50, and N100 peaks S2/S1 ratio will be 0.5 or less.
MATERIAL AND METHODS
This study was reviewed and approved by the Institutional Review Board at the University of Florida.
Subjects.
A total of 20 subjects (10 women and 10 men) participated in the study. The mean age was 25.8 ± 6.5 yr. All subjects self-reported no history of smoking or cardiovascular, respiratory, or neurological disease. The subjects were instructed to refrain from caffeine for 12 h before the experiment. The nature of the experiment was explained to the subject on arrival to the laboratory, and the subject provided written consent to participate in the study.
Pulmonary function test.
All subjects were prescreened with a pulmonary function test (PFT). The forced vital capacity (FVC) was measured for the subject at least three times. The subject was instructed to respire normally for a few breaths and provide a forced expiration after a deep inspiration. The instruction was based on the American Thoracic Society Standard for spirometry testing. At least 1 min of rest was given to the subject between each test. The forced expired volume within 1 s (FEV1) and the FVC were recorded (Jaeger Toennies, Medizintechnikmit System), and the ratio of FEV1/FVC was used for analysis. All subjects had a FEV1/FVC ratio greater than 80%. The R5 resistance was measured with impulse oscillometry (Jaeger Toennies, Medizintechnikmit System). The mean R5 resistance was 3.33 ± 1.44 cmH2O·l−1·s, within the predicted value normal range for all the subjects.
Subject preparation.
A scalp electrode cap based on the International 10–20 system was positioned onto the subject's head and connected to the Grass electroencephalographic (EEG) system (Neurodata 12, Grass Instruments). Conducting paste was applied through the center of the electrode to establish electrode contact with the scalp. Bipolar electrodes were placed on the skin lateral to the canthus of the left eye for recording vertical electro-oculogram (VEOG) activity. The impedance level of each electrode was checked to ensure that it was below 5 kΩ. The scalp recording sites were F3, Fz, F4, C3′, Cz′, C4′, and Cz. The C3′, Cz′, and C4′ channels are located 2 cm caudal to the C3, Cz, and C4 channels. The EEG activity was band pass filtered at 0.3 Hz to 1 kHz, amplified at 50 K, digitized at 2.5 kHz, and led into an online signal-averaging computer system (model 1401, Cambridge Electronics Design). The EEG activity was referenced to the joined ear lobes. The EEG activity was monitored by the experimenter with an oscilloscope.
The subject was instructed to sit comfortably in a chair with their neck, back, arms, and legs supported. They respired through a mouthpiece with a nonrebreathing valve for the RREP and mouth evoked potentials (MEP) trials. The inspiratory port of the nonrebreathing valve was connected to a pneumotachograph (2600 series, Hans Rudolph) and an occlusion valve, screened from subject. The occlusion valve was connected to a double trigger system. The trigger control device provided an electrical output used to initiate data sample collection by the computer simultaneous with the occlusion valve closure. The mouthpiece was suspended to minimize facial muscle activity. Mouth pressure (Pm) was recorded at the center of the nonrebreathing valve by differential pressure transducer (model MP-45, Validyne Engineering). Airflow was recorded by a second differential pressure transducer connected to the pneumotachograph. The Pm and airflow were led into the online computer system (model 1401, Cambridge Electronics Design) and digitized at 2.5 kHz. Pm and airflow were also led to an oscilloscope and monitored by the experimenter. The subject was monitored by a video camera. In every trial, the subject watched a videotaped movie of their choice and ignored the stimuli. Watching a movie keeps the subject passively engaged during the recording and prevents the subject from falling asleep.
Protocol 1: paired RREP trial, paired air puff MEP trial, and paired SEP trial.
Twenty subjects (10 women and 10 men) participated in the RREP trial. Thirteen of the 20 subjects participated in all trials (RREP, MEP, and SEP). The RREP was the first trial, and the sequence of the following MEP and SEP trials was randomized. For the RREP trial, the subject was prepared as described above, seated in the sound-isolated room, and respired through the nonrebreathing valve with the nose obstructed by a clip. The subject was instructed to respire as normally as possible. Subjects were informed that their breathing would be occasionally obstructed for a very brief time. The duration of each occlusion was ∼150 ms with an ISI of 500 ms. The paired occlusion presentation was initiated manually. Activation of the occlusion trigger closed the occlusion valve for 150 ms. The occlusion valve then reopened for 500 ms, followed by a second 150-ms closure of the inspiratory port. The total duration of the paired occlusion presentation was 800 ms and occurred within a single inspiratory effort for all presentations and all subjects. The paired occlusions were applied every two to six breaths for a total of 100 paired occlusions for RREP analysis. This trial required approximately 40–60 min.
For the MEP trial, the mouth was stimulated with positive-pressure air puffs delivered bilaterally to the buccal surface of the cheeks at the level of the third molar. The air puff was delivered via a 2.5-mm outer diameter (OD), 2.0-mm inner diameter (ID) tube anchored in the mouthpiece. The end of the tube was ∼0.5 cm lateral to the molar. The other end of the tube was connected to the positive-pressure source, regulated at ∼20 cmH2O. Air puffs were delivered simultaneously, bilaterally to the buccal surface on inspiration. The first air puff was applied at the onset of the airflow for a duration of 150 ms. The ISI was 500 ms, followed by the second 150-ms air puff. A total of 256 air puff pairs was recorded for MEP analysis. This trial required approximately 20–40 min.
For the SEP trial, the subject's right hand was placed in a fixed position in a foam chamber with a 2.5-mm OD, 2.0-mm ID tube oriented to the dorsal surface of the hand. Air puffs were delivered at a positive pressure of ∼20 cmH20. The open end of the tube was ∼0.5 cm from the surface of the skin, and the other end was connected to the positive-pressure source. The hand and tube were screened from the subject's view. The first air puff was applied for a duration of 150 ms. The ISI was 500 ms followed by the second 150-ms air puff. A total of 512 air puff pairs was recorded for SEP analysis. The paired air puffs were delivered every 3 s. This trial required ∼30 min. The differences in number of stimuli for each modality (RREP = 100, MEP = 256, and SEP = 512) standardized the duration of the stimulation trial time based on subject's tolerance level for breathing on a mouthpiece.
Protocol 2: Paired- and late single occlusion-elicited RREP.
Seven of the 20 subjects (3 women and 4 men) participated in this protocol. The second protocol was performed to control for RREPs elicited by single occlusions applied at the same inspiratory times as the paired occlusions. There were two trials: 1) paired occlusions, and 2) single occlusion applied 650 ms after the onset of inspiratory airflow. This protocol tests the hypothesis that the RREP elicited by single occlusions presented at the onset of inspiration will not be significantly different from the RREP elicited by occlusions presented in late inspiratory phase. The S1 of the paired RREP was compared with the single occlusion presented at the same time in the inspiratory phase as S2.
The setup used in this protocol was the same as the previous paired RREP recordings. In trial 1, the subject was presented 100 paired occlusions, each pair separated by two to six breaths. In trial 2, the subject was presented 100 single occlusions (150-ms duration) 650 ms after the onset of inspiratory airflow, each presentation separated by two to six breaths. The subject was allowed a 10- to 15-min break between trials.
Data analysis.
An 1,100-ms epoch of the EEG activity, airflow, and Pm was sampled when the initial inspiratory obstruction was triggered. The data were stored on a disk for computer analysis (Signal 2, Cambridge Electronic Design). During offline data analysis, each data frame was reviewed, and the inclusion criteria for epochs were 1) the prestimulus EEG activity baseline (starting from 50 ms before the onset of the mouth pressure change) was stable, 2) no VEOG eyeblink activity, 3) no change of EEG activity exceeding 50 μV, and 4) there was a negative Pm change for both obstruction periods. Responses to the stimuli that were confounded by artifacts were excluded from analysis. A minimum of 64 occlusion epochs were averaged to obtain the RREP. A minimum of 130 and 350 air puff epochs were averaged to obtain the MEP and SEP, respectively. The peak latencies were measured from the time of the onset of the stimulus to the peak based on the onset of pressure change. The amplitudes were measured from the baseline to peak for each component. For the RREP trials, the definition of the component peaks was based on previous reports for peak localization (9, 47). The Nf peak was the negative peak occurring in the frontal F3 and F4 electrodes 25–45 ms after the stimulus. The P1 peak was the positive peak occurring in the central C3′ and C4′ electrodes 45–70 ms after the stimulus. The N1 peak was the negative peak occurring at the vertex Cz electrode 85–120 ms after the stimulus. The Nf, P1, and N1 peak latencies and amplitudes were identified in the first (S1) and second (S2) occlusions for the RREP trials. For the MEP and SEP trials, the P50 peak was the positive peak occurring in the central C3′ and C4′ electrodes 40–60 ms after the onset of the air puff stimulus. The N100 peak was the negative peak occurring at the vertex Cz electrode 90–110 ms after the onset of the air puff stimulus. The P50 and N100 peak latencies and amplitudes were identified for the first (S1) and second (S2) air puffs in the MEP and SEP trials.
The differences in latencies and amplitudes between S1 and S2 were compared for each peak independently for the RREP, MEP, and SEP. The statistical analysis was performed using the repeated measures one-way ANOVA (RMANOVA) with post hoc analysis to determine the effect of the paired stimuli. If the normality test failed, a Friedman RMANOVA on ranks was performed. The significance level was set at P < 0.05. For protocol 2, the latencies and the amplitudes of the S1 and S2 in the paired RREP and the late single obstruction-elicited RREP were compared using RMANOVA. Tukey post hoc analysis was performed for paired comparisons. The significance level was set at P < 0.05.
RESULTS
Protocol 1: paired occlusion-elicited RREP, air puff MEP, and SEP.
The occlusion pairs occurred within the same inspiratory phase for all subjects (Fig. 1A). There was no significant difference in the change of mouth pressure for S1 and S2 occlusions (Table 1). The S1 occlusion elicited the Nf peak in the frontal region, the P1 peak in the central region, and the N1 peak at the vertex (Fig. 1B). The S2 occlusion elicited the same peaks (Fig. 1B) with no significant difference in peak latencies (Table 1). The S2 peak amplitudes (Table 2) for Nf, P1, and N1 peaks were significantly less than S1 (Fig. 2A). The S2/S1 ratios for Nf were 0.84 ± 0.29 and 0.81 ± 0.33 for F3 and F4, respectively. The S2/S1 ratios for P1 were 0.61 ± 0.27 and 0.65 ± 0.26 in the C3′ and C4′ channels, respectively. The ratio for the N1 peak was 0.43 ± 0.28. The S2/S1 ratio for the N1 peak was significantly less than Nf (df = 4, chi square = 19.5) but not significantly different from P1. The S2/S1 ratio for P1 was also not significantly different from Nf.
Fig. 1.
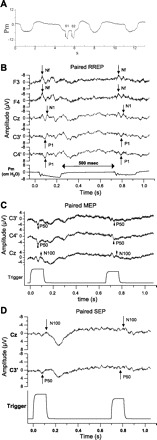
A: mouth pressure with paired inspiratory occlusions (S1 and S2) for an individual subject. Both occlusions occurred within a single inspiratory cycle. Ordinate is the Pm change (in cmH2O), and abscissa is the time course (in s). B: the averaged respiratory-related evoked potentials (RREPs) elicited with paired occlusions for an individual subject. The interstimulus interval (ISI) was 500 ms. The Nf peaks are presented in the F3 and F4 channels, the N1 peak is presented in the Cz channel, and the P1 peaks are presented in the C3′ and C4′ channels. The bottom trace is the averaged Pm. C: the averaged mouth-evoked potential (MEP) trace elicited by paired air puff stimulation to the bilateral buccal surface of the cheeks. The P50 peak was presented in the C3′ and C4′ channels, and the N100 peak was identified in the Cz channel. The bottom trace is the trigger channel used as the reference for measuring the peak latencies. D: the averaged somatosensory-evoked potential (SEP) trace elicited by paired air puff stimulation to the right dorsal hand. The P50 peak was represented contralaterally in the C3′ channel, and the N100 peak was identified at the Cz channel. The bottom trace is the trigger channel used as the reference for measuring the peak latencies.
Table 1.
Averaged Pm change, and RREP, MEP, and SEP peak latencies
| S1 (n = 20) | S2 (n = 20) | Late (n = 7) | |
|---|---|---|---|
| Pm change, cmH2O | 4.83±1.73 | 5.00±1.29 | 5.68±1.36 |
| RREP latencies, ms | |||
| Nf peak | 43.76±3.68 | 43.88±3.59 | 44.02±3.43 |
| P1 peak | 63.22±9.17 | 62.74±6.04 | 55.91±5.46 |
| N1 peak | 109.42±23.76 | 117.25±22.35 | 97.76±14.02 |
| MEP latencies, ms | |||
| P50 peak | 63.72±11.49 | 67.33±10.61 | |
| N100 peak | 85.23±20.06 | 84.07±20.46 | |
| SEP latencies, ms | |||
| P50 peak | 58.24±9.17 | 61.65±11.18 | |
| N100 peak | 96.06±13.53 | 98.00±14.15 |
Values are means ± SD. Pm, mouth pressure; RREP, respiratory-related evoked potential; MEP, mouth-evoked potential (mouth air puff trial); SEP, somatosensory evoked potential (hand air puff trial); S1 and S2 are the first and second of the paired stimuli, respectively. Late is the single late inspiratory occlusion elicited RREP.
Table 2.
Averaged RREP, MEP, and SEP peak amplitudes
| S1 | S2 | |
|---|---|---|
| RREP amplitudes, μV | ||
| Nf peak | ||
| F3 | −5.59±2.05 | −4.47±1.76* df=1, chi-square=15.98 |
| F4 | −5.82±2.30 | −4.44±1.86* df=1, chi-square=12.80 |
| P1 peak | ||
| C3′ | 2.59±1.92 | 1.42±1.06* df=1, chi-square=16.20 |
| C4′ | 2.77±2.10 | 1.56±1.01* df=1, chi-square=12.80 |
| N1 peak Cz | −4.28±2.49 | −2.03±2.03* df=1, chi-square=20.00 |
| MEP amplitudes, μV | ||
| P50 peak | ||
| C3′ | 1.60±1.13 | 0.82±0.49* df=1, F =11.16 |
| C4′ | 1.43±1.04 | 0.79±0.70* df=1, chi-square=9.31 |
| N100 peak Cz | −1.65±0.90 | −0.89±0.65* df=1, chi-square=9.31 |
| SEP amplitudes, μV | ||
| P50 peak C3′ | +1.02±0.49 | +0.56±0.4* df=1, F=29.59 |
| N100 peak Cz | −1.47±1.01 | −0.72±0.52* df =1, chi-sqare =13.00 |
Values are means ± SD.
Significant difference between S1 and S2 (P < 0.05).
Fig. 2.
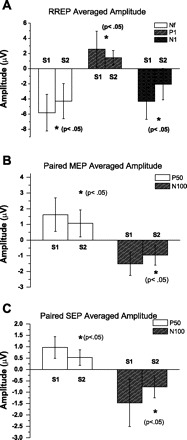
A: group averaged RREP Nf, P1, and N1 peak amplitudes (mean ± SD) for S1 and S2. The Nf peak amplitude for S1 and S2 is for the F4 channel. The P1 peak amplitude for S1 and S2 is for the C4′ channel. The N1 peak amplitude for S1 and S2 is for the Cz channel. *Significant difference (P < 0.05) between S1 and S2 for each peak. There was a significant reduction of the S2 amplitude for Nf, P1, and N1 peaks. B: group averaged MEP P50 and N100 peak amplitudes (mean ± SD) for S1 and S2. The P50 peak amplitude for S1 and S2 is for the C3′ channel. The N100 peak amplitude for S1 and S2 is for the Cz channel. *Significant difference (P < 0.05) between S1 and S2 for each peak. There was a significant reduction of the S2 amplitude for P50 and N100 peaks. C: group averaged SEP P50 and N100 peak amplitudes (mean ± SD) for S1 and S2. The P50 peak amplitude for S1 and S2 is for the C3′ channel. The N100 peak amplitude for S1 and S2 is for the Cz channel. *Significant difference (P < 0.05) between S1 and S2 for each peak. There was a significant reduction of the S2 amplitude for P50 and N100 peaks.
The S1 air puff presented to the buccal surface of the mouth elicited a P50 peak bilaterally at C3′ and C4′ in the central region, and an N100 peak at the Cz vertex (Fig. 1C). The S2 air puff elicited the same peaks (Fig. 1C) with no significant difference in peak latencies (Table 1). The S2 peak amplitudes for P50 and N100 peaks were significantly (Table 2) less than S1 (Fig. 2B). The S2/S1 ratios for P50 peak were 0.57 ± 0.31 and 0.54 ± 0.29 for the C3′ and C4′ channels, respectively; S2/S1 ratio for the N100 peak was 0.49 ± 0.21.
The S1 air puff presented to the hand elicited a P50 peak in the contralateral C3′ central region, and an N100 peak at the Cz vertex (Fig. 1D). The S2 air puff elicited the same peaks (Fig. 1D) with no significant difference in peak latencies (Table 1). The S2 peak amplitudes for P50, and N100 peaks were significantly (Table 2) less than S1 (Fig. 2C). The S2/S1 ratios for P50 peak were 0.52 ± 0.34 for the C3′ channel. The S2/S1 ratio for the N100 peak in the Cz channel was 0.49 ± 0.22. There was no significant difference between the S2/S1 ratio for the N1 and N100 peaks of the RREP, MEP, and SEP (Fig. 3).
Fig. 3.
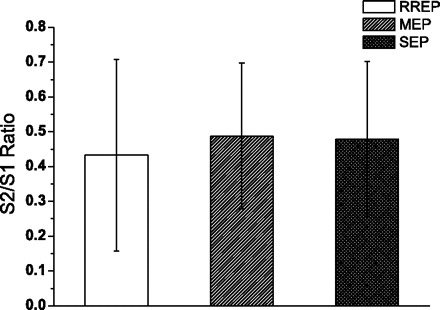
Group averaged (mean ± SD) S2/S1 ratio of the RREP N1, MEP N100, and SEP N100 peaks. There were no significant differences.
Protocol 2: early and late inspiratory obstruction elicited RREP (n = 7).
The maximal Pm change for S1, S2 and the single late inspiratory occlusions were not significantly different (Table 1). The mean latencies for Nf, P1, and N1 peaks were not significantly different between S1, S2, and single late inspiratory occlusions (Table 1). There was no significant difference between Nf, P1, and N1 peak amplitudes for the S1 and single late inspiratory occlusions (Fig. 4). The S1 and late single inspiratory peak amplitudes were significantly greater than S2 for the Nf (P < 0.05; df = 2, F = 7.466 and 6.235 in the F3 and F4 channels, respectively), P1 (P < 0.05; df = 2, F = 6.967 in the C3′ channel), and N1 peak (P < 0.05; df = 2, chi square = 10.571 in the Cz channel) (Fig. 4).
Fig. 4.
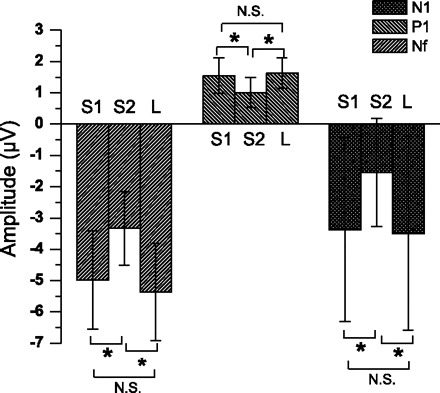
Group averaged (mean ± SD) RREP Nf, P1, and N1 peak amplitudes for the S1, S2, and late (L) inspiratory occlusion in 7 subjects. The averaged Nf amplitudes for S1, S2, and L are for the F3 channel. The averaged P1 amplitudes for S1, S2, and L are for the C3′ channel. The averaged N1 amplitudes for S1, S2, and L are for the Cz channel. *Significantly greater than S2 (P < 0.05) peak amplitude for S1 and L. NS, not significant.
DISCUSSION
The results of this study demonstrated that the paired inspiratory obstruction paradigm with a 500-ms ISI can be presented within a single inspiration and elicits RREPs for both S1 and S2. The pressure stimulus is the same for S1 and S2, suggesting that any difference in RREP amplitudes was a function of neural processing, not stimulus magnitude. The S2 occlusion resulted in a decrease in RREP peak amplitudes that was specific to the presence of the S1 stimulus. The RREP was measured to test respiratory sensory gating, whereas the MEP and SEP were measured to compare central neural gating in different modalities. The MEP provides evoked potential results for specific mechanoreceptors in the mouth, which is a component of extrathoracic air conducting pathway. The hand SEP provides evoked potential results for nonrespiratory mechanoreceptors. Stimulation of all three mechanoreceptor modalities elicited somatosensory evoked potentials. The RREP paired occlusion response was similar to the other somatosensory modalities (i.e., mouth and hand). The S2/S1 ratio was similar across all modalities and consistent with the gating of mechanoreceptor activation of the cerebral cortex.
The ISI of 500 ms was used because this duration was demonstrated in auditory and somatosensory modalities as the optimum ISI for paired stimuli paradigms (5, 24). It is apparent that the 500-ms interval is short enough to accommodate two stimuli in one inspiratory cycle and also long enough for the cortex to generate the second RREP. Paired acoustic stimulation paradigms have shown that ISI equal to or greater than 6 s results in almost no inhibition of the S2 evoked potential response (2, 50). A shorter than 500-ms ISI may result in greater inhibition of the S2 RREP response.
The S2 RREP response had a smaller amplitude than S1 with equal stimulus magnitude. The S2 RREP response cannot be a result of different inspiratory occlusion stimulus magnitudes because there was no difference in the Pm change (Table 1). The S2 RREP response also cannot be a result of the presentation time within the inspiratory cycle because the Pm and RREP peak amplitudes were not significantly different from S1 when single occlusions were presented at the same time in the breath phase as S2. Our findings indicated that the RREP Nf, P1, and N1 peaks were present with the same latencies for S1 and S2, and only the amplitudes were significantly reduced for S2. This suggests that with the same stimulation modality (i.e., inspiratory interruption), the time required for cortical neuronal activation was also the same for S1 and S2. This means that the decreased RREP peak amplitudes for S2 were due to the central neural response to the preceding S1 occlusion.
The RREP N1 and SEP N100 peaks in this study are consistent with the results reported previously (19, 36). The auditory-evoked response (AEP) and SEP N100 peaks have been extensively studied and are a negative voltage change occurring between 90 and 110 ms after the stimulus onset (5, 16, 33). The auditory N100 peak was suggested to be a marker for sensory adaptation and therefore has been used as a measure of gating (16). Previous studies have also demonstrated that paired auditory and somatosensory stimuli elicited decreased S2 N100 peak amplitude, indicating sensory habituation of the S2 response (5, 33). The N1 peak is consistently observed in the RREP studies and is similar in latency and scalp location to the auditory and somatosensory N100 peaks (9). The reduction of the S2 RREP N1 peak and the SEP N100 peak amplitudes in this study suggests that respiratory sensory gating is similar to cutaneous somatosensory gating.
The RREP P1 peak was reported to be indicative of sensory information arrival in the somatosensory cortex (9). This peak has been consistently observed in RREP studies and is similar to the P50 peak of the SEP (8, 11, 25, 26, 49). The P50 peak has been used extensively to investigate central neural gating in AEPs (3, 5, 6, 15, 16, 31, 33). The P50 peak was consistently shown to have reduced amplitudes for the S2 in normal adults when applying paired auditory stimulation paradigms. In this study, the S2 P1 and P50 peak amplitudes were reduced in all modalities, confirming that the signals that arrived in the somatosensory cortex were attenuated, suggesting central neural gating. While the RREP P1 peak amplitude in this study was reduced for S2 occlusions, the percent decrease in S2 P1 amplitude was less than for the RREP N1 peak. This suggests that the S1 conditioning occlusion has a greater modulation of the N1 peak than the P1 peak. This may be due to N1 representing perceptual neural mechanism (2nd-order processing) while P1 represents primary somatosensory cortical activation.
The Nf is a unique peak observed in the RREP but not in the cutaneous SEP (Fig. 1, C and D). Investigators have suggested that this frontal peak is elicited by a parallel sensory projection to the premotor cortex (9, 28). In the present study, the S2 Nf peak amplitude was weakly affected by the S1 conditioning occlusion (i.e., S2/S1 ratio is greater than 0.8). The result of this study supports the suggestion that the activation of the premotor cortex by respiratory mechanoreceptor stimuli is less inhibited by preceding afferent activation than the somatosensory cortex. The throughput of the S2 sensory information is gated into the somatosensory cortex (P1) and weakly gated into the frontal premotor cortex (Nf). However, the neuromechanisms mediating the generation of the Nf peak are unknown, and hence the reason for a higher Nf ratio (compared with P1 and N1 ratios) remains unknown.
The mouth air puffs used in the MEP are the same type of direct mechanical stimulation as skin air puff in the SEP. The MEP P50 and N100 peaks reported in this study were similar to the SEP in latencies and amplitudes. The MEP and SEP represent similar activation in the somatosensory cortex. The reduced amplitude of S2 N100 peaks and the S2/S1 ratio in the paired MEP and SEP are consistent with central neural gating of mouth and skin somatosensory mechanosensation (5, 33).
The reduced S2 cortical activation in this study is probably due to an inhibitory effect of S1 at the subcortical level acting on the throughput of the second stimulus depending on the ISI. Although the neural anatomic site responsible for respiratory gating has not been investigated, some areas such as the hippocampus have been studied for auditory gating (20). Although the hippocampus is not the primary sensory processing area, this structure deals with interpreting the significance of sensory stimuli as well as memory formation. The hippocampus also orients the organism to its environment (39). Some studies suggest that the CA1 region of the hippocampus is responsible for determining what incoming sensory information is to be processed (23), while others did not find the CA1 region to be critical for sensory gating (44). In a paired stimulus paradigm, whether with respiratory, somatosensory, or acoustic stimuli, the fact that the response to the second stimulus decreases suggests that the brain undergoes a simple learning procedure to suppress perception of the redundant stimuli (35). With an animal model experiment, Freedman et al. (1996) also found complete suppression of the response of hippocampal pyramidal neuronal action potentials to the second acoustic stimulus (15).
Some studies have suggested the thalamus is the most likely candidate of the “gate” (4, 13, 17, 43). Aguilar and Castro-Alamancos (4) examined the receptive fields of single cells in the ventroposterior medial thalamus (VPM) of rats and found that the VPM is more responsive to a principal whisker and adjacent whiskers at aroused states. Similarly, Zhang and Davenport (48) have reported that the ventroposterior lateral (VPL) thalamus is activated when respiratory mechanoreceptors are stimulated but not during spontaneous breathing. In addition, Davenport et al. (8) reported that the RREP is only present when respiratory stimulation (e.g., load) is above the detection threshold of the subject. The above evidence has suggested that a gate existed to filter information from the brain stem to higher cortical centers for sensory awareness. This study, using paired stimuli, demonstrated that temporal sensory gating is present for respiratory loads. In somatosensory information processing, incoming stimuli reach the thalamus, which projects to the amygdala and the sensory cortex (21, 37, 42). The sensory cortex also has projections to the hippocampus and amygdala to generate emotional responses and subsequent behaviors. It is known the amygdala also has projections to the thalamus or sensory cortex (27, 41). It has been demonstrated that emotional status and habituation can modulate sensory gating (5, 18). The fact that the amygdala and the hippocampus are closely related to emotion, learning, and memory suggests that the limbic system can mediate sensory gating before the information arrives in the somatosensory cortex.
Mechanosensory information is relayed by peripheral mechanoreceptors through the brain stem and subcortical levels to the cortex. Acoustic stimuli paired with tactile stimuli demonstrated that acoustic prepulse inhibition is not due to instrinsic refractory period (33). The reduced S2 peak amplitudes cannot be a function of inhibition at the cortical level because no corresponding neural activation was observed at the cortical level in the RREP, MEP, and SEP waveforms. An explanation for reduced S2 peak amplitudes in the paired stimulation paradigm is that the subcortical level will undergo a refractory period immediately after a stimulus is relayed to the cortex. This may be done by inhibitory control of the cortical synapses at the subcortical level. Once the subcortical neurons recover, they can be activated again. The next sensory stimulus can be perceived fully by the cortex. If the second sensory stimulus is given too soon after the first stimulus, the impulse may be inhibited. The present study investigated the temporal phase of central neural respiratory gating (i.e., stimulus frequency). However, sensory gating may also be affected by stimulus intensity. The S1 and S2 stimulus intensities were not varied in this study. It is possible that a change in S1 or S2 magnitude may modulate peak amplitudes of the paired evoked potentials.
Deficits in sensory gating represented by altered S2/S1 ratios have not been studied in respiratory sensation. Excessive respiratory gating may be one explanation why a subpopulation of children with life-threatening asthma lack the RREP P1 peak (10, 14, 32). This lack of sensory information arrival in the cortex suggested an altered central neural processing of respiratory neural information (10, 14). The sensory information may have been transduced from the afferent systems through the brain stem to the subcortical level; however, the information was filtered out of the cortex and not cognitively perceived. This suggests that the subgroup of children with life-threatening asthma have a deficit for “gating in” respiratory-related sensory information. Reduced sensory gating, increased S2/S1 ratio, has been reported in patients that experienced sensory flooding (20). Patients with anxiety disorders have been reported to have an increased S2/S1 ratio for auditory and somatosensory P50 and N100 peaks (29, 31). Patients with chronic respiratory diseases such as asthma have been reported to have an increased incidence of anxiety disorders (22, 38). This suggests an increased S2/S1 ratio for the RREP P1 and N1 peaks may be a marker of respiratory-related anxiety disorders. This remains to be investigated.
Footnotes
The costs of publication of this article were defrayed in part by the payment of page charges. The article must therefore be hereby marked “advertisement” in accordance with 18 U.S.C. Section 1734 solely to indicate this fact.
REFERENCES
- 1.Adler LE, Olincy A, Waldo M, Harris JG, Griffith J, Stevens K, Flach K, Nagamoto H, Bickford P, Leonard S, Freedman R. Schizophrenia, sensory gating, and nicotinic receptors. Schizophr Bull 24: 189–202, 1998. [DOI] [PubMed] [Google Scholar]
- 2.Adler LE, Pachtman E, Franks RD, Pecevich M, Waldo MC, Freedman R. Neurophysiological evidence for a defect in neuronal mechanisms involved in sensory gating in schizophrenia. Biol Psychiatry 17: 639–654, 1982. [PubMed] [Google Scholar]
- 3.Adler LE, Waldo MC, Freedman R. Neurophysiologic studies of sensory gating in schizophrenia: comparison of auditory and visual responses. Biol Psychiatry 20: 1284–1296, 1985. [DOI] [PubMed] [Google Scholar]
- 4.Aguilar JR, Castro-Alamancos MA. Spatiotemporal gating of sensory inputs in thalamus during quiescent and activated states. J Neurosci 25: 10990–11002, 2005. [DOI] [PMC free article] [PubMed] [Google Scholar]
- 5.Arnfred SM, Eder DN, Hemmingsen RP, Glenthoj BY, Chen AC. Gating of the vertex somatosensory and auditory evoked potential P50 and the correlation to skin conductance orienting response in healthy men. Psychiatry Res 101: 221–235, 2001. [DOI] [PubMed] [Google Scholar]
- 6.Boutros N, Nasrallah H, Leighty R, Torello M, Tueting P, Olson S. Auditory evoked potentials, clinical vs. research applications. Psychiatry Res 69: 183–195, 1997. [DOI] [PubMed] [Google Scholar]
- 7.Chou YL, Davenport PW. The effect of increased background resistance on the resistive load threshold for eliciting the respiratory-related evoked potential. J Appl Physiol 103: 2012–2017, 2007. [DOI] [PubMed] [Google Scholar]
- 8.Davenport PW, Chan PY, Zhang W, Chou YL. Detection threshold for inspiratory resistive loads and respiratory-related evoked potentials. J Appl Physiol 102: 276–285, 2007. [DOI] [PubMed] [Google Scholar]
- 9.Davenport PW, Colrain IM, Hill PM. Scalp topography of the short-latency components of the respiratory-related evoked potential in children. J Appl Physiol 80: 1785–1791, 1996. [DOI] [PubMed] [Google Scholar]
- 10.Davenport PW, Cruz M, Stecenko AA, Kifle Y. Respiratory-related evoked potentials in children with life-threatening asthma. Am J Respir Crit Care Med 161: 1830–1835, 2000. [DOI] [PubMed] [Google Scholar]
- 11.Davenport PW, Friedman WA, Thompson FJ, Franzen O. Respiratory-related cortical potentials evoked by inspiratory occlusion in humans. J Appl Physiol 60: 1843–1848, 1986. [DOI] [PubMed] [Google Scholar]
- 12.Davenport PW, Hutchison AA. Cerebral cortical respiratory-related evoked potentials elicited by inspiratory occlusion in lambs. J Appl Physiol 93: 31–36, 2002. [DOI] [PubMed] [Google Scholar]
- 13.de Carvalho LA. Modeling the thalamocortical loop. Int J Biomed Comput 35: 267–296, 1994. [PubMed] [Google Scholar]
- 14.Fauroux B, Renault F, Boelle PY, Donzel-Raynaud C, Nicot F, Clement A, Straus C, Similowski T. Impaired cortical processing of inspiratory loads in children with chronic respiratory defects. Respir Res 8: 61, 2007. [DOI] [PMC free article] [PubMed] [Google Scholar]
- 15.Freedman R, Adler LE, Myles-Worsley M, Nagamoto HT, Miller C, Kisley M, McRae K, Cawthra E, Waldo M. Inhibitory gating of an evoked response to repeated auditory stimuli in schizophrenic and normal subjects. Human recordings, computer simulation, and an animal model. Arch Gen Psychiatry 53: 1114–1121, 1996. [DOI] [PubMed] [Google Scholar]
- 16.Fruhstorfer H, Soveri P, Jarvilehto T. Short-term habituation of the auditory evoked response in man. Electroencephalogr Clin Neurophysiol 28: 153–161, 1970. [DOI] [PubMed] [Google Scholar]
- 17.Gaudreau JD, Gagnon P. Psychotogenic drugs and delirium pathogenesis: the central role of the thalamus. Med Hypotheses 64: 471–475, 2005. [DOI] [PubMed] [Google Scholar]
- 18.Grunwald T, Boutros NN, Pezer N, von Oertzen J, Fernandez G, Schaller C, Elger CE. Neuronal substrates of sensory gating within the human brain. Biol Psychiatry 53: 511–519, 2003. [DOI] [PubMed] [Google Scholar]
- 19.Huang CH, Martin AD, Davenport PW. Effect of inspiratory muscle strength training on inspiratory motor drive and RREP early peak components. J Appl Physiol 94: 462–468, 2003. [DOI] [PubMed] [Google Scholar]
- 20.Javanbakht A. Sensory gating deficits, pattern completion, and disturbed fronto-limbic balance, a model for description of hallucinations and delusions in schizophrenia. Med Hypotheses 67: 1173–1184, 2006. [DOI] [PubMed] [Google Scholar]
- 21.Kaitz SS, Robertson RT. Thalamic connections with limbic cortex. II. Corticothalamic projections. J Comp Neurol 195: 527–545, 1981. [DOI] [PubMed] [Google Scholar]
- 22.Katon WJ, Richardson L, Lozano P, McCauley E. The relationship of asthma and anxiety disorders. Psychosom Med 66: 349–355, 2004. [DOI] [PubMed] [Google Scholar]
- 23.Kiernan JA, Barr ML. Barr's The Human Nervous System: An Anatomical Viewpoint. Baltimore, MD: Lippincott, Williams, and Wilkins, 2005, p. viii.
- 24.Kisley MA, Olincy A, Freedman R. The effect of state on sensory gating: comparison of waking, REM and non-REM sleep. Clin Neurophysiol 112: 1154–1165, 2001. [DOI] [PubMed] [Google Scholar]
- 25.Knafelc M, Davenport PW. Relationship between magnitude estimation of resistive loads, inspiratory pressures, and the RREP P1 peak. J Appl Physiol 87: 516–522, 1999. [DOI] [PubMed] [Google Scholar]
- 26.Knafelc M, Davenport PW. Relationship between resistive loads and P1 peak of respiratory-related evoked potential. J Appl Physiol 83: 918–926, 1997. [DOI] [PubMed] [Google Scholar]
- 27.Krettek JE, Price JL. Projections from the amygdaloid complex to the cerebral cortex and thalamus in the rat and cat. J Comp Neurol 172: 687–722, 1977. [DOI] [PubMed] [Google Scholar]
- 28.Logie ST, Colrain IM, Webster KE. Source dipole analysis of the early components of the RREP. Brain Topogr 11: 153–164, 1998. [DOI] [PubMed] [Google Scholar]
- 29.Ludewig S, Ludewig K, Geyer MA, Hell D, Vollenweider FX. Prepulse inhibition deficits in patients with panic disorder. Depress Anxiety 15: 55–60, 2002. [DOI] [PubMed] [Google Scholar]
- 30.Naatanen R, Picton T. The N1 wave of the human electric and magnetic response to sound: a review and an analysis of the component structure. Psychophysiology 24: 375–425, 1987. [DOI] [PubMed] [Google Scholar]
- 31.Neylan TC, Fletcher DJ, Lenoci M, McCallin K, Weiss DS, Schoenfeld FB, Marmar CR, Fein G. Sensory gating in chronic posttraumatic stress disorder: reduced auditory P50 suppression in combat veterans. Biol Psychiatry 46: 1656–1664, 1999. [DOI] [PubMed] [Google Scholar]
- 32.Nicot F, Renault F, Clement A, Fauroux B. Respiratory-related evoked potentials in children with asthma. Neurophysiol Clin 37: 29–33, 2007. [DOI] [PubMed] [Google Scholar]
- 33.Perlstein WM, Simons RF, Graham FK. Prepulse effects as a function of cortical projection system. Biol Psychol 56: 83–111, 2001. [DOI] [PubMed] [Google Scholar]
- 34.Perry W, Minassian A, Feifel D, Braff DL. Sensorimotor gating deficits in bipolar disorder patients with acute psychotic mania. Biol Psychiatry 50: 418–424, 2001. [DOI] [PubMed] [Google Scholar]
- 35.Petrinovich L, Peeke HV. Habituation to territorial song in the White-crowned sparrow (Zonotrichia leucophrys). Behav Biol 8: 743–748, 1973. [DOI] [PubMed] [Google Scholar]
- 36.Revelette WR, Davenport PW. Effects of timing of inspiratory occlusion on cerebral evoked potentials in humans. J Appl Physiol 68: 282–288, 1990. [DOI] [PubMed] [Google Scholar]
- 37.Robertson RT, Kaitz SS. Thalamic connections with limbic cortex. I. Thalamocortical projections. J Comp Neurol 195: 501–525, 1981. [DOI] [PubMed] [Google Scholar]
- 38.Roy-Byrne PP, Davidson KW, Kessler RC, Asmundson GJ, Goodwin RD, Kubzansky L, Lydiard RB, Massie MJ, Katon W, Laden SK, Stein MB. Anxiety disorders and comorbid medical illness. Gen Hosp Psychiatry 30: 208–225, 2008. [DOI] [PubMed] [Google Scholar]
- 39.Sadock BJ, Sadock VA, Kaplan HI, Ovid Technologies Inc. Kaplan & Sadock's comprehensive textbook of psychiatry Lippincott Williams & Wilkins.
- 40.Spencer CM, Serysheva E, Yuva-Paylor LA, Oostra BA, Nelson DL, Paylor R. Exaggerated behavioral phenotypes in Fmr1/Fxr2 double knockout mice reveal a functional genetic interaction between Fragile X-related proteins. Hum Mol Genet 15: 1984–1994, 2006. [DOI] [PubMed] [Google Scholar]
- 41.Sripanidkulchai K, Sripanidkulchai B, Wyss JM. The cortical projection of the basolateral amygdaloid nucleus in the rat: a retrograde fluorescent dye study. J Comp Neurol 229: 419–431, 1984. [DOI] [PubMed] [Google Scholar]
- 42.Staines WR, Black SE, Graham SJ, McIlroy WE. Somatosensory gating and recovery from stroke involving the thalamus. Stroke 33: 2642–2651, 2002. [DOI] [PubMed] [Google Scholar]
- 43.Tran TD, Hoshiyama M, Inui K, Kakigi R. Electrical-induced pain diminishes somatosensory evoked magnetic cortical fields. Clin Neurophysiol 114: 1704–1714, 2003. [DOI] [PubMed] [Google Scholar]
- 44.van Luijtelaar G, Fabene PF, de Bruin N, Jongema C, Ellenbroek BA, Veening JG. Neural correlates of sensory gating in the rat: decreased Fos induction in the lateral septum. Brain Res Bull 54: 145–151, 2001. [DOI] [PubMed] [Google Scholar]
- 45.Webster KE, Colrain IM. P3-specific amplitude reductions to respiratory and auditory stimuli in subjects with asthma. Am J Respir Crit Care Med 166: 47–52, 2002. [DOI] [PubMed] [Google Scholar]
- 46.Webster KE, Colrain IM. The respiratory-related evoked potential: effects of attention and occlusion duration. Psychophysiology 37: 310–318, 2000. [PubMed] [Google Scholar]
- 47.Webster KE, Colrain IM, Davenport PW. P300 from inspiratory occlusion reflects orienting but not startle. Biol Psychol 66: 21–33, 2004. [DOI] [PubMed] [Google Scholar]
- 48.Zhang W, Davenport PW. Activation of thalamic ventroposteriolateral neurons by phrenic nerve afferents in cats and rats. J Appl Physiol 94: 220–226, 2003. [DOI] [PubMed] [Google Scholar]
- 49.Zhao W, Martin AD, Davenport PW. Respiratory-related evoked potentials elicited by inspiratory occlusions in double-lung transplant recipients. J Appl Physiol 93: 894–902, 2002. [DOI] [PubMed] [Google Scholar]
- 50.Zouridakis G, Boutros NN. Stimulus parameter effects on the P50 evoked response. Biol Psychiatry 32: 839–841, 1992. [DOI] [PubMed] [Google Scholar]