Abstract
In the present study, we evaluated the effect of short term hyperglycemia on renal lesions in a mouse model (Tg26) of HIV-associated nephropathy (HIVAN). Control and Tg26 mice in groups (n=6) were administered either normal saline (FVBN or Tg) or streptozotocin (FVBN+STZ or Tg26 + STZ). After two weeks, biomarkers were collected and kidneys were harvested. FVBN+ STZ and Tg26 + STZ displayed elevated serum glucose levels when compared to FVBN and Tg26 respectively. Tg26 +STZ displayed elevated (P<0.05) blood urea nitrogen (BUN) levels (P<0.05) and enhanced (P<0.01) proteinuria when compared to Tg26. Tg26 + STZ displayed enhanced (P<0.001) number of sclerotic glomeruli and microcysts vs. Tg26. Renal tissues of Tg26 displayed down regulation of vitamin D receptor (VDR) expression and enhanced Ang II production when compared to FVBN mice. Hyperglycemia exacerbated down regulation of VDR and production of Ang II in FVBN and Tg mice. Hyperglycemia increased kidney cell reactive oxygen species (ROS) production and oxidative DNA damage in both FVBN and Tg26 mice. In in vitro studies, HIV down regulated podocyte VDR expression and also enhanced renin angiotensin system activation. In addition, both glucose and HIV stimulated kidney cell ROS generation and DNA damage and compromised DNA repair; however, tempol (superoxide dismutase mimetic), losartan (Ang II blocker) and EB1089 (VDR agonist) provided protection against DNA damaging effects of glucose and HIV. These findings indicated that glucose activated the RAS and inflicted oxidative stress-mediated DNA damage via down regulation of kidney cell VDR expression in HIV milieu both in vivo and in vitro.
HIV-associated nephropathy (HIVAN) has been considered to be the manifestation of specific genetic (Apol1), environmental (HIV infection) and host factors (1, 16, 25, 31). Although the presence of Apol1 gene is associated with idiopathic focal segmental glomerulosclerosis, global glomerulosclerosis (related to hypertension) not all Apol1 positive HIV-infected patients develop kidney disease (26). Thus, it appears that there may be other contributing factors such as the activation of renin angiotensin system in the development of glomerulosclerosis (17). Since glucose has been reported to activate the renin angiotensin system in kidney cells (11), we asked whether it has potential to exacerbate kidney cell injury in HIVAN.
Patients with HIV infection on highly active retroviral therapy are able to maintain zero viral load (13). However, occurrence of insulin resistance and the development of clinical diabetes has been reported increase with the use of protease inhibitors (PIs) (32, 36). Experimental in vitro and in vivo studies also demonstrated that PIs induced impairment of the glucose transporter Glut 4 and of glucose sensing in β-islet cells (19, 33). In clinical studies, a 7% incidence of new-onset diabetes was found in AIDS patients when oral glucose tolerance test was used (4); however, only 3.3% diabetes was recorded when conventional parameters were used (10) In a 4-year cohort study, men receiving highly active anti-retroviral therapy (HAART) had a >4-fold increased risk of displaying diabetes when compared to HIV sero-negative men; nonetheless, discontinuation of PIs caused reversal of hyperglycemia (23). All these studies indicate that patients with HIV infection on PIs are prone to develop hyperglycemia. Recently, Mallipattu et al., demonstrated that HIV transgene expression in kidney cells accelerated progression of diabetic nephropathy (22). Thus, if a patient with diabetic nephropathy gets HIV infection in kidney cells the prognosis is likely to be worse. We asked if HIVAN patients developed hyperglycemia would it also accelerate the course of HIVAN? The later scenario is more likely because patients with HIV infection are living longer and use of PIs causes this population vulnerable to develop hyperglycemia (32, 36).
Both glucose and HIV have been reported to activate renal cell renin angiotensin system in in vitro studies (5, 11, 30). Interestingly, the renin angiotensin system has also been reported to play an important role in the development and progression of diabetic nephropathy (DN) as well as HIVAN, both in animal experimental models of DN and HIVAN as well as in humans (3, 28). Both inhibition of the production of Ang II and blockade of its effect, have been reported to slow down the progression of renal lesions in experimental animal models of DN and HIVAN (3, 28). Therefore, both ACE inhibitors and ARBs are being used to treat patients of DN and HIVAN. We hypothesize that the development of hyperglycemia will further activate the renin angiotensin system in HIVAN patients and will thus accelerate kidney cell injury in HIVAN.
Patients with diabetes have been demonstrated to have low vitamin D levels (24). Emerging data suggest that majority of patients of HIV infection are also vitamin D deficient (18). Vitamin D3 works through vitamin D receptors (VDR). Binding of VDR with vit D3 stabilizes VDR, preventing its degradation (8). Moreover, binding of VDR with vit D3 translocates VDR to nuclear compartment, allowing it to act as a transcription factor for the required gene expression (6). On that account, patients with low serum vitamin D levels are likely to have lower kidney cell VDR expression. Recently, we demonstrated that HIV directly down regulates kidney cell VDR expression in both in vitro and in vivo studies (5, 30). We hypothesize that high glucose levels will further down regulate kidney cell VDR expression in HIV milieu. Since liganded VDR is a negative regulator of renin (21), both glucose and HIV-induced down regulated kidney cell VDR expression will be associated with the activated renin angiotensin state. Thus, hyperglycemia by down regulating vitamin D receptors in kidney cells, may act as an adverse host factor for the progression of kidney cell injury in HIVAN.
In the present study, we have evaluated the effect of hyperglycemia on kidney cell injury in a mouse model of HIVAN. In addition, we have studied the effect of HIV and high glucose milieus on podocyte VDR expression, activation of the ROS and oxidative DNA damage.
Materials and Methods
Tg26 mice
We have used age and sex matched FVB/N (control) and Tg26 (on FVB/N background) mice. Breeding pairs of FVBN mice were obtained from Jackson Laboratories (Bar Harbor, ME). Breeding pairs to develop Tg26 colonies were kindly gifted by Prof. Paul E. Klotman M.D., President and CEO, Baylor College of Medicine, Houston, TX). The Tg26 transgenic animal has the proviral transgene, pNL4-3: d1443, which encodes all the HIV-1 genes except gag and pol and therefore the mice are noninfectious. We are maintaining colonies of these mice in our animal facility. For genotyping, tail tips were clipped, DNA was isolated and PCR studies were carried out using following primers for Tg26.
HIV-F 5′ ACATGAGCAGTCAGTTCTGCCGCAGAC
HIV-R 3′ CAAGGACTCTGATGCGCAGGTGTG
The Ethics Review Committee for Animal Experimentation of Long Island Jewish Medical Center approved the experimental protocol.
Experimental protocol
Four weeks old age and sex matched control and Tg26 mice in groups (n=6) were either administered normal saline (C/NS or Tg/NS) or streptozotocin (150 mg/Kg, intraperitoneal, single injection; C/STZ or Tg/STZ). After 3 days blood was collected by tail puncture to measure serum glucose levels. At the end of two weeks, the animals were anesthetized (by inhalation of isoflurane and oxygen) and sacrificed (by a massive intraperitoneal dose of sodium pentobarbital). After euthanization, blood was collected by a cardiac puncture. Both kidneys were excised; one was processed for histological and immunohistochemical studies while the other was used for RNA and protein extraction. Three-micrometer sections were prepared and stained with hematoxylin-eosin and periodic acid Schiff.
Renal disease biomarkers
Three primary phenotypes related to renal disease were characterized: blood urea, proteinuria (urinary protein/creatinine ratio), and renal histology. Proteinuria was measured by estimating urinary albumin: creatinine ratio by a kit supplied by Exocell, Philadelphia, PA.
Renal Histology
Renal cortical sections were stained with hematoxylin and eosin and Periodic Acid Schiff (PAS). Renal histology was scored for both tubular and glomerular injury. Renal cortical sections were coded and examined under light microscopy. Twenty random fields (20X)/mouse were examined to score percentage of the involved glomeruli and tubules. Glomerular lesions were classified as focal segmental glomerulosclerosis (FSGS), global glomerulosclerosis (GGS), and collapsing glomerulosclerosis (CGS). A semiquantitative scale; 0 = no disease, 1 = 1–25% of tissue showing abnormalities, 2 = 26–50% and 3 = >50% of tissue affected were used for scoring the mesangial expansion. Two investigators, unaware of the experimental conditions, scored severity of renal lesions.
In vivo ROS generation by kidney cells
Frozen kidney sections (8 μM) from control and Tg26 mice were stained with the redox sensitive probe dihydroethidium (DHE). Superoxide (O2-•) is the first product of the univalent reduction of O2. DHE detects O2-• production in mitochondria showing red fluorescence. DHE fluorescence was quantified using image J program (NIH, Bethesda, MD).
Preparation of podocytes
Human podocytes were obtained from Dr. Moin A. Saleem (Children’s renal unit and academic renal unit, University of Bristol, Southmead Hospital, Bristol, UK). Human podocytes were conditionally immortalized by introducing temperature-sensitive SV40- T antigen by transfection (29). The cells have additionally been transfected with a human telomerase construct (7). These cells proliferate at permissive temperature (33 °C, conditionally immortalized human podocytes, CIHP) and enter growth arrest (conditionally immortalized differentiated human podocytes, CIDHP) after transfer to the non-permissive temperature (37 °C). The growth medium contains RPMI 1640 supplemented with 10% fetal bovine serum (FBS), 1x Pen-Strep, 1 mM L-glutamine and 1x ITS (Invitrogen) to promote expression of T antigen.
Production of Pseudotyped Retroviral Supernatant
Replication defective viral supernatants were prepared as published previously (12). In brief, GFP reporter gene (from pEGFP-C1; Clontech, Palo Alto, CA) was substituted in place of gag/pol genes in HIV-1 proviral construct pNL4–3. This parental construct (pNL4-3: ΔG/P-GFP) was used to produce VSV.G pseudotyped viruses to provide pleiotropism and high-titer virus stocks. Infectious viral supernatants were produced by the transient transfection of 293T cells using Effectene (Qiagen Inc., Valencia, CA) according to the manufacturer’s instructions. The HIV-1 gag/pol and VSV.G envelope genes were provided in trans using pCMV R8.91 and pMD.G plasmids, respectively (gifts of Dr. Didier Trono, Salk Institute, La Jolla, CA). As a negative control, virus was also produced from pHR-CMV-IRES2-GFP-ΔB, which contained HIV-1 LTRs and GFP empty expression vector. The viral stocks were titrated by infecting HeLa tat cells with tenfold serial dilution as reported previously (12). The reciprocal of the lowest dilution showing expression of green fluorescence protein (GFP) was defined as GFP-expressing units (GEU) per ml. Viral stocks ranging from 105 to 106 GEU/ml were used.
Reverse Transcription PCR Analysis
Control and experimental renal tissue and podocyte lysates were used to quantify mRNA expression of molecules pertaining to VDR and renin. RNA was extracted using TRIZOL (Invitrogen corp.). For cDNA synthesis, 2 μg of the total RNA was preincubated with 2 nmol of random hexamer (Invitrogen Corp) at 65°C for 5 min. Subsequently, 8 μl of the reverse-transcription (RT) reaction mixture containing Cloned AMV RT, 0.5 mmol each of the mixed nucleotides, 10 mmol dithiothreitol, and 1000 U/mL Rnasin (Invitrogen Corp) was incubated at 42°C for 50 min. For a negative control, a reaction mixture without RNA or reverse transcription (RT) was used. Samples were subsequently incubated at 85°C for 5 min to inactivate the RT.
Quantitative PCR was carried out in an ABI Prism 7900HT sequence detection system using the primer sequences as shown below:
| Renin | 5 : GGCAGATTCAAATGAAGGGGGTGTC |
| 5: AGGCGAAGCCAATGCGGTTGTTAC | |
| Agt | 5: CTGGCCGAGCCCCAGGAGTTCTG |
| 5: TCAGGTGGATGGTCCGGGGAGAC |
SYBR green was used as the detector and ROX as a stabilizing dye. Results (means ± S.D.) represent number of samples as described in the legend. The data were analyzed using the Comparative CT method (ΔΔCT method). Differences in CT are used to quantify relative amount of PCR target contained within each well. The data were expressed as relative mRNA expression in reference to control, normalized to quantity RNA input by performing measurements on an endogenous reference gene, GAPDH.
Immunohistochemical studies
Renal cortical sections from control and HIV-1 transgenic (Tg26) mice were de-paraffinised and antigen retrieval was done by microwave heating. The endogenous peroxidase was blocked with 0.3% hydrogen peroxide in methanol for 30 minutes at room temperature (RT). Sections were washed in PBS thrice and incubated in blocking serum solution for 60 minutes at RT followed by incubation with primary antibodies against either VDR (mouse monoclonal, Santa Cruz Biotechnology, Santa Cruz, CA) or 8-OHdG (mouse monoclonal, Santa Cruz) for overnight at 4°C in a moist chamber. Each of the sections were washed thrice with PBS and incubated in appropriate secondary antibody at 1:250 dilutions at RT for 1 hour. After washing with PBS three times, sections were incubated in ABC reagent (Vector Laboratories, Burlingame, CA) for 1/2 hour. Sections were washed thrice in PBS and then placed in diaminobenzidine (DAB) /hydrogen peroxide solution, counterstained with haematoxylin, dehydrated and mounted with a xylene-based mounting media (Permount, Fisher Scientific Corporation, Fair Lawn, NJ). Appropriate positive and negative controls were used.
Immunofluorescence detection DNA strand breaks and repair
Control and experimental podocytes were fixed and permeabilized with a buffer containing 0.02% Triton X-100 and 4% formaldehyde in PBS. Fixed cells were washed three times in PBS and blocked in 1% BSA for 30 min at 37 °C. Phospho-histone H2AX (γH2AX) was detected by a mouse monoclonal antibody that recognizes phosphorylated serine within the amino acid sequence 134–142 of human histone H2A.X (UBI) and FITC-conjugated goat anti-mouse secondary antibody (Molecular Probes). KU80, a DNA repair protein was detected by rhodamine-conjugated anti-KU80 antibody (Cell Signaling, Darvers, MA). Double labeling was indicated by orange color. Negative controls were performed in the presence of non-specific isotype antibodies in place of primary antibody. In all variables, DNA was counterstained with 4′6′-diamidino-2-phenylindole (DAPI).
Western blotting studies
Control and experimental cells/renal tissues were lysed in RIPA buffer containing 50 mM Tris-Cl (pH 7.5), 150 mM NaCl, 1mM EDTA, 1% NP-40, 0.25% Deoxycholate, 0.1% SDS, 1X protease inhibitor cocktail I (Calbiochem, EMD Biosciences, Gibbstan, NJ), 1mM PMSF, and 0.2mM sodium orthovanadate. Protein concentration was measured with the Biorad Protein Assay kit (Pierce, Rockford, IL). Protein lysates (20 μg) were separated on a 4–15% gradient polyacrylamide gels (PAGE, Bio-Rad, Hercules, CA) and transferred onto a nitrocellulose membrane using Bio-Rad mini blot apparatus. Nitrocellulose membranes were then subjected to immunostaining with primary antibodies against VDR (mouse monoclonal, Santa Cruz) or renin (Santa Cruz) and subsequently with horseradish peroxidase labeled appropriate secondary antibody. The blots were developed using a chemiluminescence detection kit (PIERCE, Rockford, IL) and exposed to X-ray film (Eastman Kodak Co., Rochester, NY). Equal protein loading was confirmed by immunoblotting for actin protein using a polyclonal α-Actin antibody (Santa Cruz Technology, Santa Cruz, CA) on the same Western blots.
Statistical analysis
For comparison of mean values between two groups, the unpaired t test was used. To compare values between multiple groups, analysis of variance (ANOVA) was used to calculate a p-value. Statistical significance was defined as P<0.05. Results are presented and mean ± SD
Results
Hyperglycemic Tg26 mice display enhanced mesangial expansion, global glomerulosclerosis, and microcyst formation
Mean blood sugar levels of FVBN and Tg26 mice were 191.5 ± 7.4 mg/dl and 197.5 ± 8.0 mg/dl respectively. However, STZ administration enhanced mean blood sugar level in FVBN and Tg26 mice to 474.5 ± 49.9 mg/dl and 506.3 ± 21.5 mg/dl respectively.
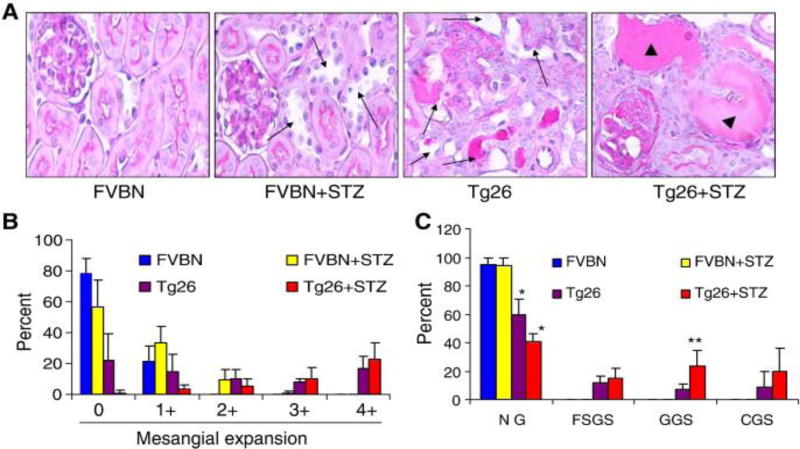
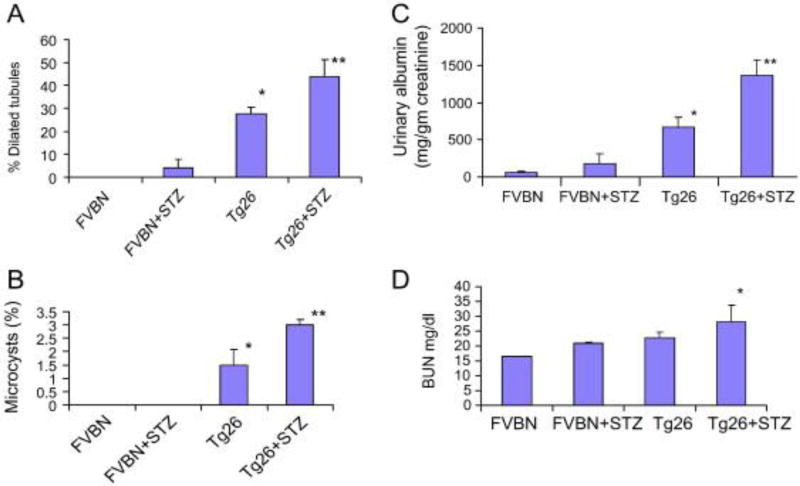
Renal cortical sections of control (FVBN), hypergycemic FVBN (FVBN + STZ), Tg26, and hyperglycemic Tg26 (Tg26 + STZ) were evaluated for severity of renal lesions. Representative microphotographs are shown in Fig. 1A. Severity of mesangial expansion and percentage of normal vs. sclerosed glomeruli in different groups has been displayed. In Figs 1B and 1C respectively. There was an occasional normal glomerulus in hyperglycemic Tg26 mice; whereas, normoglycemic Tg26 mice displayed approximately 20% normal glomeruli (Figs. 1B and 1C). Hyperglycemic Tg26 mice also displayed higher number (P<0.05) of globally sclerosed glomeruli when compared to normoglycemic Tg26 mice. Cumulative data on the effect of high blood glucose levels on tubular injury in the form of tubular dilatation and microcyst formation are shown in Figs. 2A and 2B. Hyperglycemic FVBN displayed mild dilatation in some tubules. However, more than 30% of tubules displayed some degree of dilatation in Tg26 mice. Majority of tubules displayed dilatation in hyperglycemic Tg26 mice (Fig. 2A). Hyperglycemia also enhanced number of microcysts in Tg26 mice when compared to normoglycemic Tg26 mice (Fig. 2B). Tg26 mice displayed five fold increase in proteinuria when compared to FVBN mice. However, hyperglycemia enhanced proteinuria by two fold in Tg26 mice (Fig. 2C). Hyperglycemic Tg26 mice also displayed mild increase in serum BUN levels (Tg26, 21.8 ± 1.5 mg/dl vs. Tg26 + STZ, 26.8 ± 2.3 mg/dl; P<0.05).
Figure 1. Hyperglycemia enhances glomerulosclerosis in Tg26 mice.
To evaluate severity of renal injury, renal cortical sections from different groups of mice were stained with PAS.
A. Representative renal cortical sections of control (FVBN), hyperglycemic FVBN (FVBN + STZ), Tg26, and hyperglycemic Tg26 (Tg26 + STZ) are shown. Renal cortical sections were evaluated for severity of renal lesions. Representative microphotographs are shown. in Fig. 1A. Tubular dilatation is indicated by black arrows. Microcysts are indicated by arrowheads.
B. Severity of mesangial expansion was graded from 0 to 4+. Cumulative data are shown in the form of bar graphs. All the glomeruli of hyperglycemic Tg26 mice (Tg26 +STZ) displayed some degree of mesangial expansion.
C. Sclerotic phenotype of glomeruli in control and experimental animals are shown. Hyperglycemic Tg26 (Tg26 + STZ) displayed hardly any normal glomeruli (NG); whereas, Tg26 mice displayed approximately 20% of normal glomeruli. Hyperglycemic Tg26 displayed greater number of globally sclerosed glomeruli when compared to normoglycemic Tg26. *P<0.05 compared to all other variables; **P<0.05 compared to Tg26.
Figure 2. Hyperglycemia enhances tubular injury and proteinuria in Tg26 mice.
A. Cumulative data of the effect of high blood glucose levels on tubular injury the form of tubular dilatation are shown. Hyperglycemia in control animals (FVBN) enhanced dilatation of some tubules. Hypergylcemia further enhanced tubular dilatation in Tg26 mice. *P<0.001 compared to FVBN, and FVBN+STZ; **<0.05 compared to Tg26.
B. Cumulative data showing percentage of microcysts in different groups. Hyperglycemic Tg26 mice displayed higher number of microcysts.
*P<0.01 compared to FVBN and FVBN+STZ; **P<0.05 compared to Tg26.
C. Proteinuria in different groups. *P<0.01 compared to FVBN and FVBN + STZ; **P<0.01 compared to Tg26.
D. Mean BUN levels in different groups. *P<0.05 compared to other variables.
Hyperglycemia enhanced ROS generation by kidney cells
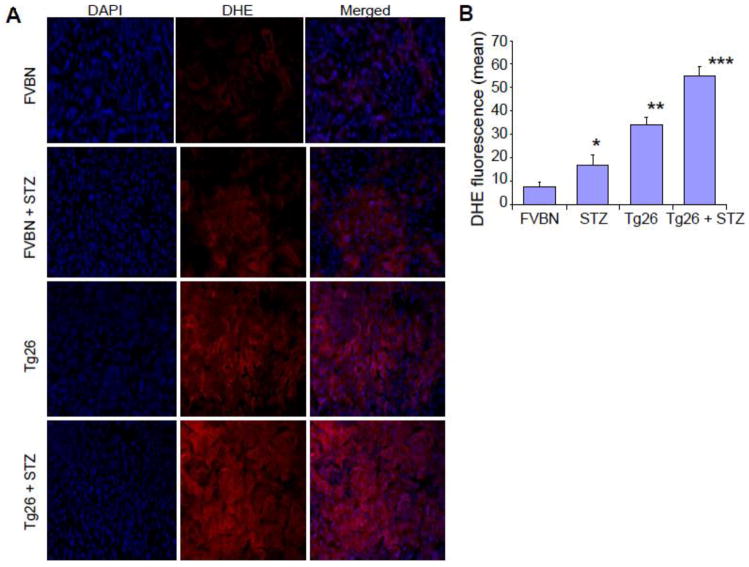
To determine ROS generation by kidney cells in hyperglycemic milieu, cryo-sections of control (FVBN), hypergycemic FVBN (FVBN + STZ), Tg26, and hyperglycemic Tg26 (Tg26 + STZ) were stained with redox sensitive probe dihdroethidium (DHE) and evaluated for ROS generation. Kidney cells from hyperglycemic FVBN and Tg26 mice displayed enhanced ROS generation when compared with respective controls. Representative micrographs are shown in Fig. 3. Quantification of fluorescence has been displayed in Fig. 3B.
Figure 3. Hyperglycemia enhances ROS generation by kidney cells.
Representative kidney frozen sections of control (FVBN), hyperglycemic FVBN (FVBN + STZ), Tg26, and hyperglycemic Tg26 (Tg26 + STZ) mice were stained with DHE. Nuclei were stained blue with DAPI. ROS generation is displayed by red fluorescence.
B. Cumulative DHE fluorescence data are shown in bar graphs.
*P<0.05 compared to FVBN; **P<0.01 compared to FVBN and STZ;***P<0.01 compared to all other variables.
Hyperglycemia enhances oxidative DNA damage in Kidney cells in Tg26 mice
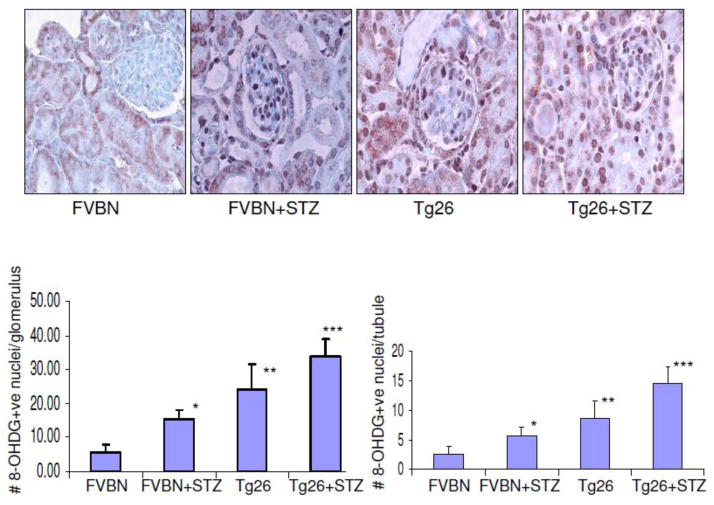
Higher blood levels of glucose have been reported to cause oxidative DNA damage in kidney cells. Recently we have also reported that HIV induces oxidative DNA damage in kidney cells both in vitro and in vivo (30). To determine the role of high glucose in the induction of oxidative DNA damage of kidney cells in HIVAN mice, renal cortical sections of control mice, hyperglycemic mice, Tg26, and hyperglycemic Tg26 mice were immunolabeled for 8-OHDG expression. Representative microphotographs are shown in Fig. 4A. Cumulative data in the form of number of 8-OHDG positive cells in glomeruli and tubules in different groups of animals are shown in Figs. 4B and 4C respectively. Hyperglycemia enhanced number of 8-OHDG positive cells both in FVBN and Tg26 mice.
Figure 4. Hyperglycemia enhances oxidative DNA damage in Kidney cells in Tg26 mice.
Renal cortical sections of control mice, hyperglycemic mice, Tg26, and hyperglycemic Tg26 mice were immunolabeled for 8-OHDG expression.
A. Representative microphotographs showing expression of 8-OHdG by kidney cells in different groups. 8-OHdG +ve nuclei are darkly stained.
B. Cumulative data on number of 8-OHDG +ve nuclei per glomerulus. *P<0.01 compared to FVBN; **compared to FVBN and FVBN +STZ.
C. Cumulative data on number of 8-OHdG +ve nuclei/tubule. *P<0.05 compared to FVBN; **P<0.01 compared to FVBN;***P<0.05 compared to Tg26.
Hyperglycemia down regulates renal tissue VDR expression in Tg26 mice
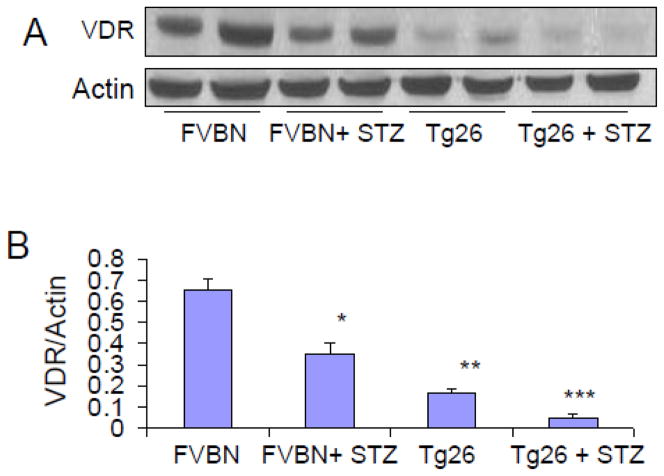
Glucose has been reported to down regulate renal tissue expression of VDR in animal experimental model of diabetic nephropathy. Recently, we have also reported that HIV induced down regulation of VDR both in vitro and in vivo studies (5, 30). To determine whether high blood glucose levels exacerbate down regulation of VDR in renal tissues of Tg26 mice, protein blots of control, hyperglycemic FVBN, Tg26, and hyperglycemic Tg26 were probed for VDR. The same blots were reprobed for actin. Representative gels form renal tissue lysates of two animals from each group are displayed in Fig 5A. Cumulative data of three animals are shown in the form of bar graphs (Fig 5B).
Figure 5. Hyperglycemia exacerbates down regulation of renal tissue VDR expression in Tg26 mice.
A. Protein blots of renal tissue lysates of different groups of animals (n=3) were probed for VDR. The same blots were reprobed for actin. Representative gels form renal tissue lysates of two animals from each group are displayed. The upper panel shows renal tissue expression of VDR by different groups of animals. The lower panel shows actin content under the same conditions.
B. Densitometric cumulative data on VDR actin/ratio (n=3) shown in the form of bar graphs.
*P<0.05 compared to FVBN; **P<0.01 compared to FVBN; ****P<0.05 compared to Tg26.
High glucose exacerbates HIV-induced down regulation of VDR in human podocytes
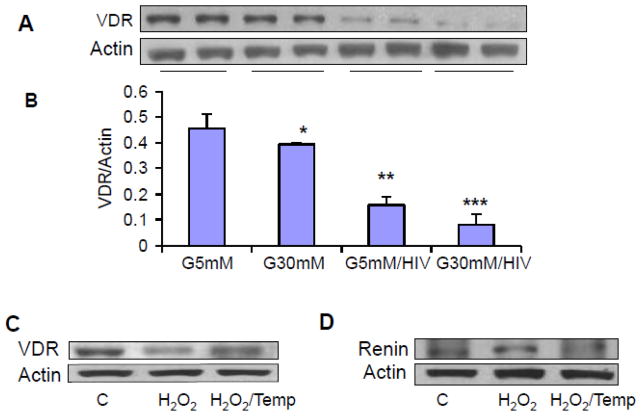
We have recently reported that HIV induces down regulation of VDR in podocytes (5). We asked whether high glucose has potential to exacerbate down regulation of podocyte VDR expression in HIV milieu. To determine the effect of high glucose on podocyte VDR expression, podocytes were transduced with HIV under euglycemic and hyperglycemic conditions for 48 hours, and their lysates were electrophoresed and transferred on nitrocellulose membranes. Subsequently, protein blots were probed for VDR and reprobed for actin. Representative gels from two different cellular lysates are shown in Fig. 6A. Cumulative data (n=3) from three lysates are displayed in Fig. 6B. High glucose down regulated podocyte VDR expression under control and HIV-stimulated states.
Figure 6. High glucose exacerbates HIV-induced down regulation of VDR in human podocytes.
A. Control and HIV-transduced podocytes were incubated in media containing either normal glucose (5 mM) or high glucose (30 mM) for 48 hours (n=4). Subsequently, cellular lysates were electrophoresed and probed for VDR. The same blots were reprobed for actin. Representative gels from two different lysates are displayed. The upper lane shows podocyte expression of VDR under control, glucose, and HIV-stimulated states.
B. Cumulative data (n=3) are shown in bar graphs.
*P<0.05 compared to NG; **P<0.01 compared to NG; ***P<0.05 compared to C.
C. Human podocytes were incubated in medium containing either buffer (C) of or H2O2 (100 μM) in the presence or absence of Tempol (1 μM) for 6 hours. Subsequently protein blots were probed for VDR. The same blots were reprobed for actin. Representative gels are displayed.
D. Human podocytes were incubated in medium containing either buffer (C) of or H2O2 (100 μM) in the presence or absence of Tempol (1 μM) for 6 hours. Subsequently protein blots were probed for renin. The same blots were reprobed for actin. Representative gels are displayed.
We have previously demonstrated a role of HIV-induced down regulation of VDR and activation of renin Angiotensin system in podocytes (5). To establish a causal relationship between ROS generation and down regulation of VDR and up regulation of renin, human podocytes were treated with H2O2 in the presence or absence of Tempol for 6 hours. Subsequently protein blots were probed for VDR. The same blots were reprobed for actin (Fig. 6C). In parallel sets, cells treated under the same conditions and then prepared for Western blotting and probed for renin. The same blots were reprobed for actin (Fig. 6D). H2O2 down regulated VDR expression but enhanced podocyte renin expression.
Hyperglycemia activates renin angiotensin system in Tg26 mice
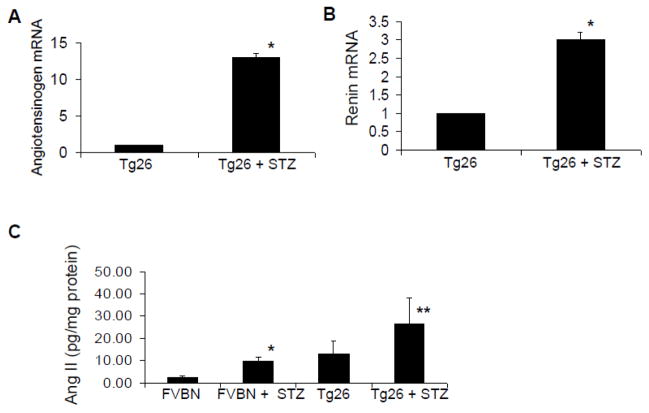
Since VDR is a negative regulator of renin (21), we hypothesized that hyperglycemia would cause activation of the renin angiotensin in Tg26 mice. To determine the status of the renin Angiotensin system in control and hyperglycemic Tg26, total RNA was extracted from normoglycemic and hyperglycemic Tg26 mice and probed for mRNA expression of angiotensinogen and renin. Hyperglycemic Tg26 mice displayed 12-fold increase in mRNA expression of angiotensinogen and 3-fold in crease in mRNA expression of renin (Figs. 7A and 7B).
Figure 7. Hyperglycemia activates renin angiotensin system in Tg26 mice.
A. Total RNA was extracted from renal tissues of normogycemic and hyperglycemic Tg26 mice (n=3). Subsequently, mRNA expression for angiotensinogen was determined by real time PCR studies. *P<0.001 compared to Tg26.
B. Total RNA was extracted from renal tissues of normoglycemic and hyperglycemic Tg26 mice (n=3). Subsequently, mRNA expression for renin determined by real time PCR studies. *P<0.001 compared to Tg26.
C. Renal tissues of different groups of animals (n=4) were assayed for their Ang II content by ELISA. *P<0.05 compared to FVBN; **P<0.05 compared to Tg26.
To determine whether hyperglycemia induced renal tissue mRNA expression in Tg26 mice culminates into Ang II production, Ang II contents of renal tissues of control, hyperglycemic FVBN, Tg26 and hyperglycemic Tg26 were measured by Ang II ELISA. Cumulative data (n=4) are shown in the bar graphs (Fig. 7C). Hyperglycemia enhanced renal tissue Ang II generation in both control and Tg26 mice.
High glucose and HIV enhance podocyte DNA damage
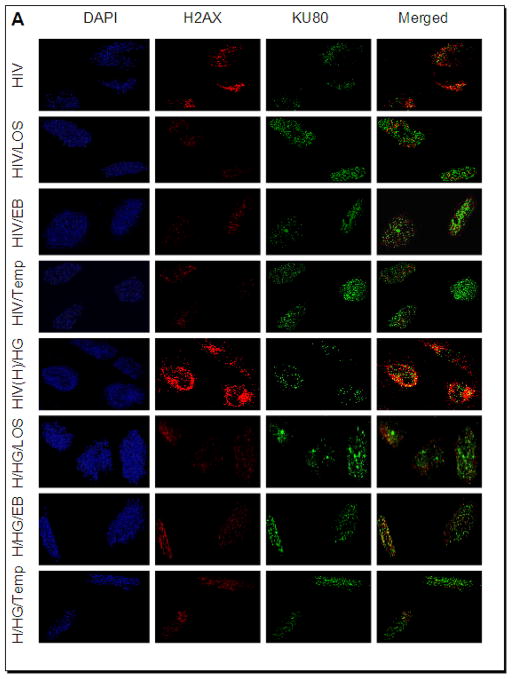
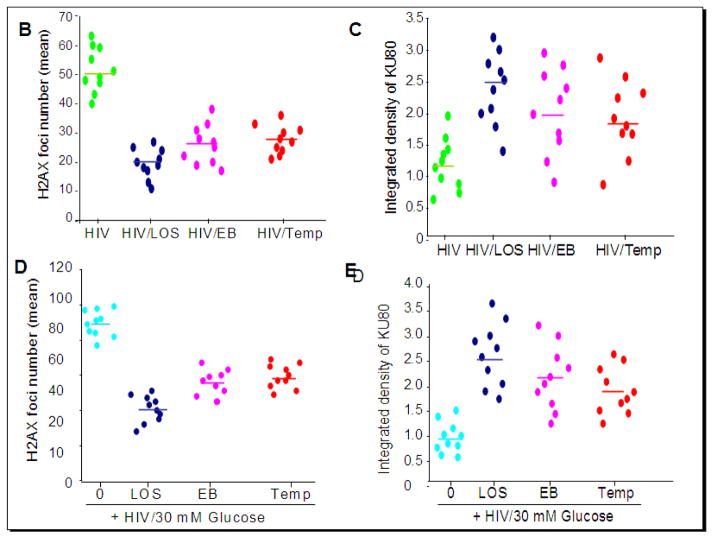
To determine the effect of high glucose and HIV, human podocytes grown on coverslips were transduced with either empty vector or NL43 (HIV construct). Empty vector- transduced podocytes or NL4-3 (HIV)-transduced podocytes were incubated in media containing either normal glucose (5 mM) or high glucose (30 mM) in the presence or absence of losartan (LOS, 10?−7M)/Tempol (1μM)/EB1089, 10 pM) for 24 hours (n=3). Subsequently cells were co-labeled for H2AX and KU80 and examined under a confocal microscope. Representative microphotographs are shown in Figs. 8 and 9. Figs. 8B–C and 9B–E summarize the data as scattergrams with lines indicating means. Both NL4-3-transduced podocytes and podocytes treated with 30 mM glucose displayed enhanced nuclear double strand breaks. This effect was more pronounced when 30 mM glucose and HIV used together (Fig. 8). Losartan (LOS), EB1089, and Tempol attenuated DNA damaging effects of HIV alone as well as combined effect of HIV and 30 mM glucose (Fig. 9).
Figure 8. High glucose and HIV enhance podocyte DNA damage.
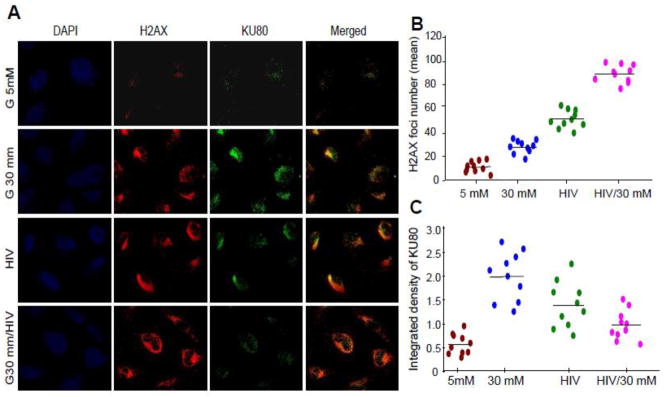
A. Empty vector- and NL4-3 (HIV)-transduced podocytes grown on cover slips were incubated in media containing either glucose (5 mM) or glucose (30 mM) for 24 hours. At the end of the incubation period, cells were co-labeled for H2AX (double strand breaks) and KU80 (DNA repair) expression and examined under a confocal microscope. Nuclei are stained blue (DAPI). Representative microphotographs are shown. Red dots in nuclei indicate double strand breaks and green dots indicate DNA repair proteins.
B. Cumulative data (number of H2AX foci) of the protocol described in A are summarized as scattergrams with lines representing the means.
C. Cumulative data (integrated density, KU80) of the protocol described in A are summarized as scattergrams with lines representing the means.
Figure 9. Effects of losartan (LOS), EB1089 and Tempol on HIV- and HIV+high glucose-induced DNA damage and repair.
A. Empty vector- or NL4-3(HIV)-transduced podocytes grown on cover slips were incubated in media containing either buffer or high glucose (30 mM) in the presence or absence of losartan (LOS, 10−7M)/ EB1089(EB, 10 pM)/Tempol (Temp, 1 μM) for 24 hours (n=3). Subsequently, cells were co-labeled for H2AX and KU80 expression and examined under a confocal microscope. Representative microphotographs are shown.
B. Cumulative data displaying number of H2AX foci from the experimental protocol (glucose 5 mM) described in A are shown in the form of a scattergram with lines representing the means.
C. Cumulative data displaying integrated density of KU80 from the experimental protocol (glucose 5 mM) described in A are shown in the form of a scattergram with lines representing the means.
D. Cumulative data displaying number of H2AX foci from the experimental protocol (HIV/glucose 30 mM) described in A are shown in the form of a scattergram with lines representing the means.
E. Cumulative data displaying integrated density of KU80 from the experimental protocol described (HIV/glucose 30 mM) in A are shown in the form of a scattergram with lines representing the means.
Discussion
In the present study, hyperglycemic Tg26 mice displayed elevated BUN and enhanced proteinuria. In addition, hyperglycemic Tg26 mice displayed enhanced number of sclerotic glomeruli and microcyst formation. Renal tissues of hyperglycemic control and Tg26 mice displayed down regulation of VDR expression and enhanced renin expression. Moreover, hyperglycemic control and Tg26 mice displayed greater renal tissue Ang II levels. These findings indicated that hyperglycemia enhanced renal tissue renin angiotensin activation both in control and Tg26 mice. In in vitro studies, 30 mM glucose downregulated VDR expression in human podocytes. 30 mM glucose also upregulated podocyte expression of renin. HIV also downregulated podocyte VDR expression and upregulated podocyte renin expression. However, this effect of 30 mM glucose and HIV on podocyte VDR expression was reversed with a VDR agonist (EB1089). Both glucose and HIV stimulated podocyte ROS generation and DNA damage but compromised DNA repair. Tempol, losartan, and EB1089 not only attenuated glucose and HIV-induced ROS generation and DNA damage but they also enhanced DNA repair. These findings indicate that both glucose and HIV induced oxidative stress-induced DNA damage was mediated through renin angiotensin system activation via down regulation of VDR.
Although HAART has been reported to increase hyperglycemia, this therapy has also been reported to inhibit the progression of HIVAN (20). One may argue theoretically that the effect of HIV infection may be attenuated by HAART but the effect of the hyperglycemia induced activation of the renin angiotensin system may continue. According to a recent report, 50% HIVAN patients progressed to end stage renal disease despite being on HAART (2). Thus, it appears that factors other than HIV infection are contributing to the progression of HIVAN. In another study, occult HIVAN progressed to overt HIVAN despite attenuation of HIV gene expression (17). In these studies the activation of the renin angiotensin system contributed to the progression of HIVAN. Moreover, use of HAART has been reported to modulate the course of HIVAN only but not other HIV-related kidney diseases. In that scenario, if HAART induced hyperglycemia activated renal cell angiotensin system, it may accelerate the progression of HIV-associated kidney diseases. Nonetheless, occurrence of this phenomenon will be prevented in patients who are being treated with either ACE inhibitors or Ang II blockers.
In the present study, Tg26 mice developed worsening of renal biomarkers within two weeks of hyperglycemia. Theoretically, hyperglycemia can induce hyperfiltration as well as dehydration and thus, may enhance protein leak and cause elevated blood levels of BUN without any alterations in severity of renal lesions. However, hyperglycemic Tg26 mice also displayed increased numbers of sclerotic glomeruli and microcyst formation. Thus it appears that even a short term hyperglycemia has potential to accelerate the progression of renal lesions in HIVAN. Although, these are preliminary findings, they provide a basis for further studies.
Both glucose and HIV have been demonstrated to stimulate ROS generation in kidney cells (5, 27, 30, and 34). In the present study, both glucose and HIV stimulated ROS generation in kidney cells. Moreover, renal cortical sections from hyperglycemic Tg26 mice exhibited higher number of 8-OHdG positive nuclei when compared to control mice. Thus, It appears that hyperglycemia also increased renal cell oxidative damage in HIVAN mice.
Manifestation of HIVAN requires African ancestry and HIV infection (1, 31. Interestingly, majority of African Americans in general and with HIV infection in particular have been reported to be vitamin D deficient (9, 14). Since vitamin D works through vitamin D receptor (VDR) and its expression is dependent on vitamin D levels, African black patients with HIV infection are also likely to have diminished kidney cell VDR expression. Since liganded VDR is negative regulator of renin, kidney cells are likely to have activated renin angiotensin system. In the current study, we observed that renal tissues in Tg26 mice displayed down regulated VDR and increased production of Ang II. Since Ang II has been demonstrated to enhance oxidative stress and production of profibrotic molecules by kidney cells, it would indicate that hyperglycemia-induced activation of the renin angiotensin system could have also contributed to the accelerated progression of renal lesions in hyperglycemic HIVAN mice.
We have previously reported the role of HIV-induced upregulation of renin angiotensin system in human podocytes in in vitro studies (5). In these studies, HIV down regulated podocyte VDR expression and enhanced renin expression (5). The activation of renin angiotensin system was associated with ROS generation and induction lysosomal leak of cathepsin L and damaging effects on podocyte actin cytoskeleton. In the present study, HIV enhanced podcyte VDR down regulation in vivo studies. Glucose exacerbated HIV-induced podocyte down regulation of VDR. In in vitro studies, ROS generation led to podocyte VDR down regulation and upregulation of renin. These in vitro studies establish a causal relationship in ROS generation and the activation of renin angiotensin system in podocytes. We have previously reported similar mechanism in human proximal tubular cells in response to HIV-induced ROS generation (30).
Proposed mechanism of glucose-induced worsening kidney injury has been outlined in Fig. 10. HIV has been reported to contribute to kidney injury though the generation of ROS. Both glucose and HIV are known to stimulate the activation of RAS in kidney cells. Therefore, glucose is likely to exacerbate the activation of kidney cell RAS in HIV milieu. Interestingly, both glucose and HIV have been reported to stimulate kidney cell ROS production. In the present study, glucose not only exacerbated ROS generation by kidney cells in Tg26 mice but also enhanced severity of kidney cell oxidative DNA damage.
Figure 10.
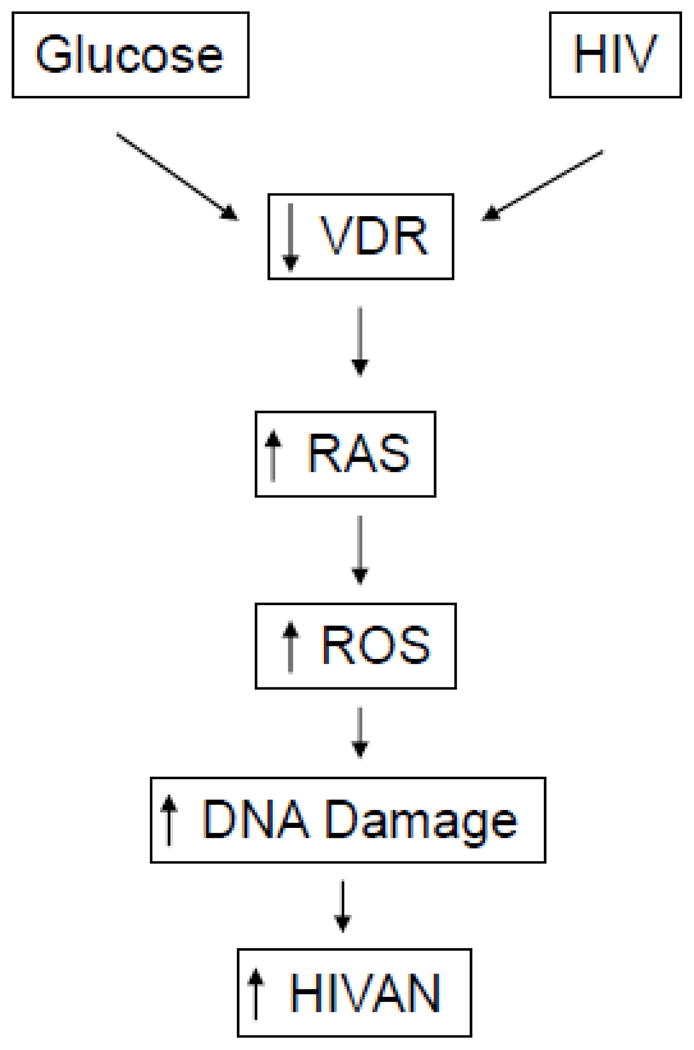
Proposed mechanism of high glucose-induced worsening of HIVAN
We conclude that hyperglycemia has the potential to accelerate HIV-induced kidney cell injury both in vitro and in vivo.
Highlights.
Hyperglycemic HIVAN mice displayed elevated BUN levels and enhanced proteinuria.
Hyperglycemic HIVAN mice displayed enhanced number of sclerotic glomeruli and microcysts.
Hyperglycemia attenuated kidney cell VDR receptors both in vitro and in vivo
Hyperglycemia exacerbated Oxidative stress and DNA damage in HIVAN mice
Hypergycemia-induced oxidative stress was reversed by antioxidants
Ang II blockade and vitamin D receptor agonists also reversed hyperglycemia-induced damage in vitro studies
Acknowledgments
This work was supported by grant RO1DK084910, RO1 DK083931, and 1R01DK098074 (PCS) from National Institutes of Health, Bethesda, MD.
Abbreviations
- BUN
Blood urea nitrogen
- VDR
Vitamin D receptor
- HIVAN
HIV-associated nephropathy
- DN
Diabetic nephropathy
- 8-OHdG
8-hydroxydeoxyguanosine
- HAART
Highly active anti-retroviral therapy
- DHE
Dihydroethidium
- FSGS
Focal segmental glomerulosclerosis
- GGS
Global glomerulosclerosis
- CGS
Collapsing glomerulosclerosis
- Agt
Angiotensiongen
Footnotes
Publisher's Disclaimer: This is a PDF file of an unedited manuscript that has been accepted for publication. As a service to our customers we are providing this early version of the manuscript. The manuscript will undergo copyediting, typesetting, and review of the resulting proof before it is published in its final citable form. Please note that during the production process errors may be discovered which could affect the content, and all legal disclaimers that apply to the journal pertain.
References
- 1.Atta MG. Diagnosis and natural history of HIV-associated nephropathy. Adv Chronic Kidney Dis. 2010;17:52–8. doi: 10.1053/j.ackd.2009.08.005. [DOI] [PubMed] [Google Scholar]
- 2.Bigé N, Lanternier F, Viard JP, Kamgang P, Daugas E, Elie C, Jidar K, Walker-Combrouze F, Peraldi MN, Isnard-Bagnis C, Servais A, Lortholary O, Noël LH, Bollée G. Presentation of HIV-associated nephropathy and outcome in HAART-treated patients. Nephrol Dial Transplant. 2012;27:1114–21. doi: 10.1093/ndt/gfr376. [DOI] [PubMed] [Google Scholar]
- 3.Burns C, Paul SK, Toth IR, Siva L. Effect of angiotensin-converting enzyme inhibition in HIV-associated nephropathy. J Am Soc Nephrol. 1999;8:1140–1146. doi: 10.1681/ASN.V871140. [DOI] [PubMed] [Google Scholar]
- 4.Carr A, Samaras K, Thorisdottir A, Kaufmann GR, Chisholm DJ, Cooper DA. Diagnosis, prediction, and natural course of HIV-1 protease-inhibitor-associated lipodystrophy, hyperlidaemia and diabetes mellitus: a cohort study. Lancet. 1999;335:2093–2099. doi: 10.1016/S0140-6736(98)08468-2. [DOI] [PubMed] [Google Scholar]
- 5.Chandel N, Sharma B, Husain M, Salhan D, Singh T, Rai P, Mathieson PW, Saleem MA, Malhotra A, Singhal PC. HIV Compromises Integrity of Podocyte Actin Cytoskeleton through down regulation of Vitamin D receptor. Am J Physiol Renal Physiol. 2013;304:F1347–57. doi: 10.1152/ajprenal.00717.2012. [DOI] [PMC free article] [PubMed] [Google Scholar]
- 6.Christakos S, Dhawan P, Benn B, Porta A, Hediger M, Oh GT, Jeung EB, Zhong Y, Ajibade D, Dhawan K, Joshi S. Vitamin D: molecular mechanism of action. Ann N Y Acad Sci. 2007;1116:340–8. doi: 10.1196/annals.1402.070. [DOI] [PubMed] [Google Scholar]
- 7.Coward RJ, Welsh GI, Koziell A, Hussain S, Lennon R, Ni L, Tavaré JM, Mathieson PW, Saleem MA. Nephrin is critical for the action of insulin on human glomerular podocytes. Diabetes. 2007;56:1127–35. doi: 10.2337/db06-0693. [DOI] [PubMed] [Google Scholar]
- 8.Costa EM, Feldman D. Measurement of 1,25-dihydroxyvitamin D3 receptor turnover by dense amino acid labeling: changes during receptor up-regulation by vitamin D metabolites. Endocrinology. 1987;120:1173–1178. doi: 10.1210/endo-120-3-1173. [DOI] [PubMed] [Google Scholar]
- 9.Crutchley RD, Gathe J, Jr, Mayberry C, Trieu A, Abughosh S, Garey KW. Risk factors for vitamin D deficiency in HIV-infected patients in the south central United States. AIDS Res Hum Retroviruses. 2012;28:454–9. doi: 10.1089/aid.2011.0025. [DOI] [PubMed] [Google Scholar]
- 10.Dube MP. Disorders of glucose metabolism in patients infected with human immunodeficiency virus. Clin Infect Dis. 2000;31:1467–1475. doi: 10.1086/317491. [DOI] [PubMed] [Google Scholar]
- 11.Durvasula RV, Shankland SJ. Activation of a local renin angiotensin system in podocytes by glucose. Am J Physiol Renal Physiol. 2008;294:F830–9. doi: 10.1152/ajprenal.00266.2007. [DOI] [PubMed] [Google Scholar]
- 12.Husain M, Gusella GL, Klotman ME, Gelman IH, Ross MD, Schwartz EJ, Cara A, Klotman PEJ. HIV-1 Nef induces proliferation and anchorage-independent growth in podocytes. Am Soc Nephrol. 2002;13:1806–15. doi: 10.1097/01.asn.0000019642.55998.69. [DOI] [PubMed] [Google Scholar]
- 13.Hunt PW, Deeks SG, Rodriguez B, Valdez H, Shade SB, Abrams DI, Kitahata MM, Krone M, Neilands TB, Brand RJ, Lederman MM, Martin JN. Continued CD4 cell count increases in HIV-infected adults experiencing 4 years of viral suppression on antiretroviral therapy. AIDS. 2003;17:1907–15. doi: 10.1097/00002030-200309050-00009. [DOI] [PubMed] [Google Scholar]
- 14.Kim JH, Gandhi V, Psevdos G, Jr, Espinoza F, Park J, Sharp V. Evaluation of vitamin D levels among HIV-infected patients in New York City. AIDS Res Hum Retroviruses. 2012 Mar;28(3):235–41. doi: 10.1089/AID.2011.0040. [DOI] [PubMed] [Google Scholar]
- 15.Kimmel PL, Barisoni L, Kopp JB. Pathogenesis and treatment of HIV-associated renal diseases: lessons from clinical and animal studies, molecular pathologic correlations, and genetic investigations. Ann Intern Med. 2003;139:214–26. [PubMed] [Google Scholar]
- 16.Kopp JB, Nelson GW, Sampath K, Johnson RC, Genovese G, An P, Friedman D, Briggs W, Dart R, Korbet S, Mokrzycki MH, Kimmel PL, Limou S, Ahuja TS, Berns JS, Fryc J, Simon EE, Smith MC, Trachtman H, Michel DM, Schelling JR, Vlahov D, Pollak M, Winkler CA. APOL1 genetic variants in focal segmental glomerulosclerosis and HIV-associated nephropathy. J Am Soc Nephrol. 2011;22:2129–37. doi: 10.1681/ASN.2011040388. [DOI] [PMC free article] [PubMed] [Google Scholar]
- 17.Kumar D, Salhan D, Magoon S, Torri DD, Sayeneni S, Sagar A, Bandhlish A, Malhotra A, Chander PN, Singhal PC. Adverse host factors exacerbate occult HIV-associated nephropathy. Am J Pathol. 2011;179:1681–92. doi: 10.1016/j.ajpath.2011.06.013. [DOI] [PMC free article] [PubMed] [Google Scholar]
- 18.Lake JE, Adams JS. Vitamin D in HIV-Infected Patients. Curr HIV/AIDS Rep. 2011;8:133–41. doi: 10.1007/s11904-011-0082-8. [DOI] [PMC free article] [PubMed] [Google Scholar]
- 19.Lee GA, Rao M, Grunfeld C. The effects of HIV protease inhibitors on carbohydrate and lipid metabolism. Curr Infect Dis Rep. 2004;6:471–482. doi: 10.1007/s11908-004-0067-5. [DOI] [PubMed] [Google Scholar]
- 20.Lescure FX, Flateau C, Pacanowski J, Brocheriou I, Rondeau E, Girard PM, Ronco P, Pialoux G, Plaisier E. HIV-associated kidney glomerular diseases: changes with time and HAART. Nephrol Dial Transplant. 2012;27:2349–55. doi: 10.1093/ndt/gfr676. [DOI] [PubMed] [Google Scholar]
- 21.Li YC, Kong J, Wei M, Chen ZF, Liu SQ, Cao LP. 1,25-Dihydroxyvitamin D(3) is a negative endocrine regulator of the renin-angiotensin system. J Clin Invest. 2002;110:229–38. doi: 10.1172/JCI15219. [DOI] [PMC free article] [PubMed] [Google Scholar]
- 22.Mallipattu SK, Liu R, Zhong Y, Chen EY, D’Agati V, Kaufman L, Ma’ayan A, Klotman PE, Chuang PY, He JC. Expression of HIV transgene aggravates kidney injury in diabetic mice. Kidney Int. 2013;83:626–34. doi: 10.1038/ki.2012.445. [DOI] [PMC free article] [PubMed] [Google Scholar]
- 23.Martinez E, Conget I, Lozano L, Casamitjana R, Gatell JM. Reversion of metabolic abnormalities after switching from HIV-1 protease inhibitors to nevirapine. AIDS. 1999;13:805–810. doi: 10.1097/00002030-199905070-00009. [DOI] [PubMed] [Google Scholar]
- 24.Munger KL, Levin LI, Massa J, Horst R, Orban T, Ascherio A. Preclinical serum 25-hydroxyvitamin D levels and risk of type 1 diabetes in a cohort of US military personnel. Am J Epidemiol. 2013 doi: 10.1093/aje/kws243. [DOI] [PMC free article] [PubMed] [Google Scholar]
- 25.Papeta N, Kiryluk K, Patel A, Sterken R, Kacak N, Snyder HJ, Imus PH, Mhatre AN, Lawani AK, Julian BA, Wyatt RJ, Novak J, Wyatt CM, Ross MJ, Winston JA, Klotman ME, Cohen DJ, Appel GB, D’Agati VD, Klotman PE, Gharavi AG. APOL1 variants increase risk for FSGS and HIVAN but not IgA nephropathy. J Am Soc Nephrol. 2011;22:1991–6. doi: 10.1681/ASN.2011040434. [DOI] [PMC free article] [PubMed] [Google Scholar]
- 26.Papeta N, Sterken R, Kiryluk K, Kalyesubula R, Gharavi AG. The molecular pathogenesis of HIV-1 associated nephropathy: recent advances. J Mol Med (Berl) 2011;89:429–36. doi: 10.1007/s00109-010-0719-x. [DOI] [PubMed] [Google Scholar]
- 27.Piwkowska A, Rogacka D, Audzeyenka I, Jankowski M, Angielski S. High glucose concentration affects the oxidant-antioxidant balance in cultured mouse podocytes. J Cell Biochem. 2011;112:1661–72. doi: 10.1002/jcb.23088. [DOI] [PubMed] [Google Scholar]
- 28.Ruggenenti P, Bettinaglio P, Pinares F, Remuzzi G. Angiotensin converting enzyme insertion/deletion polymorphism and renoprotection in diabetic and nondiabetic nephropathies. Clin J Am Soc Nephrol. 2008;3:1511–25. doi: 10.2215/CJN.04140907. [DOI] [PMC free article] [PubMed] [Google Scholar]
- 29.Saleem MA, O’Hare MJ, Reiser J, Coward RJ, Inward CD, Farren T, Xing CY, Ni L, Mathieson PW, Mundel P. J Am Soc Nephrol. 2002;13:630–638. doi: 10.1681/ASN.V133630. [DOI] [PubMed] [Google Scholar]
- 30.Salhan D, Husain M, Subrati A, Goyal R, Singh T, Rai P, Malhotra A, Singhal PC. HIV-induced kidney cell injury: role of ROS-induced downregulated vitamin D receptor. Am J Physiol Renal Physiol. 2012;303:F503–14. doi: 10.1152/ajprenal.00170.2012. [DOI] [PMC free article] [PubMed] [Google Scholar]
- 31.Szczech LA, Gupta SK, Habash R, Guasch A, Kalayjian R, Appel R, Fields TA, Svetkey LP, Flanagan KH, Klotman PE, Winston JA. The clinical epidemiology and course of the spectrum of renal diseases associated with HIV infection. Kidney Int. 2004;66:1145–52. doi: 10.1111/j.1523-1755.2004.00865.x. [DOI] [PubMed] [Google Scholar]
- 32.Walli R, Herfort O, Michl GM, Demant T, Jager H, Dieterie C, Bogner JR, Landgraf R, Goebel FD. Treatment with protease inhibitors associated with peripheral insulin resistance and impaired oral glucose tolerance in HIV-1-infected patients. AIDS. 1998;12:F167–F173. doi: 10.1097/00002030-199815000-00001. [DOI] [PubMed] [Google Scholar]
- 33.Woerle HJ, Mariuz PR, Meyer C, Reichman RC, Popa EM, Dostou JM, Welle SL, Gerich JE. Mechanisms for the deterioration in glucose tolerance associated with HIV protease inhibitor regimens. Diabetes. 2003;52:918–925. doi: 10.2337/diabetes.52.4.918. [DOI] [PubMed] [Google Scholar]
- 34.Xia L, Wang H, Munk S, Kwan J, Goldberg HJ, Fantus IG, Whiteside CI. High glucose activates PKC-zeta and NADPH oxidase through autocrine TGF-beta1 signaling in mesangial cells. Am J Physiol Renal Physiol. 2008;295:F1705–14. doi: 10.1152/ajprenal.00043.2008. [DOI] [PubMed] [Google Scholar]
- 35.Vieitez P, Gómez O, Uceda ER, Vera ME, Molina-Holgado E. Systemic and local effects of angiotensin II blockade in experimental diabetic nephropathy. J Renin Angiotensin Aldosterone Syst. 2008;92:96–102. doi: 10.3317/jraas.2008.018. [DOI] [PubMed] [Google Scholar]
- 36.Yarasheski KE, Tebas P, Sigmund C, Dagogo-Jack S, Bohrer A, Turk J, Halban PA, Cryer PE, Powderly WG. Insulin resistance in HIV protease inhibitor-associated diabetes. J Acquir Immune Defic Syndr. 1999;21:209–213. doi: 10.1097/00126334-199907010-00005. [DOI] [PMC free article] [PubMed] [Google Scholar]


