Abstract
Escherichia coli and other Gram-negative bacteria produce outer membrane vesicles during normal growth. Vesicles may contribute to bacterial pathogenicity by serving as vehicles for toxins to encounter host cells. Enterotoxigenic E. coli (ETEC) vesicles were isolated from culture supernatants and purified on velocity gradients, thereby removing any soluble proteins and contaminants from the crude preparation. Vesicle protein profiles were similar but not identical to outer membranes and differed between strains. Most vesicle proteins were resistant to dissociation, suggesting they were integral or internal. Thin layer chromatography revealed that major outer membrane lipid components are present in vesicles. Cytoplasmic membranes and cytosol were absent in vesicles; however, alkaline phosphatase and AcrA, periplasmic residents, were localized to vesicles. In addition, physiologically active heat-labile enterotoxin (LT) was associated with ETEC vesicles. LT activity correlated directly with the gradient peak of vesicles, suggesting specific association, but could be removed from vesicles under dissociating conditions. Further analysis revealed that LT is enriched in vesicles and is located both inside and on the exterior of vesicles. The distinct protein composition of ETEC vesicles and their ability to carry toxin may contribute to the pathogenicity of ETEC strains.
Enterotoxigenic Escherichia coli (ETEC)1 is an important pathogen responsible for traveler’s diarrhea and causes more than 700,000 childhood deaths due to diarrhea per year in third-world countries (1–4). ETEC produce several toxins, including the heat labile enterotoxin (LT), which disrupts electrolyte balance in the gut endothelium (2, 5, 6). LT is an AB5 toxin that binds Galβ1,3GalNAcβ1(NeuAcα2,3),4Galβ1,4Glc ceramide (GM1) ganglioside on epithelial cells via its B subunit (7). Once internalized by the epithelial cell, the enzymatic A subunit catalyzes the ADP-ribosylation of the Gsα subunit in the adenylate cyclase pathway leading to an increase in cAMP (2, 8–10). Elevated cAMP levels cause chloride efflux and, thereby, diarrhea. Despite intimate knowledge of its structure and function (1, 11), the mode of LT secretion from ETEC remains unclear.
LT shares more than 80% sequence homology with another AB5 toxin, Vibrio cholerae toxin, CT (2). Purified CT and LT exhibit equivalent activity in bioassays; however, disease caused by V. cholerae is more severe than that caused by ETEC (1). This suggests V. cholerae- and ETEC-mediated toxicity may be partially dependent upon the efficiency of toxin secretion (2). The signal sequences of the A and B subunits from both LT and CT are cleaved upon entrance into the periplasmic space after transport across the cytoplasmic membrane (11–13). The similarities stop in the periplasm, however; soluble CT is secreted from the cell, whereas soluble LT is reported to remain in the periplasm (3, 6). E. coli transformed with a CT-expressing plasmid does not efficiently secrete CT, whereas V. cholerae will secrete LT encoded on a plasmid, suggesting that E. coli does not possess or express a secretion apparatus present in V. cholerae (12–14). E. coli strains do contain a gsp gene cluster homologous to the eps genes encoding the secretion machinery for CT, but these genes are not expressed under laboratory conditions (15–19).
Although not secreted from the cell in soluble form, LT has often been observed in a particulate fraction of cell culture supernatant (3, 20, 21). A biochemical mechanism to explain this observation has not been identified, as no known outer membrane transport machinery exists for LT. One possibility is that LT is secreted via vesicles, as proposed by Wai et al. (21). Membrane vesicles, or MVs, have been broadly defined as spherical fragments of the bacterial membrane and are produced by a wide variety of Gram-negative bacteria (3, 20–28). Vesicles have been proposed to play a role in several virulence mechanisms: periplasmic enzyme delivery (24, 25, 27, 29–32), DNA transport (24, 28, 33), bacterial adherence (23), and evasion of the immune system (22, 34). However, the characterization of vesicles as a transport vehicle has been impaired due to a lack of a defined, pure vesicle population. Although their presence has been recognized for decades, vesicle biogenesis, composition, and role in toxin transport has not been carefully analyzed.
In this work, we begin to identify the LT secretion pathway by analyzing ETEC-derived vesicles. First, using a defined population of purified vesicles, we biochemically characterize vesicles from ETEC. We demonstrate that these vesicles are composed of a subset of outer membrane lipids, lipopolysaccharides (LPS), outer membrane proteins, and periplasmic proteins. Loosely associated proteins in crude vesicle preparations were dissociated from vesicles by density gradient centrifugation. We show that LT is tightly associated with purified vesicles and is physiologically active in a toxin bioassay. A portion of vesicle-associated LT could be removed under dissociating conditions, suggesting that some LT is present on the vesicle surface. In addition, our data indicate that LT is enriched in vesicles as compared with a periplasmic enzyme not associated with virulence. The location of LT on both the vesicle exterior and interior was confirmed with protease susceptibility, membrane disruption experiments, and affinity chromatography. These results suggest that vesicles play an important role in the dissemination of LT to host cells during a bacterial infection.
EXPERIMENTAL PROCEDURES
Cell Culture and Reagents
E. coli strains HB101 and ETEC 2 (ATCC 43886) were grown either in LB (1% tryptone, 0.5% yeast extract, 1% NaCl) or CFA broth (1% casamino acids, 0.15% yeast extract, 0.005% MgSO4, 0.005% MnCl2) (35). Y1 adrenal cells (ATCC CCL-79) were maintained in F-12K Kaign’s modification media supplemented with 2.5% fetal calf serum and 12% horse serum Life Technologies, Inc. as per ATCC instruction. Unless specified, reagents were purchased from Fisher.
Vesicle Purification
Cells from overnight-shaking broth cultures were removed by centrifugation (10,000 × g, 10 min). The supernatant was concentrated 100-fold through a 70-kDa tangential filtration device (Pall-Gelman). The retentate was centrifuged again to remove remaining cells (6000 × g, 10 min) and filtered through a 0.45-µm vacuum filter. The resulting filtrate was centrifuged to pellet vesicles (40,000 × g, 60 min). Pellets were resuspended in 50 mm HEPES, pH 6.8, and filter-sterilized through a 0.45-µm Ultra-free filter (Millipore). The crude vesicle preparation was adjusted to 45% Optiprep (Accurate) in 0.4 ml, transferred to the bottom of a 12.5-ml Ultracentrifuge tube, and layered with Optiprep/HEPES (3 ml 35%, 3 ml 30%, 2 ml 25%, 2 ml 20%, 1 ml 15%, 1 ml 10%). Gradients were centrifuged (100,000 × g, 180 min), and fractions of equal volumes were removed sequentially from the top.
Cell Fractionation
Outer and inner membranes were purified as described previously (36), with some modification. Cells were harvested (6000 × g, 10 min) from a 250-ml overnight culture and resuspended in one-twentieth original volume in 10 mm HEPES, pH 7.8, 0.5 mm EDTA (HE). Cells were lysed by a French press twice at 20,000 psi, and unbroken cells were removed by centrifugation as above. The supernatant was applied to a sucrose cushion (2 ml of 55% sucrose, 0.5 ml of 5% sucrose in HE) and centrifuged (150,000 × g, 3 h). Membranes were removed from the interface with a syringe needle (19 gauge) and diluted to 2.5 ml in HE. Diluted membranes were loaded onto a isopycnic sucrose gradient (0.4 ml of 60% sucrose, 0.9 ml of 55% sucrose, 2.2 ml of 50%, 45%, and 40% sucrose, 1.3 ml of 35% sucrose, and 0.4 ml of 30% sucrose in HE) and centrifuged (150,000 × g, 18 h). Outer and inner membranes were visualized by indirect light and extracted from the gradient using a syringe needle. Periplasm was prepared using a modified procedure (37). Bacteria were harvested from an overnight culture (6000 × g, 10 min) and resuspended in one-half of the original culture volume with 2 mg/ml polymyxin B (Sigma) in phosphate-buffered saline (pH 7.2). Resuspended cells were incubated with gentle shaking at 37 °C for 60 min. Spheroplasts were pelleted (6000 × g, 10 min), and the supernatant containing periplasmic components was stored at −20 °C.
Electron Microscopy
Vesicles were removed from Optiprep by high speed centrifugation (150,000 × g, 30 min) and resuspended in a minimal volume of 50 mm HEPES, pH 6.8. Vesicles were placed on 400 mesh grids, fixed with 1% glutaraldehyde, rinsed with 100 mm ammonium acetate, and visualized by negative staining with 1% uranyl acetate.
Protein and Membrane Analysis
Samples were boiled for 3 min in sample buffer (38), applied to SDS-PAGE minigels, and run at constant voltage (100 V for 12.5% gels, 120 V for 17% gels). Gels were transferred and immunoblotted (39), Coomassie Blue-stained (40), or silver-stained (41) as described previously. For N-terminal sequencing, gels were transferred to PVDF, the blots were stained with Amido Black, and bands of interest were excised and N-terminal-sequenced by Dr. John Leszyk, University of Massachusetts Medical School. Glycerophospholipid and lipid A preparations and thin layer chromatography were performed as described (42).
Enzyme Assays
NADH oxidase activity in samples containing 10 µg of total protein was measured as described previously (43). β-Galactosidase activity was measured as described (44). Alkaline phosphatase activity was measured according to the Sigma 104 alkaline phosphatase kit. 0.05 ml of 221 phosphate buffer, 0.05 ml of p-nitrophenyl phosphate, and 0.01 ml of either periplasm or vesicles were incubated (25 °C, 15 min), and the reactions were stopped with 0.1 ml of 5.0 n NaOH. Absorbance at 410 nm was compared with a p-nitrophenyl standard to establish sigma units of activity. 1 sigma unit is the amount of enzyme required to liberate 1 µmol of substrate/h under standard assay conditions.
Dissociation Assay
1.0 µg of vesicle preparation was treated in 1% SDS, 0.8 m urea, 0.5 m NaCl, 0.1 m sodium bicarbonate, pH 11.0, or 50 mm HEPES, pH 6.8, (37 °C, 60 min) or in HEPES (4 °C, 60 min) in a total volume of 20 µl. Samples were centrifuged (30 min), the supernatants were removed, and pellets were resuspended in HEPES buffer (20 µl). Samples were analyzed by SDS-PAGE and silver-stained.
Toxin Activity Assay
4 × 10⁵ Y1 cells were plated in 24-well polystyrene plates (Corning) and allowed to adhere for 2–4 h. The growth medium was replaced with indicated samples diluted in F-12K media (250 µl). Morphology was scored, blinded, 18 h later. Toxin activity scores: 1 = <25% rounding, 2 = 26–50% rounding, 3 = 51–75% rounding, 4= >76% rounding (5). All Y1 assays were performed in duplicate.
LT Enzyme-linked Immunosorbent Assay (ELISA)
LT ELISA was performed as described previously (45). Microtiter plates were coated with 1.5 µg/ml GM1. A soluble LT standard curve was generated using 10 ng/ml–1 pg/ml LT (Sigma). LT was detected using LT cross-reactive anti-CT polyclonal antisera (Sigma).
Membrane Disruption Assay
Vesicles (10 µg) were incubated (37 °C in 0.1 m EDTA, 120 min) then applied to the LT ELISA. To verify the release of soluble proteins, reactions were centrifuged (150,000 × g, 180 min) to remove membranes. Supernatants were applied to SDS-PAGE, transferred to PVDF (Amersham Pharmacia Biotech), and immunoblotted using a polyclonal anti-AcrA rabbit antibody (a generous gift of H. Nikaido).
Protease Protection Assay
Vesicles (1.5 µg) were incubated (37 °C, 120 min) with Pronase (Roche Molecular Biochemicals) (0.1 mg/ml in 0.1 m Tris, pH 7.5) or with GM1 (5 µg/ml in 0.1 m Tris, pH 7.5). Samples were diluted to a vesicle concentration of 2.5 µg/ml in F-12K growth media and applied to Y1 cells, and morphological changes were scored after 18 h. Reactions (1 µg of vesicle protein) were also immunoblotted using anti-AcrA antibody.
Vesicle Affinity Chromatography
ETEC and HB101 vesicles (40 µg) were diluted (200 µl in 50 mm HEPES, pH 6.8) and incubated (25 °C, 18 h) with 40 µl of Sepharose CL-6B beads (20% v/v in 50 mm HEPES, pH 6.8) (Sigma). Beads were gently pelleted (1000 × g) and washed 3 times with 50 mm HEPES, pH 6.8. Beads and the vesicle load were boiled in sample buffer. One-half the volume was applied to SDS-PAGE and Coomassie-stained, and the other half-volume was applied to SDS-PAGE, transferred to PVDF, and immunoblotted using anti-AcrA antibody.
RESULTS
Isolation of Vesicles
A critical evaluation of bacterial vesicle integrity and of vesicle protein associations is unprecedented in the literature but is necessary to evaluate their biogenesis and function. To begin a careful biochemical analysis of LT secretion via vesicles, we needed to develop a vesicle isolation protocol that maximized vesicle purity, sterility, and yield. Vesicles were purified from concentrated, cell-free culture supernatants of a human enterotoxigenic E. coli isolate (ETEC 2) expressing LT and a laboratory E. coli strain (HB101) that does not express LT. We reasoned that to obtain a high yield vesicle preparation, we would collect vesicles from late growth phase cultures that did not contain lysed cell debris. Both log phase and overnight cultures exhibited 6–10-fold less β-galactosidase activity in supernatants than in cells, indicating that no appreciable increase in cell lysis occurred in late growth phase. In addition, vesicles appeared to be stable and accumulated in culture supernatants with time.2 Because we were interested in investigating LT secretion and CFA media was shown to up-regulate LT expression (35), we used CFA for ETEC cultures unless otherwise noted.
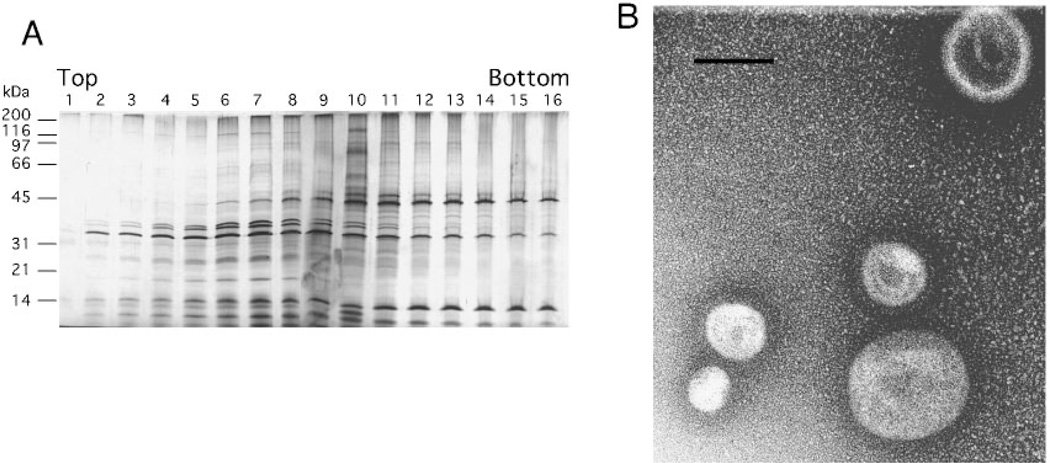
We purified the crude vesicles by subjecting the preparation to velocity density centrifugation. This procedure is based on the migration of membrane vesicles to a position in the gradient equal to their density. Only proteins integral, internal, or tightly associated with membrane lipids will move significantly through the gradient. Centrifuged gradients with samples loaded on the bottom were analyzed by removing equal fractions stepwise from the top of the gradient. Equal amounts of each fraction were then analyzed by SDS-PAGE and silver staining. An example of gradient fractions is shown (Fig. 1A). The major outer membrane proteins (OMPs) C, F, and A (38, 38, and 35 kDa, respectively) peaked in gradient fractions 6–10, suggesting the presence of outer membrane-derived material. Gradient fractions were pooled and examined by electron microscopy for the appearance of vesicles. No vesicles were present in off-peak fractions 12–16, whereas vesicles were abundant in pooled peak fractions 6–10 (Fig. 1B). Vesicles ranged in size from 50–200 nm in diameter, with a mean of 112 nm (n = 42). Most of the proteins peaked in the same fractions as OMPs F, C, and A, suggesting that these proteins were tightly associated with or integral to vesicles. Some proteins at 14 and 45 kDa, for example, appeared less tightly associated, because they did not migrate as far up the gradient as the OMPs. These data demonstrate that specific proteins in the vesicle preparation copurify with the major outer membrane proteins and are associated with spherical vesicles, as visualized by electron microscopy. Other proteins that appear in trailing fractions may have been loosely associated with vesicles. On average, 2–3 mg of sterile, gradient-purified vesicles were obtained from 10 liters of ETEC 2 cell culture, which was approximately 10-fold higher yield than obtained from HB101 cultures.
Fig. 1. Velocity gradient centrifugation separates vesicles from loosely associated proteins.
A, ETEC 2 vesicles (140 µg) were loaded on the bottom of an Optiprep gradient. After centrifugation, equal volumes (20 µl) of 750-µl fractions were applied to 12.5% SDS-PAGE and silver-stained. B, electron micrograph of ETEC 2 vesicles after gradient purification. Vesicles were visualized by negative staining and measured. Bar = 100 nm.
Composition and Characterization of Vesicle Components
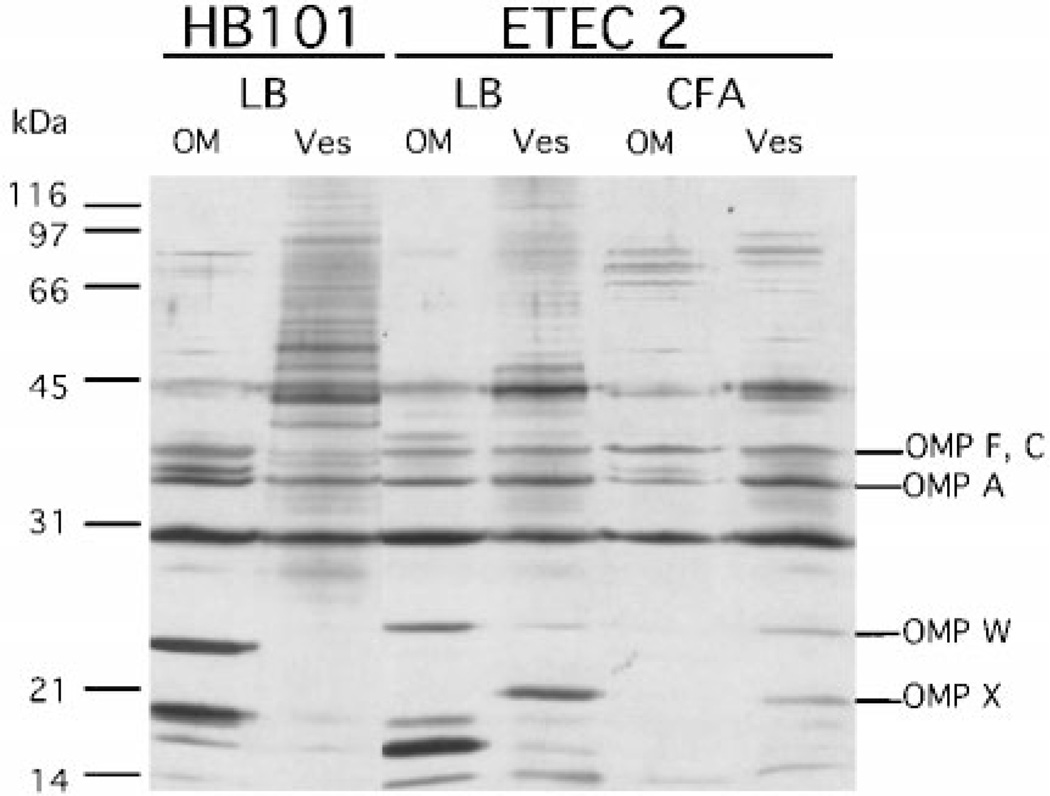
The bacterial origin of vesicles has not yet been determined; however, they have been proposed to be derived mainly from outer membranes. To assess the contribution of outer membranes in vesicles, protein profiles of outer membranes and vesicles derived from bacteria grown in LB and CFA were compared by SDS-PAGE and silver staining (Fig. 2). Although not quantitative, silver staining is useful to examine subtle differences in protein composition between samples. Outer membrane and vesicle protein profiles differed between HB101 and ETEC 2 (Fig. 2, compare OM and Ves lanes). In both strains, vesicles resembled but were not identical to outer membranes. In addition, ETEC outer membranes and vesicles migrated to identical positions in the gradients (corresponding to 1.2 g/ml), consistent with prior reports that outer membranes and vesicles are of the same density and lipid:protein ratio (20) (data not shown). We verified that inner membrane and cytosolic components were absent from ETEC 2 vesicles using assays specific for these cellular compartments (Table I). The activity of NADH oxidase, which is present in the inner membrane, but not the outer membrane, was barely detectable in vesicles. β-Galactosidase, a cytoplasmic protein, was not detectable in vesicles by either immunodetection or enzyme activity. In contrast, the periplasmic proteins alkaline phosphatase and AcrA (46) were detectable in vesicles as well as periplasm (Table I and data not shown). Thus, the vesicle preparation consists of specific outer membrane and periplasmic proteins.
Fig. 2. Comparison of HB101 and ETEC 2 outer membranes and vesicles: variation with strain and growth conditions.
Outer membranes (OM) and vesicles (Ves) (0.5 µg) were applied to 12.5% SDS-PAGE and silver-stained. OMPs F, C, and A are well established, abundant proteins in the outer membrane. OmpX and OmpW were identified by N-terminal sequencing.
Table I.
Enzymatic activities detected in subcellular compartments and vesicles
| Enzyme | Cytoplasm | Inner Membrane |
Periplasm | Outer Membrane |
Vesicles |
|---|---|---|---|---|---|
| NADH oxidase (units/µg) | 238 | 13 | 18 | ||
| Alkaline phosphatase (sigma units/µg × 10−3) | 324 | 184 | |||
| β-Galactosidase | + | − |
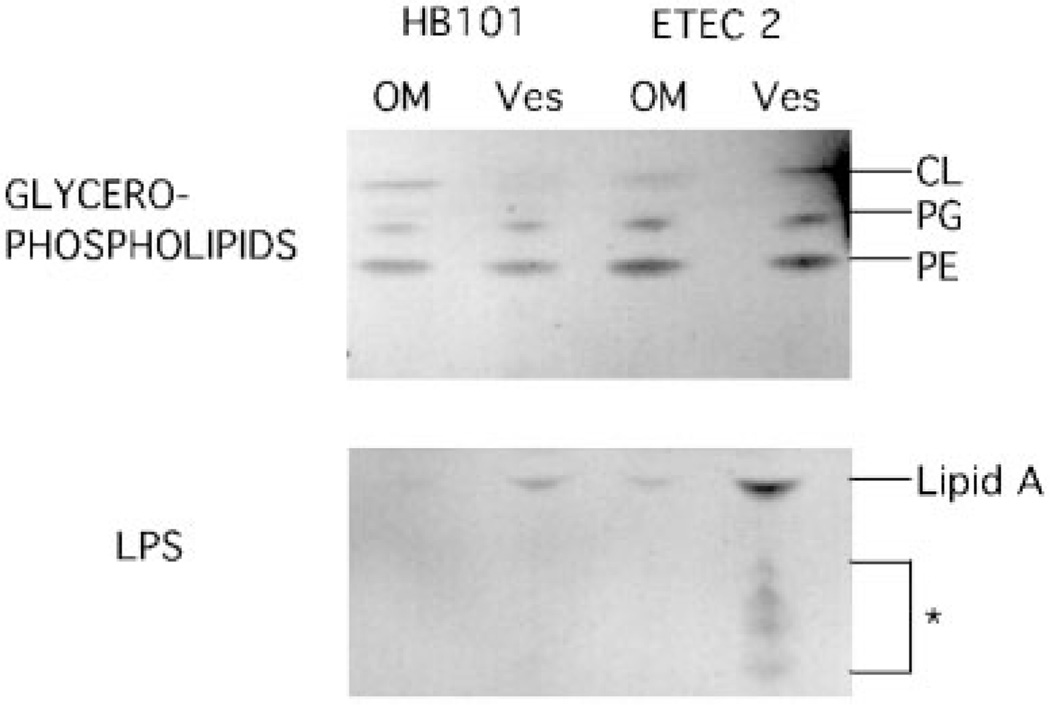
To further investigate the origin of vesicles, we analyzed the preparation for lipid content. Thin layer chromatography revealed a conserved lipid composition between outer membranes and vesicles. LPS, uniquely found in the outer membrane, as well as the glycerophospholipids, phosphatidylethanolamine, phosphatidylglycerol, and cardiolipin were present in both outer membranes and vesicles (Fig. 3). Modified lipid A species reproducibly appeared to be present in ETEC vesicles (Fig. 3, ETEC 2 Ves). Immunoblot analysis showed that Braun’s lipoprotein is not enriched in vesicles compared with outer membranes (data not shown). These results suggest that the lipid makeup of vesicles is similar to the outer membrane, although it remains unclear which specific types of phosphatidylethanolamine, phosphatidylglycerol, cardiolipin, and LPS are enriched in vesicles.
Fig. 3. Thin layer chromatography of HB101 and ETEC 2 outer membranes (OM) and vesicles (Ves).
Glycerophospholipid and LPS analyses were performed on outer membrane and vesicle preparations (10 µg of protein). PE, phosphatidylethanolamine; PG, phosphatidylglycerol; CL, cardiolipin; *, modified lipid A.
Interestingly, growth in different media dramatically affected outer membrane protein composition but only subtly affected the visible vesicle protein composition (Fig. 2, compare ETEC 2, LB and CFA). For example, the band at 18 kDa appeared to be somewhat more abundant in LB vesicles than in CFA vesicles. The banding patterns of higher molecular weight proteins also differed slightly in different media. Furthermore, we noted that the protein profiles of vesicles isolated from log phase and overnight cultures appeared similar (data not shown). Therefore, the inclusion of particular outer membrane proteins into vesicles does not appear to be strictly due to their abundance in the outer membrane.
A difference between vesicle and outer membrane protein profiles suggests that only specific sites on the bacterial outer membrane with distinct protein compositions are able to form vesicles. Alternatively, proteins may be specifically included or excluded from the vesicles. Beveridge’s work on Pseudomonas aeruginosa vesicles demonstrates that specific LPS antigens were enriched in vesicles as compared with the outer membrane (47). We noted several proteins that appeared to be enriched in vesicles compared with outer membrane preparations. For example, proteins of 21 and 48 kDa were present in ETEC 2 LB vesicles but not apparent in outer membrane (Fig. 2, compare ETEC2 LB, OM and Ves lanes). Conversely, a 27-kDa band was more enriched in the outer membranes of ETEC 2 than in vesicles. As expected, differences in outer membrane and vesicle preparations were also apparent between species (Fig. 2, compare HB101 LB and ETEC2, LB lanes). Based on these observations, we propose that vesiculation occurs at outer membrane sites with specific protein compositions.
Bands at 27 and 18 kDa observed in ETEC 2 outer membrane and vesicle preparations were not present in the HB101 preparations and, thus, may be important to pathogenicity. These bands were excised from gels transferred to PVDF for N-terminal sequencing. The sequences obtained were AT-STVTGGYA for the 18-kDa protein and HEAGEFFMRA for the 27-kDa protein. Analysis of the identified sequences using the BLAST program clearly identified (with 100% identity) the proteins as OmpX and OmpW, respectively, and their positions are indicated in Fig. 2. OmpX bears a high degree of homology to several virulence factors, including the ail gene product of Yersinia species, and the OmpX adhesin of Enterobacter cloacae (48–50). The function of OmpW in E. coli is unknown, although homologs exist in Comamonas acidivorans, V. cholerae, and Pseudomonas oleovorans (51–53). Since OmpX and OmpW are present in vesicles produced by pathogenic E. coli, they may contribute to the possible role vesicles play in pathogenesis.
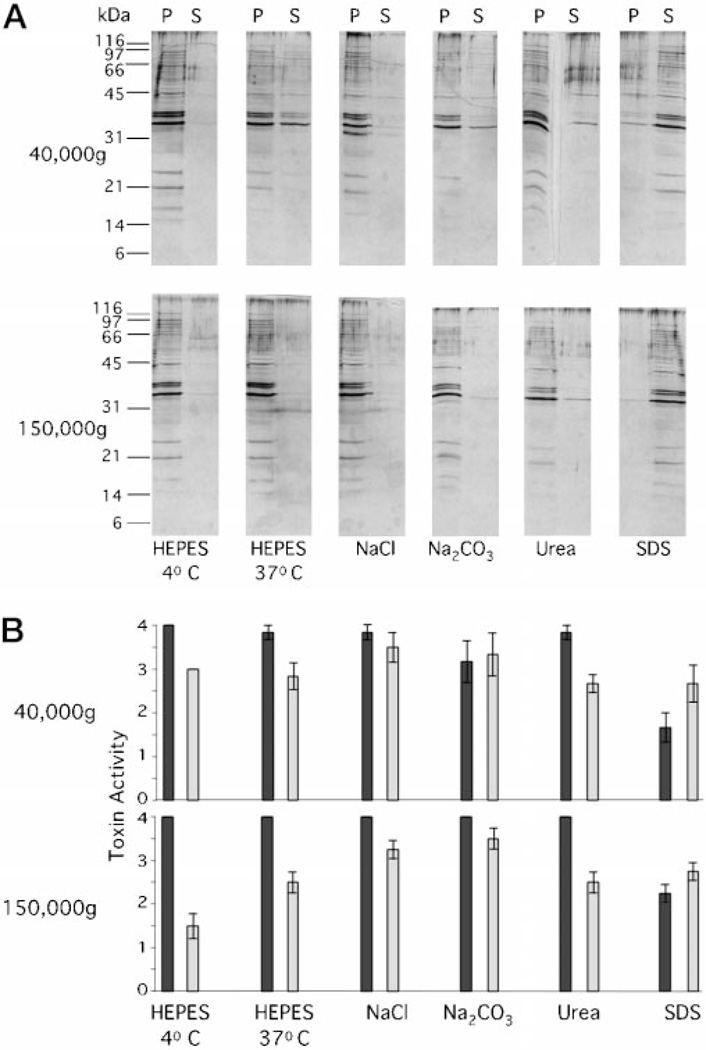
By using denaturing and dissociating conditions, we wanted to investigate which vesicle-associated proteins were internal or integral and which were associated with the outside of the vesicles (Fig. 4A). In a control experiment, treatment with 1% SDS solubilized vesicles and liberated all proteins to the supernatant. However, treatment with either 0.5 m NaCl, 0.1 m Na2CO3, pH 11.0, or 0.8 m urea did not dissociate proteins to a greater extent than that demonstrated by treatment with 50 mm HEPES buffer alone at 37 °C. A small but consistent amount of protein did remain in the supernatant after centrifugation at 40,000 × g (Fig. 4A, upper panels). We believe that this “floating fraction” is representative of the population of vesicles smallest in diameter, which had been associated with larger, more dense vesicles. Treatment at 37 °C with high salt, pH, or even buffer alone may have disrupted these intravesicle associations, leaving the smaller vesicles unable to form pellets at 40,000 × g. Indeed, high speed centrifugation (150,000 × g) pelleted the proteins in these preparations, whereas detergent-solubilized material remained in the supernatant (Fig. 4A, lower panels). In addition, incubation in HEPES at 4 °C prevented the liberation of these vesicle proteins into the supernatants. Therefore, the majority of proteins seen in our vesicle profiles are either internal, integral, or tightly associated to vesicles.
Fig. 4.
A, vesicle proteins are not extensively dissociated by ionic disruption or urea. Vesicle protein (1 µg) was treated for 60 min at 37 °C (unless specified) in equal volumes (20 µl) containing 50 mm HEPES, pH 6.8, 0.5 m NaCl, 0.1 m Na2CO3, pH 11, 0.8 m urea, or 1% SDS. Samples were centrifuged (30 min, 40,000 × g or 150,000 × g, as indicated), the supernatants were removed, and pellets were resuspended in equal volumes (20 µl). The pellets (P) and supernatants (S) were applied to 17% SDS-PAGE and silver-stained. B, LT activity is present in both pellets and supernatants after dissociation treatment. Pellets (black bars) and supernatants (gray bars) from samples described in panel A were applied to Y1 cells (1.25 µg/well). Error bars = ± 1 S.E., n = 3.
Physiologically Active LT Is Associated with Vesicles
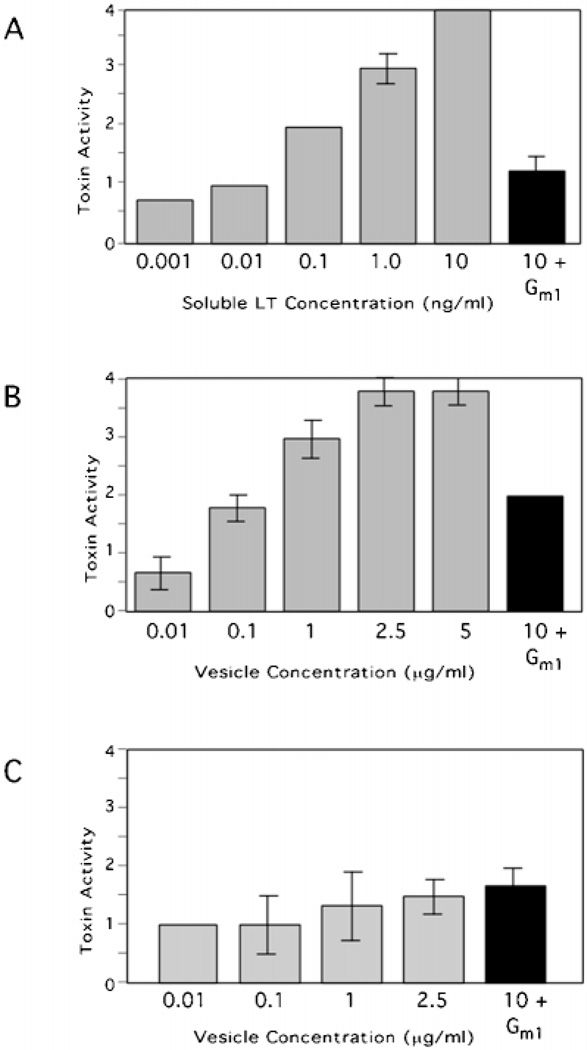
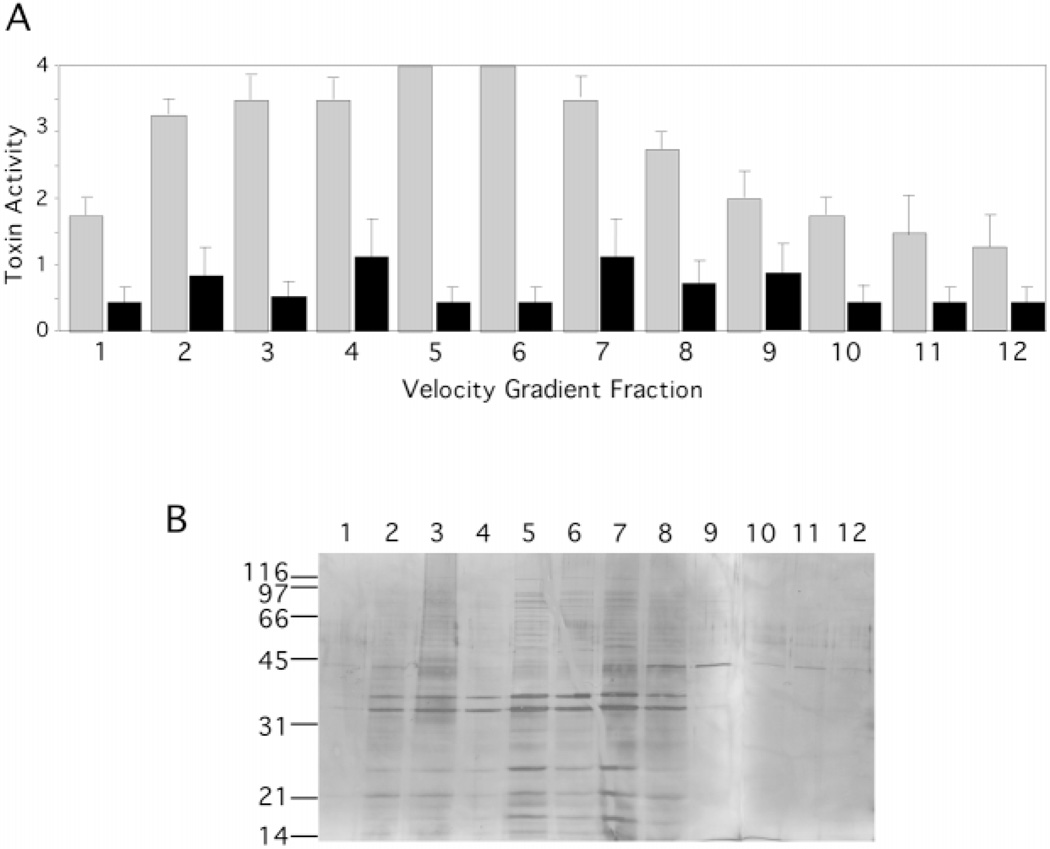
Because the virulence factor, LT, has been reported to be periplasmic as well as associated with sedimentable LPS from ETEC culture supernatants (20, 21), we wanted to determine whether LT was present in our vesicle preparation. We used the well established Y1 adrenal cell bioassay to measure LT activity. Upon exposure to LT, Y1 adrenal cells undergo morphological changes from a spindly to a round shape (5). Purified soluble LT elicited a linear and dose-dependent response on Y1 cell morphology inhibitable by soluble GM1, the eukaryotic receptor for LT (Fig. 5A) (5). ETEC 2 vesicles also elicited a dose-dependent response that was inhibitable with GM1 (Fig. 5B). The response to HB101 vesicle was minimal, saturable, and not inhibitable by GM1 (Fig. 5C), indicating that this was a baseline response by Y1 cells to the presence of bacterial products. This background did not obstruct our ability to score vesicle associated LT activity, because we could identify LT-dependent morphological changes using GM1 inhibition. To assess whether the LT in our vesicle preparation was nonspecifically associated with vesicles, we tested velocity gradient ETEC 2 vesicle fractions in the Y1 cell activity assay. LT activity (Fig. 6A, gray bars) peaked in the same fractions as the vesicle proteins peaked (Fig. 6B). Moreover, this activity was almost completely ablated with the addition of GM1 (Fig. 6A, black bars). Therefore, LT was active and specifically associated with ETEC-derived vesicles isolated from culture supernatants.
Fig. 5. Soluble and vesicle-associated LT induces morphological changes in Y1 cells that are inhibitable by GM1.
Y1 adrenal cell morphology was scored after incubation with soluble LT (A), ETEC 2 vesicles (B), or HB101 vesicles (C). To demonstrate LT-specific activity, GM1 (100 ng) was preincubated with LT and vesicles (black bars). Buffer alone resulted in a morphological score of 0 in all experiments. Error bars = ± 1 S.E., n = 3.
Fig. 6. GM1-inhibitable LT activity comigrates with the ETEC 2 vesicle peak on an Optiprep gradient.
A, equal volumes (100 µl) of Optiprep gradient fractions (approximately 5 µg/ml in the peak fraction) were incubated with Y1 adrenal cells and scored after 18 h. To demonstrate LT-specific activity, GM1 (100 ng) was preincubated with fractions (black bars). Optiprep alone resulted in a morphological score of 0. Error bars=±1 S.E. B, fractions (20 µl) analyzed in panel A were applied to 12.5% SDS-PAGE and silver-stained.
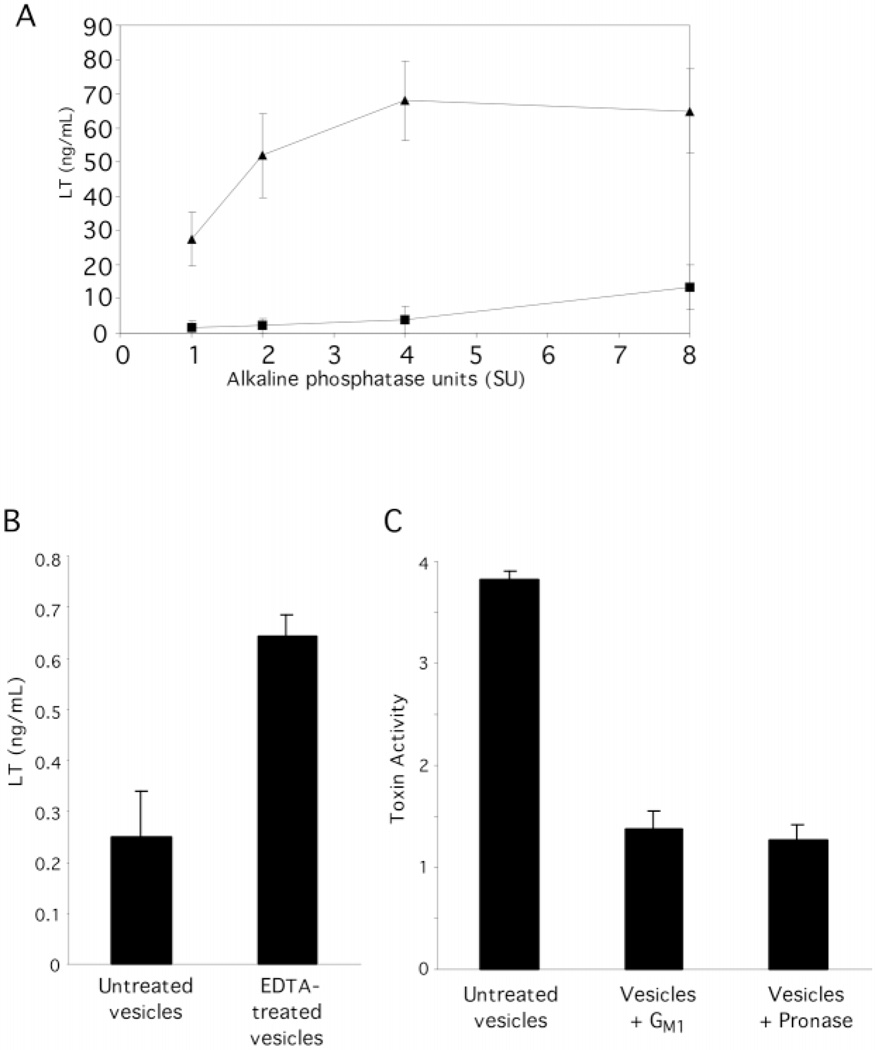
We wondered if LT was an enriched component of vesicles as compared with another periplasmic component. We used an LT ELISA based on the binding affinity of GM1 for LT (45) as well as the Y1 activity assay to quantitate LT in our sample. For the LT ELISA, 96-well polystyrene plates were coated with GM1 before incubation with ETEC 2 and HB101 vesicles. Soluble LT elicited a linear, dose-dependent curve in this assay (not shown). When periplasm and vesicles containing equal amounts of alkaline phosphatase activity were analyzed by LT ELISA, LT appeared to be enriched in vesicles as compared with periplasm (Fig. 7A). ETEC 2 vesicles bound to GM1-coated ELISA plates reacted specifically with both anti-LT and anti-E. coli LPS antibody, suggesting that detected LT was not liberated from vesicles in this assay (data not shown). HB101 vesicles did not bind to GM1 plates in this assay. The ELISA appeared to be saturated for vesicle preparations containing greater than 2 sigma units of alkaline phosphatase activity. The linear portion of the curve was used to estimate a 20-fold enrichment of LT to alkaline phosphatase in vesicles as compared with periplasm. The more sensitive but less quantitative Y1 adrenal cell bioassay confirmed that ETEC 2 vesicles contained a higher ratio of LT to alkaline phosphatase activity compared with periplasm (data not shown). The Y1 cell activity elicited by both vesicles and periplasm was inhibited with GM1. Together, the ELISA and Y1 assay results indicate an enriched association of active LT with vesicles.
Fig. 7. LT enrichment and localization.
A, ETEC 2 vesicles (triangles) and periplasm (squares) containing equal amounts of alkaline phosphatase activity were subjected to the LT ELISA. HB101 vesicles (8 sigma units (SU)) yielded an absorbance corresponding to one-fourth that of ETEC 2 vesicles (8 sigma units). B, intact and 0.1 m EDTA-disrupted vesicles (10 µg) were applied to the LT ELISA. The presence of EDTA did not affect the soluble LT standard curve. C, ETEC 2 vesicles (2.5 µg/ml), untreated, preincubated with GM1, and digested with Pronase, were applied to the Y1 cell assay, and the morphology was scored, blinded. HB101 vesicles demonstrated normal background activity. Error bars = ± 1 S.E., n = 3.
Next, we were interested in discerning whether the vesicle-associated LT was internal or external. We used the dissociation conditions described earlier to assay LT location. When samples from the dissociation assay (Fig. 4A) were applied to Y1 cells, LT was found both in the 40,000 × g supernatants and the pellets (Fig. 4B, upper graph). With a 150,000 × g centrifugation step, supernatant activity could be reduced only in the HEPES-treated sample (Fig. 4B, lower graph). This indicated that LT remaining in the supernatant was soluble rather than associated with residual vesicles, as all vesicle membrane proteins were removed from supernatants after a 150,000 × g spin (Fig. 4A, lower panels). Thus, a portion of the physiologically active LT was internal and copurified with vesicles, and a portion could be liberated into the supernatants under dissociating conditions and may be external.
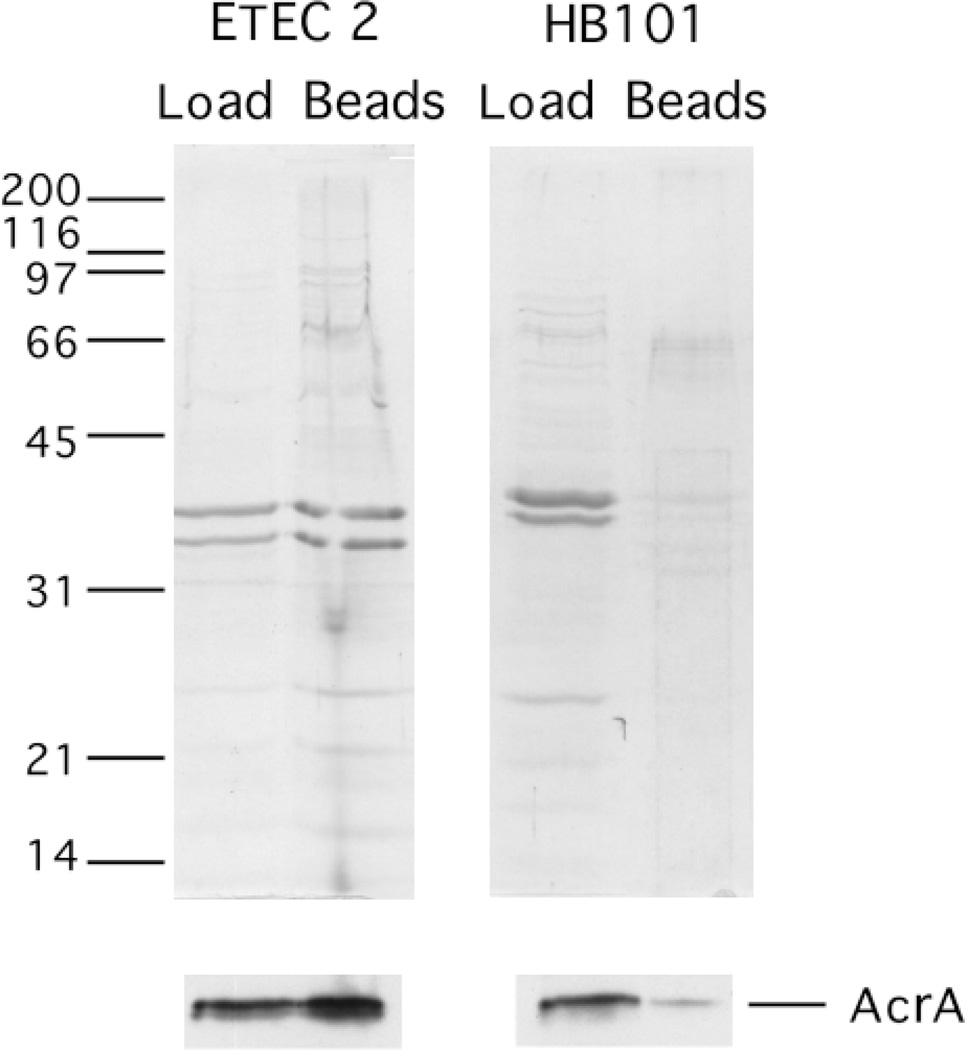
The location of LT associated with vesicles was further addressed using membrane disruption, protease sensitivity, and vesicle affinity chromatography assays. To confirm that LT was inside the vesicles, LT ELISA results were compared for EDTA-disrupted and intact ETEC 2 vesicles. A nearly 3-fold increase in LT was detected after 0.1 m EDTA treatment (Fig. 7B). The level of AcrA, a periplasmic protein (46), was higher in EDTA-treated vesicle supernatants as compared with the supernatants of untreated vesicles, demonstrating the liberation of other periplasmic contents (data not shown). To assay the exterior location of LT on the vesicle, the protease sensitivity of vesicle-associated LT was examined. Pronase treatment of ETEC 2 vesicles ablated toxin activity on Y1 cells to background levels (Fig. 7C), whereas AcrA was largely protected from degradation by Pronase (data not shown). This indicated that at least a portion of the LT activity associated with ETEC vesicles was due to exterior LT. Finally, we took advantage of the fact that LT binds agarose (Sepharose) with high affinity (54). If LT associated with the exterior of ETEC vesicles is available for receptor binding, we reasoned that Sepharose beads should precipitate ETEC vesicles, and HB101 vesicles would not bind. As shown in Fig. 8, ETEC 2 vesicles associated with Sepharose beads, whereas HB101 vesicles did not bind the beads. Immunodetection of AcrA in the Sepharose-bound ETEC vesicles indicated that these vesicles were intact (Fig. 8, lower panels). Thus, LT is present on the surface of vesicles and is capable of binding to its receptor. Together, these biochemical analyses clearly support the conclusion that LT is on the surface as well as in the lumen of vesicles.
Fig. 8. Affinity binding of intact ETEC vesicles via exterior LT.
ETEC 2 and HB101 (40 µg) vesicles were incubated with Sepharose beads. A portion of the load (40 ng) and one-half of the Sepharose-bound proteins were applied to SDS-PAGE and either Coomassie-stained (upper) or transferred to PVDF and immunoblotted using anti-AcrA antibody (lower).
DISCUSSION
This work describes the first concerted attempt to purify and characterize LT-containing, ETEC-derived vesicles. We developed a vesicle purification scheme and, by analyzing the biochemical components, identified a secretion mechanism for the virulence factor, LT. Although protein and lipid composition analyses indicated that vesicles are derived from outer membranes, there are subtle differences in protein profiles between outer membrane preparations and vesicles which suggest that packaging of components in vesicles may be a selective process. Periplasmic proteins LT, alkaline phosphatase, and AcrA were found in purified vesicle preparations; however, LT was enriched compared with alkaline phosphatase. Vesicle-associated LT was physiologically active, and in the absence of other identified LT secretory mechanisms, we propose that vesicles may play a role in the delivery of the toxin to host cells.
Vesicles produced by ETEC during normal growth are stable in culture. Electron microscopy indicated that vesicles are spherical in shape, with a range in diameter from 50 to 200 nm. A comparison of log phase and stationary phase-derived vesicles demonstrated little difference in the quantity or quality of vesicle proteins. The vesicles floated to a discrete density on a velocity gradient, as verified by electron microscopy, and most proteins migrated to the same density as the major OMPs, indicating these are integral or internal vesicle proteins. When treated with high salt, high pH, or urea, most vesicle proteins were not released to a greater extent than with buffer alone, further proving that vesicle proteins are associated nonionically and specifically.
SDS-PAGE and thin layer chromatography revealed that the protein, lipid, and LPS profiles of vesicles and outer membranes bear great similarity to each other but are not identical. Inner membrane and cytosolic components are not included in vesicles. The exclusion of all cellular components except outer membrane and periplasm supports the model of vesicle formation put forth by Kadurugamuwa and Beveridge (25, 55). Outer membranes “bleb” out, capturing periplasmic components, and eventually pinch off.
Based on compositional and quantitative data, we suggest that there is an actively regulated selection of appropriate proteins for packaging into vesicles. First, we observed differences between outer membrane and vesicle proteins. Although growth media dramatically influenced outer membrane protein expression, vesicle composition changed only subtly, indicating that it might not be controlled simply by protein abundance. Environmental influence on the protein composition of vesicles may be important in bacterial pathogenicity, since bacteria encounter marked differences in pH and nutrients in vivo. Second, when periplasm and vesicles were analyzed by either an LT ELISA or the Y1 cell assay, both revealed that LT is enriched in vesicles compared with periplasm, with respect to alkaline phosphatase. Therefore, although both components were periplasmic in the cell, they were not secreted equally into vesicles. Finally, we obtained significantly more 10-fold) vesicles from the pathogenic ETEC strain than the laboratory E. coli strain; thus, the production of vesicles appears to be upregulated in virulent strains. These observations may result from a compositional difference at the site for outer membrane vesiculation or from a specific process of inclusion and exclusion of cellular material into or onto vesicles.
We propose that ETEC 2 vesicles play a role in pathogenesis due to their demonstrable LT specific activity in the Y1 adrenal cell assay. Y1 cells respond to LT associated with ETEC 2 vesicles in a dose-dependent manner that was inhibitable by GM1, the cell surface receptor for LT. In contrast, GM1-induced morphological changes were not induced when Y1 cells were exposed to identical concentrations of HB101 vesicles. When the fractions from an Optiprep velocity gradient were applied to the Y1 cells, LT activity peaked with the vesicle peak fractions, indicating that LT is specifically associated with vesicles. LT secretion via vesicles is the only known export and delivery pathway for the toxin.
The ability to dissociate LT from vesicles using NaCl, Na2CO3, and urea and the fact that intact vesicles bound to GM1-coated ELISA plates suggested that LT is presented on the exterior of vesicles. This is surprising, given the dogma that LT remains periplasmic (56). The location of LT in the lumen was confirmed by an increase in detectable LT by ELISA after membrane disruption. The exterior location of LT and its availability to bind receptors was further demonstrated by a decrease in LT activity after protease treatment and by the ability of LT to mediate binding of vesicles to Sepharose beads. Therefore, LT on the exterior of vesicles could act both as a toxin and as an adhesin in vivo. Shiga toxin has been detected inside E. coli O157:H7 vesicles (24). The presence of invasion proteins, IpaB, C, and D in Shigella flexneri vesicles, which may play a role in vesicle internalization by Henle cells, has been reported previously (31). Enrichment of adherence and invasion-related proteins such as OmpX and OmpW in ETEC vesicles reveals another possible mechanism whereby toxin-laden vesicles can interact specifically with host cells. How LT associates with the cell or vesicle exterior is not yet clear. LT may be actively transported out of the cell and associated with the cell exterior possibly via homologues of the main terminal branch of the general secretory pathway. Alternatively, surface association may occur by a more passive pathway such as cell lysis followed by membrane association. Further studies must be conducted to determine how vesicles are made, the mechanism by which LT reaches the exterior of vesicles, and the role that LT associated with vesicles plays in pathogenesis.
Acknowledgments
We thank K. Mason, S. Abraham, M. Casar, and M. Rosser for critical evaluation of this manuscript and suggestions. Also, thanks to T. Wyckoff for assistance with TLC, G. Klimpel for anti-lipoprotein antibody, H. Nikaido for anti-AcrA antibody, and M. Reedy and C. Lucaveche for electron microscopy training and facilities.
Footnotes
This work was supported by a Burroughs Wellcome Career Award (to M. J. K.) and National Institutes of Health Training Grant GM-07184 (to A. L. H.).
The abbreviations used are: ETEC, enterotoxigenic E. coli; LT, heat labile enterotoxin; CT, cholera toxin; OMP, outer membrane protein; LPS, lipopolysaccharides; CFA, colony factor antigen; PVDF, polyvinylidene difluoride; ELISA, enzyme-linked immunosorbent assay; PAGE, polyacrylamide gel electrophoresis; GM1, Galβ1,3GalNAcβ1–4(NeuAcα2,3)4Galβ1,4Glc ceramide.
A. L. Horstman and M. J. Kuehn, unpublished data.
REFERENCES
- 1.Kunkel SL, Robertson DC. Infect. Immun. 1979;25:586–596. doi: 10.1128/iai.25.2.586-596.1979. [DOI] [PMC free article] [PubMed] [Google Scholar]
- 2.Spangler BD. Microbiol. Rev. 1992;56:622–647. doi: 10.1128/mr.56.4.622-647.1992. [DOI] [PMC free article] [PubMed] [Google Scholar]
- 3.Wensink J, Gankema H, Jansen WH, Guinee PA, Witholt B. Biochim. Biophys. Acta. 1978;514:128–136. doi: 10.1016/0005-2736(78)90082-2. [DOI] [PubMed] [Google Scholar]
- 4.Lindenthal C, Elsinghorst EA. Infect. Immun. 1999;67:4084–4091. doi: 10.1128/iai.67.8.4084-4091.1999. [DOI] [PMC free article] [PubMed] [Google Scholar]
- 5.Donta ST, Moon HW, Whipp SC. Science. 1974;183:334–336. doi: 10.1126/science.183.4122.334. [DOI] [PubMed] [Google Scholar]
- 6.Gyles CL. Can. J. Microbiol. 1992;38:734–746. doi: 10.1139/m92-120. [DOI] [PubMed] [Google Scholar]
- 7.Fukuta S, Magnani JL, Twiddy EM, Holmes RK, Ginsburg V. Infect. Immun. 1988;56:1748–1753. doi: 10.1128/iai.56.7.1748-1753.1988. [DOI] [PMC free article] [PubMed] [Google Scholar]
- 8.Gill DM. J. Supramol. Struct. 1979;10:151–163. doi: 10.1002/jss.400100205. [DOI] [PubMed] [Google Scholar]
- 9.Cassel D, Selinger Z. Proc. Natl. Acad. Sci. U. S. A. 1977;74:3307–3311. doi: 10.1073/pnas.74.8.3307. [DOI] [PMC free article] [PubMed] [Google Scholar]
- 10.Rodighiero C, Aman AT, Kenny MJ, Moss J, Lencer WI, Hirst TR. J. Biol. Chem. 1999;274:3962–3969. doi: 10.1074/jbc.274.7.3962. [DOI] [PubMed] [Google Scholar]
- 11.Verlinde CL, Merritt EA, Van den Akker F, Kim H, Feil I, Delboni LF, Mande SC, Sarfaty S, Petra PH, Hol WG. Protein Sci. 1994;3:1670–1686. doi: 10.1002/pro.5560031006. [DOI] [PMC free article] [PubMed] [Google Scholar]
- 12.Hirst TR, Holmgren J. Proc. Natl. Acad. Sci. U. S. A. 1987;84:7418–7422. doi: 10.1073/pnas.84.21.7418. [DOI] [PMC free article] [PubMed] [Google Scholar]
- 13.Connell TD, Metzger DJ, Wang M, Jobling MG, Holmes RK. Infect. Immun. 1995;63:4091–4098. doi: 10.1128/iai.63.10.4091-4098.1995. [DOI] [PMC free article] [PubMed] [Google Scholar]
- 14.Hirst TR, Randall LL, Hardy SJ. J. Bacteriol. 1984;157:637–642. doi: 10.1128/jb.157.2.637-642.1984. [DOI] [PMC free article] [PubMed] [Google Scholar]
- 15.Francetic O, Pugsley AP. J. Bacteriol. 1996;178:3544–3549. doi: 10.1128/jb.178.12.3544-3549.1996. [DOI] [PMC free article] [PubMed] [Google Scholar]
- 16.Hirst TR, Sanchez J, Kaper JB, Hardy SJ, Holmgren J. Proc. Natl. Acad. Sci. U. S. A. 1984;81:7752–7756. doi: 10.1073/pnas.81.24.7752. [DOI] [PMC free article] [PubMed] [Google Scholar]
- 17.Hirst TR, Holmgren J. J. Bacteriol. 1987;169:1037–1045. doi: 10.1128/jb.169.3.1037-1045.1987. [DOI] [PMC free article] [PubMed] [Google Scholar]
- 18.Pearson GD, Mekalanos JJ. Proc. Natl. Acad. Sci. U. S. A. 1982;79:2976–2980. doi: 10.1073/pnas.79.9.2976. [DOI] [PMC free article] [PubMed] [Google Scholar]
- 19.Sandkvist M, Michel LO, Hough LP, Morales VM, Bagdasarian M, Koomey M, DiRita VJ, Bagdasarian M. J. Bacteriol. 1997;179:6994–7003. doi: 10.1128/jb.179.22.6994-7003.1997. [DOI] [PMC free article] [PubMed] [Google Scholar]
- 20.Gankema H, Wensink J, Guinee PA, Jansen WH, Witholt B. Infect. Immun. 1980;29:704–713. doi: 10.1128/iai.29.2.704-713.1980. [DOI] [PMC free article] [PubMed] [Google Scholar]
- 21.Wai SN, Takade A, Amako K. Microbiol. Immunol. 1995;39:451–456. doi: 10.1111/j.1348-0421.1995.tb02228.x. [DOI] [PubMed] [Google Scholar]
- 22.Pettit RK, Judd RC. Mol. Microbiol. 1992;6:729–734. doi: 10.1111/j.1365-2958.1992.tb01522.x. [DOI] [PubMed] [Google Scholar]
- 23.Shoberg RJ, Thomas DD. Infect. Immun. 1993;61:3892–3900. doi: 10.1128/iai.61.9.3892-3900.1993. [DOI] [PMC free article] [PubMed] [Google Scholar]
- 24.Kolling GL, Matthews KR. Appl. Environ. Microbiol. 1999;65:1843–1848. doi: 10.1128/aem.65.5.1843-1848.1999. [DOI] [PMC free article] [PubMed] [Google Scholar]
- 25.Kadurugamuwa JL, Beveridge TJ. J. Bacteriol. 1995;177:3998–4008. doi: 10.1128/jb.177.14.3998-4008.1995. [DOI] [PMC free article] [PubMed] [Google Scholar]
- 26.Hoekstra D, van der Laan JW, de Leij L, Witholt B. Biochim Biophys Acta. 1976;455:889–899. doi: 10.1016/0005-2736(76)90058-4. [DOI] [PubMed] [Google Scholar]
- 27.Grenier D, Mayrand D. Infect. Immun. 1987;55:111–117. doi: 10.1128/iai.55.1.111-117.1987. [DOI] [PMC free article] [PubMed] [Google Scholar]
- 28.Dorward DW, Garon CF, Judd RC. J. Bacteriol. 1989;171:2499–2505. doi: 10.1128/jb.171.5.2499-2505.1989. [DOI] [PMC free article] [PubMed] [Google Scholar]
- 29.Kadurugamuwa JL, Beveridge TJ. J. Bacteriol. 1996;178:2767–2774. doi: 10.1128/jb.178.10.2767-2774.1996. [DOI] [PMC free article] [PubMed] [Google Scholar]
- 30.Kadurugamuwa JL, Beveridge TJ. J. Antimicrob. Chemother. 1997;40:615–621. doi: 10.1093/jac/40.5.615. [DOI] [PubMed] [Google Scholar]
- 31.Kadurugamuwa JL, Beveridge TJ. Antimicrob. Agents Chemother. 1998;42:1476–1483. doi: 10.1128/aac.42.6.1476. [DOI] [PMC free article] [PubMed] [Google Scholar]
- 32.Li Z, Clarke AJ, Beveridge TJ. J. Bacteriol. 1998;180:5478–5483. doi: 10.1128/jb.180.20.5478-5483.1998. [DOI] [PMC free article] [PubMed] [Google Scholar]
- 33.Dorward DW, Garon CF. J. Bacteriol. 1989;171:4196–4201. doi: 10.1128/jb.171.8.4196-4201.1989. [DOI] [PMC free article] [PubMed] [Google Scholar]
- 34.Saunders NB, Shoemaker DR, Brandt BL, Moran EE, Larsen T, Zollinger WD. Infect. Immun. 1999;67:113–119. doi: 10.1128/iai.67.1.113-119.1999. [DOI] [PMC free article] [PubMed] [Google Scholar]
- 35.Evans DJEJ, Tjoa W. Infect. Immun. 1977;18:330–337. doi: 10.1128/iai.18.2.330-337.1977. [DOI] [PMC free article] [PubMed] [Google Scholar]
- 36.Guy-Caffey JK, Rapoza MP, Jolley KA, Webster RE. J. Bacteriol. 1992;174:2460–2465. doi: 10.1128/jb.174.8.2460-2465.1992. [DOI] [PMC free article] [PubMed] [Google Scholar]
- 37.Jobling MG, Palmer LM, Erbe JL, Holmes RK. Plasmid. 1997;38:158–173. doi: 10.1006/plas.1997.1309. [DOI] [PubMed] [Google Scholar]
- 38.Laemmli UK. Nature. 1970;227:680–685. doi: 10.1038/227680a0. [DOI] [PubMed] [Google Scholar]
- 39.Sambrook J, Fritsch EF, Maniatis T. Molecular Cloning: A Laboratory Manual. 2 Ed. Cold Spring Harbor, NY: Cold Spring Harbor Laboratory; 1989. [Google Scholar]
- 40.Blakesley RW, Boezi JA. Anal. Biochem. 1977;82:580–582. doi: 10.1016/0003-2697(77)90197-x. [DOI] [PubMed] [Google Scholar]
- 41.Blum H, Beier H, Gross H. Electrophoresis. 1987;8:93–99. [Google Scholar]
- 42.Odegaard TJ, Kaltashov IA, Cotter RJ, Steeghs L, van der Ley P, Khan S, Maskell DJ, Raetz CR. J. Biol. Chem. 1997;272:19688–19696. doi: 10.1074/jbc.272.32.19688. [DOI] [PubMed] [Google Scholar]
- 43.Osborn MJ, Gander JE, Parisi E. J. Biol. Chem. 1972;247:3973–3986. [PubMed] [Google Scholar]
- 44.Phillips AT. In: Methods for General and Molecular Bacteriology. Gerhardt P, editor. Washington, DC: American Society for Microbiology; 1994. p. 574. [Google Scholar]
- 45.Svennerholm A, Holmgren J. Curr. Microbiol. 1978;1:19–23. [Google Scholar]
- 46.Ma D, Cook DN, Alberti M, Pon NG, Nikaido H, Hearst JE. J. Bacteriol. 1993;175:6299–6313. doi: 10.1128/jb.175.19.6299-6313.1993. [DOI] [PMC free article] [PubMed] [Google Scholar]
- 47.Kadurugamuwa JL, Lam JS, Beveridge TJ. Antimicrob. Agents Chemother. 1993;37:715–721. doi: 10.1128/aac.37.4.715. [DOI] [PMC free article] [PubMed] [Google Scholar]
- 48.Miller VL, Bliska JB, Falkow S. J. Bacteriol. 1990;172:1062–1069. doi: 10.1128/jb.172.2.1062-1069.1990. [DOI] [PMC free article] [PubMed] [Google Scholar]
- 49.Stoorvogel J, van Bussel MJ, van de Klundert JA. J. Bacteriol. 1991;173:161–167. doi: 10.1128/jb.173.1.161-167.1991. [DOI] [PMC free article] [PubMed] [Google Scholar]
- 50.Stoorvogel J, van Bussel MJ, Tommassen J, van de Klundert JA. J. Bacteriol. 1991;173:156–160. doi: 10.1128/jb.173.1.156-160.1991. [DOI] [PMC free article] [PubMed] [Google Scholar]
- 51.Baldermann C, Lupas A, Lubieniecki J, Engelhardt H. J. Bacteriol. 1998;180:3741–3749. doi: 10.1128/jb.180.15.3741-3749.1998. [DOI] [PMC free article] [PubMed] [Google Scholar]
- 52.Sengupta TK, Nandy RK, Mukhopadhyay S, Hall RH, Sathyamoorthy V, Ghose AC. FEMS Microbiol. Lett. 1998;160:183–189. doi: 10.1111/j.1574-6968.1998.tb12909.x. [DOI] [PubMed] [Google Scholar]
- 53.van Beilen JB, Eggink G, Enequist H, Bos R, Witholt B. Mol. Microbiol. 1992;6:3121–3136. doi: 10.1111/j.1365-2958.1992.tb01769.x. [DOI] [PubMed] [Google Scholar]
- 54.Clements JD, Finkelstein RA. Infect. Immun. 1979;24:760–769. doi: 10.1128/iai.24.3.760-769.1979. [DOI] [PMC free article] [PubMed] [Google Scholar]
- 55.Beveridge TJ. J. Bacteriol. 1999;181:4725–4733. doi: 10.1128/jb.181.16.4725-4733.1999. [DOI] [PMC free article] [PubMed] [Google Scholar]
- 56.Hofstra H, Witholt B. J. Biol. Chem. 1984;259:15182–15187. [PubMed] [Google Scholar]


