

Abstract
Background
The classic cardiovascular complication of chronic obstructive pulmonary disease (COPD) is cor pulmonale, or enlargement of the right ventricle (RV). Most studies of cor pulmonale were conducted decades ago.
Objective
We aimed to examine RV changes in contemporary COPD and emphysema using cardiac magnetic resonance imaging (MRI).
Methods
We performed a case-control study nested predominantly in two general population studies of 310 participants with COPD and controls ages 50–79 years with ≥ 10 pack-years of smoking and who were free of clinical cardiovascular disease. RV volumes and mass were assessed using MRI. COPD and COPD severity were defined by standard spirometric criteria. Percent emphysema was defined as percent of lung regions <-950 Hounsfield units on full-lung computed tomography; emphysema subtypes were scored by radiologists. Results were adjusted for age, race/ethnicity, sex, height, weight, smoking status, pack-years, systemic hypertension and sleep apnea.
Results
RV end-diastolic volume was reduced in COPD compared to controls (-7.8 mL, 95% CI: -15.0, -0.5 mL; p=0.04). Increasing severity of COPD was associated with smaller RV end-diastolic volume (p=0.004) and lower RV stroke volume (p<0.001). RV mass and ejection fraction were similar between the groups. Greater percent emphysema was also associated with smaller RV end-diastolic volume (p=0.005) and stroke volume (p<0.001), as was the presence of centrilobular and paraseptal emphysema.
Conclusions
RV volumes are lower without significant alterations in RV mass and ejection fraction in contemporary COPD (“cor pulmonale parvus”) and this reduction is related to greater percent emphysema on computed tomography.
Keywords: right ventricle, chronic obstructive pulmonary disease, pulmonary heart disease, pulmonary hypertension, heart failure
Introduction
Chronic obstructive pulmonary disease (COPD) is the third leading cause of death in the United States (1). COPD is defined by accelerated, age-related loss in lung function resulting in incompletely reversible airway obstruction (2). Pulmonary emphysema overlaps partially with COPD and is defined as airspace enlargement distal to the terminal bronchioles with destruction of their walls. Hypoxic pulmonary vasoconstriction, hypercapnea, acidosis, and pulmonary vascular remodeling in COPD can all contribute to increased pulmonary vascular resistance and greater right ventricular (RV) afterload, resulting in cor pulmonale, or RV hypertrophy and dilation (3).
Cor pulmonale was once considered common in COPD (4). Prior studies have suggested that resting pulmonary hypertension is frequent in COPD and that exertional pulmonary hypertension may occur in up to 58% of COPD patients without resting pulmonary hypertension (5), both of which contribute to increases in RV mass and volume. However, the contemporary literature on cor pulmonale in COPD is limited by small sample sizes of highly selected patients, perhaps due to the difficulties in assessing the RV using transthoracic echocardiography in COPD and performing cardiac catheterization in large cohorts. Some of these small studies demonstrate increased RV mass and RV dysfunction in COPD (6), whereas others show reduced RV size and intrathoracic blood volumes (7-13). Hence, changes in RV structure and function in contemporary COPD are poorly defined.
We therefore assessed RV morphology in COPD and emphysema in a multicenter study of COPD cases and controls drawn predominantly from the general population using cardiac magnetic resonance imaging (MRI), the standard of reference for noninvasively assessing the RV. Given our prior findings showing a small RV in patients with emphysema and historical autopsy studies (14-16), we hypothesized that COPD and greater percentage of emphysema-like lung on computed tomography (CT) would be associated with smaller RV volumes.
Methods
Study Sample
The Multi-Ethnic Study of Atherosclerosis (MESA) COPD Study enrolled participants with COPD and normal controls in 2009-11 predominantly from a prospective population-based cohort study (MESA) (17) and a lung cancer screening and emphysema progression study (EMCAP) (18). Participants were age 50-79 years old with ≥ 10 pack-years of smoking and did not have a clinical diagnosis of coronary heart disease, heart failure, cerebrovascular disease, asthma prior to age 45 years, other lung disease or cancer, prior lung resection, stage IIIb-V kidney disease, allergy to gadolinium, claustrophobia, metal in the body, pregnancy or weight > 300 lbs. Recent COPD exacerbation was a temporary exclusion criterion. We selected all eligible participants at four sites in the MESA Lung Study (19) and oversampled participants with COPD or emphysema from the remainder of MESA and from the lung cancer screening study, in addition to a small number from neither study.
Protocols were approved by the institutional review boards of the participating institutions and the National Heart, Lung, and Blood institute. Written informed consent was obtained from all participants.
Pulmonary Function Testing
Spirometry was conducted in accordance with American Thoracic Society/European Respiratory Society guidelines (20) before and after inhalation of albuterol. COPD was defined as a post-bronchodilator ratio of the forced expiratory volume in one second (FEV1) to the forced vital capacity (FVC) < 0.70 (2). COPD severity was classified as: mild, FEV1 ≥ 80% predicted; moderate, 50-79% predicted; and severe, FEV1 < 50% predicted (21).
Emphysema
All participants underwent full-lung CTs on 64-slice helical scanners following the MESA-Lung/SPIROMICS full-inspiration protocol (22). Percent emphysema was defined using Apollo software (Vida Diagnostics, Coralville, IA) as the percentage of total voxels within the lung field that fell below -950 Hounsfield units (23). In addition, the presence or absence of any emphysema and predominant emphysema subtype was assessed visually on all CT scans by an experienced thoracic radiologist (24) blinded to other clinical information.
Magnetic Resonance Imaging
The cardiac MRI protocol was that of the fifth examination of MESA modified to include assessment of the pulmonary vasculature (25), and the protocol and methods for interpretation have been previously reported (26, 27). RV image analysis was performed by two independent analysts who were unaware of other clinical information using QMASS software (v4.2, Medis, the Netherlands). RV end-diastolic volume and RV end-systolic volume were calculated using Simpson's rule by summation of areas on each slice multiplied by the sum of slice thickness and image gap. RV mass was determined at end-diastole as the difference between end-diastolic epicardial and endocardial volumes multiplied by the specific gravity of the heart (1.05 g/cm3). RV stroke volume was calculated by subtracting RV end-systolic volume from RV end-diastolic volume; RV ejection fraction was calculated by dividing RV stroke volume by RV end-diastolic volume. Trabeculations were excluded from RV mass and included in RV volumes, as has been done in previous large-scale studies using MRI to assess the RV and LV.(27) The RV outflow track was included in the RV volumes, and the septum was considered part of the LV for this study (Supplemental Figure 1). Our method of interpretation has been shown to have high intra-reader and inter-reader reproducibility (28).
Pulmonary perfusion was assessed in a subset of participants (n = 141) using dynamic first-pass contrast-enhanced MRI of the thorax. Pulmonary microvascular perfusion was assessed on a coronal slice at the level of the trachea in the peripheral 2 cm of the lung, as previously described (29, 30).
See Supplemental Material for details of other pulmonary function measures, the CT and MRI protocols, and microvascular perfusion measures.
Covariates
Age, sex, race/ethnicity, educational attainment, smoking status, pack-years and medical history were self-reported. Medication use was assessed by medication inventory (31). Height, weight and blood pressure were measured following standardized MESA protocols (25). Participants with a blood cotinine level greater than 25 ng/mL, a urine level greater than 500 ng/mL or a self- report of current smoking were classified as current smokers. Oxygen saturation was measured with a pulse oximeter off oxygen, if used.
Statistical Analysis
Data were summarized as mean ± standard deviation (SD) or median (interquartile range [IQR]), as appropriate. Linear regression models included categories of COPD status and severity as independent variables and continuous RV parameters as dependent variables. A test of trend across categories of COPD severity was performed; if positive, Holm's step-down procedure was performed.
Linear regression models were also constructed for continuous independent variables, weighted according to cohort specific probabilities of selection and enrollment into the MESA-COPD study to account for sampling (32). Robust standard errors were used. Results are shown by quintiles of percent emphysema for descriptive purposes; statistical tests were based upon the continuous variable in the regression model. The nonlinearity of these associations was tested in generalized additive models with the same weighting and robust standard errors.
The minimally adjusted models included age, sex, height, weight, race/ethnicity and the cohort from which the participant was recruited. The fully adjusted models also included smoking status, pack-years, hypertension, and sleep apnea (and milliamperes for percent emphysema). The full models were adjusted for the respective LV parameters to better understand if the associations were RV-specific. There were no missing covariate data except for 10 (3%) participants who did not know if they carried a diagnosis of sleep apnea; they were assumed not to have sleep apnea.
P-values were two-tailed with statistical significance defined as p < 0.05. Analyses were performed in SAS 9.2 (Cary, NC) and R version 2.14.1 (Vienna, Austria).
Result
The study enrollment and reasons for exclusion are shown in Supplemental Figure 2. Forty seven percent of the 310 participants had COPD, 60 with mild, 67 with moderate and 20 with severe disease. The mean age of the participants was 67.9 ± 7.0 years, 39.7% were women, and 27.7% currently smoked cigarettes. The race/ethnic distribution was 53.2% non-Hispanic white, 26.1% African-American, 14.2% Hispanic, and 6.5% Chinese-American.
Patients with COPD were more likely to be male and white and were somewhat more likely to be current smokers with more pack-years (Table 1). Those with COPD had characteristic spirometric, volumetric, and diffusing capacity for carbon monoxide patterns compared to smoking controls and had more emphysema. Only seven of the 147 patients (4.7%) with COPD used long-term supplemental oxygen (all who had severe/very severe COPD).
Table 1. Clinical characteristics of participants stratified by COPD severity.
| Controls (n=163) | COPD | |||
|---|---|---|---|---|
|
| ||||
| Mild (n=60) | Moderate (n=67) | Severe/Very Severe (n=20) | ||
| Age, mean±SD, years | 67.57±6.75 | 69.35±9.64 | 67.40±7.78 | 67.85±6.83 |
| Sex, male, No. (%) | 90 (55.21) | 43 (71.67) | 40 (59.70) | 14 (70.00) |
| Race/ethnicity | ||||
| White, No. (%) | 71 (43.56) | 40 (66.67) | 39 (58.21) | 15 (75.00) |
| African American, No. (%) | 40 (24.54) | 15 (25.00) | 21 (31.34) | 5 (25.00) |
| Chinese, No. (%) | 15 (9.20) | 3 (5.00) | 2 (2.99) | 0 (0.0) |
| Hispanic, No. (%) | 37 (22.70) | 2 (3.33) | 5 (7.46) | 0 (0.0) |
| Educational attainment | ||||
| High school degree or less, No. (%) | 45 (27.61) | 12 (20.00) | 15 (22.39) | 4 (20.00) |
| Some college or vocational school, No. (%) | 54 (33.13) | 14 (23.33) | 16 (23.88) | 7 (35.00) |
| College degree or above, No. (%) | 65 (39.26) | 34 (56.67) | 36 (53.73) | 9 (45.00) |
| Height, mean±SD, cm | 167.06±9.48 | 171.91±7.97 | 170.03±9.64 | 170.12±10.40 |
| Weight, mean±SD, kg | 80.16 | 79.04±15.39 | 78.63±18.09 | 80.74±22.92 |
| Body mass index, mean±SD, kg/m2 | 28.62 | 26.61±3.97 | 26.99±4.86 | 27.55±6.03 |
| Cigarette smoking status | ||||
| Former, No. (%) | 126 (77.30) | 45 (75.00) | 39 (58.21) | 14 (70.00) |
| Current, No. (%) | 37 (22.70) | 15 (25.00) | 28 (41.79) | 6 (30.00) |
| Pack-years of smoking, median (IQR) | 27.3 (17.7, 42.0) | 33.4 (24.5, 61.5) | 39.0 (25.0, 51.3) | 44.0 (22.0, 62.3) |
| Systolic blood pressure, mean±SD, mmHg | 120.24±19.01 | 120.47±15.92 | 123.87±15.94 | 126.70±12.90 |
| Diastolic blood pressure, mean±SD, mmHg | 68.82±9.49 | 70.58±9.02 | 71.96±9.05 | 75.68±9.27 |
| Hypertension, No. (%) | 70 (42.94) | 25 (41.67) | 33 (49.25) | 8 (40.00) |
| Fasting plasma glucose, median (IQR),mg/dL | 96.0 (91.0, 105.0) | 95.5 (87.0, 107.0) | 100.0 (95.0, 108.0) | 94.0 (84.0, 111.5) |
| Diabetes mellitus, No. (%) | 25 (15.34) | 5 (8.33) | 9 (13.43) | 6 (30.00) |
| Sleep apnea, self-reported, No (%) | 12 (7.36) | 4 (6.67) | 7 (10.45) | 4 (20.00) |
| Medication use | ||||
| Inhaled or systemic corticosteroids, No (%) | 2 (1.23) | 4 (6.67) | 8 (11.94) | 15 (75.00) |
| β agonists, No (%) | 2 (1.23) | 5 (8.33) | 13 (19.40) | 16 (80.00) |
| Anticholinergics, No (%) | 1 (0.61) | 4 (6.67) | 8 (11.94) | 16 (80.00) |
| Long-term oxygen therapy, No (%) | 1 (0.61) | 0 (0.0) | 0 (0.0) | 7 (35.00) |
| Study | ||||
| MESA, No (%) | 121 (74.23) | 29 (48.33) | 30 (44.78) | 4 (20.00) |
| EMCAP, No (%) | 41 (25.15) | 23 (38.33) | 22 (32.84) | 4 (20.00) |
| Community, No (%) | 1 (0.61) | 8 (13.33) | 15 (22.39) | 12 (60.00) |
| FEV1 percent of predicted, mean±SD | 101.18±15.54 | 91.77±9.37 | 69.49±8.18 | 39.75±6.68 |
| FVC percent of predicted, mean±SD | 98.17±15.12 | 106.86±12.27 | 91.08±12.40 | 76.56±15.37 |
| FEV1/FVC ratio, mean±SD, % | 0.78±0.05 | 0.64±0.05 | 0.58±0.09 | 0.39±0.08 |
| Percent emphysema-950, median (IQR) | 1.17 (0.55, 2.27) | 3.36 (1.81, 7.91) | 3.25 (1.13, 7.89) | 19.92 (7.15, 25.90) |
| Oxygen saturation, mean±SD, % | 99.75±48.15 | 96.00±4.58 | 96.20±3.84 | 95.69±1.93 |
| DLco % predicted, mean±SD, %* | 68.08±10.50 | 63.95±11.87 | 55.12±14.22 | 38.22±13.01 |
| DLco/VA % predicted, mean±SD, %* | 79.36±12.95 | 69.82±14.87 | 69.40±19.35 | 57.34±20.08 |
| Residual volume, % predicted, mean±SD* | 86.02±26.28 | 94.37±18.01 | 110.94±29.86 | 149.62±29.93 |
| TLC % predicted, mean±SD, %* | 98.56±13.38 | 107.45±10.92 | 100.58±14.11 | 104.83±17.27.67 |
| Residual volume/TLC, mean±SD, %* | 0.31±0.07 | 0.31±0.05 | 0.39±0.08 | 0.50±0.08 |
Abbreviations: SD = Standard Deviation; IQR = Interquartile Range; FEV1 = Forced Expiratory Volume in One Second; FVC = Forced Vital Capacity; DLco = Diffusing Capacity of the Lung for Carbon Monoxide; VA = Alveolar Volume;; TLC = Total Lung Capacity
Assessed for 119 participants at one site.
COPD and the Right Ventricle
RV end-diastolic volume was lower in patients with COPD compared to controls (p=0.02) in minimally adjusted models that accounted for differences in age, sex, race/ethnicity, height, weight and cohort. Results were similar in fully adjusted models (-7.8 ml, 95% CI: -15.0, -0.5 mL; p=0.04).
Increasing severity of COPD was significantly and monotonically associated with smaller RV end-diastolic volume in minimally and fully adjusted models (Table 2). The decrement in RV end-diastolic volume was directly related to the FEV1/FVC ratio (Figure 1A) without evidence for non-linearity (e.g., a J-shape) (p for nonlinearity=0.65). The association of COPD severity with smaller RV end-diastolic volume persisted after additional adjustment for LV end-diastolic volume (Supplemental Table 1, p=0.02).
Table 2. Predicted mean values of right ventricular parameters by COPD severity.
| Controls (n=163) | Mild (n=60) | Moderate (n=67) | Severe (n=20) | P-Trend | |
|---|---|---|---|---|---|
| RV End Diastolic Volume, mL | |||||
| Unadjusted mean | 130.75 | 136.08 | 123.94 | 118.93 | |
| Minimally adjusted† | 130.70 | 129.12 | 118.40* | 106.86* | 0.003 |
| Fully adjusted‡ | 130.67 | 129.70 | 118.94* | 107.58* | 0.004 |
| RV End Systolic Volume, mL | |||||
| Unadjusted mean | 53.64 | 57.01 | 52.20 | 55.86 | |
| Minimally adjusted | 53.61 | 51.69 | 46.98 | 44.24 | 0.01 |
| Fully adjusted | 53.60 | 52.06 | 47.35 | 44.79 | 0.06 |
| RV Stroke Volume, mL | |||||
| Unadjusted mean | 77.11 | 79.08 | 71.73 | 63.06 | |
| Minimally adjusted | 77.09 | 77.43 | 71.42* | 62.62* | <0.001 |
| Fully adjusted | 77.08 | 77.64 | 71.60* | 62.80* | <0.001 |
| RV End Diastolic Mass, g | |||||
| Unadjusted mean | 23.01 | 22.20 | 20.69 | 21.71 | |
| Minimally adjusted | 23.04 | 22.74 | 21.66 | 23.61 | 0.68 |
| Fully adjusted | 23.02 | 22.90 | 21.54 | 23.47 | 0.55 |
| RV End Diastolic Mass/RV End Diastolic Volume Ratio, g/mL | |||||
| Unadjusted mean | 0.18 | 0.17 | 0.17 | 0.22 | |
| Minimally adjusted | 0.18 | 0.18 | 0.19 | 0.26* | 0.03 |
| Fully adjusted | 0.15 | 0.16 | 0.16 | 0.23* | 0.04 |
| RV Ejection Fraction, % | |||||
| Unadjusted mean | 59.84 | 58.97 | 59.01 | 55.26 | |
| Minimally adjusted | 59.84 | 61.09 | 61.53 | 61.02 | 0.98 |
| Fully adjusted | 59.85 | 60.93 | 61.38 | 60.77 | 0.95 |
P-value < 0.05 vs. controls.
“Minimally adjusted” adjusted for age, sex, race/ethnicity, height, weight and cohort.
“Fully adjusted” adjusted for variables in minimally adjusted model in addition to smoking status, pack-years, hypertension and sleep apnea.
Figure 1. Multivariate Relationships between the Ratio of the Forced Expiratory Volume in One Second to Forced Vital Capacity and Right Ventricular End-Diastolic Volume and Mass.
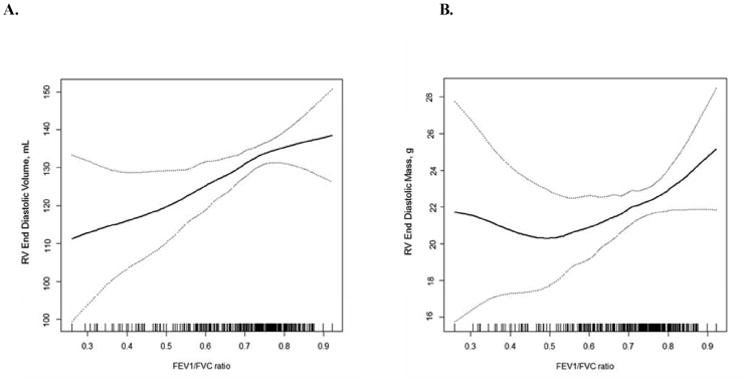
Smoothed regression plot of the relationship (solid line) of the ratio of the forced expiratory volume in one second to forced vital capacity with right ventricular end-diastolic volume (Panel A) and mass (Panel B) and 95% confidence intervals (dashed lines). The plots were obtained from regression models adjusted for age, sex, race/ethnicity, cohort, height, weight, smoking status, pack-years, hypertension, and sleep apnea. The hash marks denote data points.
A similar association was present for RV end-systolic volume, although its significance was marginal in the fully adjusted model (Table 2, Supplemental Table 1). RV stroke volume was significantly reduced with increasing severity of COPD.
RV mass was similar between patients with COPD and controls in minimally and fully adjusted models (-0.7 g, 95% CI: -2.7, 1.3; p=0.51) and across categories of COPD severity (Table 2, Supplemental Table 1). There was no evidence for nonlinearity in the association of the FEV1/FVC ratio and RV mass (Figure 1B; p for nonlinearity=0.13). The ratio of RV mass to end-diastolic volume was slightly but significantly increased in severe COPD, due to reduced volume, however the RV ejection fraction was not associated with the presence or severity of COPD (Table 2).
The association of RV end-diastolic volume with COPD was largely unchanged with further adjustment for long-term oxygen use, restriction to participants sampled from MESA and EMCAP or without systemic hypertension, diabetes or sleep apnea, and stratification by sex (Supplemental Figure 3). There were no differences in former smokers compared to current smokers (p for interaction = 0.48), but there may have been a more pronounced decrement in African-American participants compared to other race/ethnic groups (p for interaction = 0.09).
Pulmonary Emphysema and the Right Ventricle
RV end-diastolic volume was monotonically lower across increasing categories of percent emphysema on CT scan. This association was significant in minimally and fully adjusted models (Table 3, Supplemental Table 2) and was linear (Figure 2A). Increasing percent emphysema was also associated with a significantly smaller RV stroke volume. Percent emphysema was not associated with RV mass (Figure 2B), RV mass-to-end-diastolic volume ratio, or RV ejection fraction (Table 3, Supplemental Table 2).
Table 3. Predicted mean values for and differences in right ventricular parameters by percent emphysema on computed tomography.
| n=306 | Percent Emphysema | Difference per log increase in percent emphysema [95% CI] | P-value | |||||
|---|---|---|---|---|---|---|---|---|
|
| ||||||||
| quintile 1 (n=62) | quintile 2 (n=60) | quintile 3 (n=62) | quintile 4 (n=60) | quintile 5 (n=62) | ||||
| RV End Diastolic Volume, mL | ||||||||
| Unadjusted mean | 128.03 | 134.34 | 133.42 | 131.54 | 121.89 | |||
| Minimally adjusted† | 134.95 | 130.63 | 127.85 | 124.89 | 120.41 | -4.05 (-6.90, -1.21) | 0.005 | |
| Fully adjusted‡ | 135.22 | 130.90 | 128.11 | 125.15 | 120.66 | -4.03 (-6.86, -1.21) | 0.005 | |
| RV End Systolic Volume, mL | ||||||||
| Unadjusted mean | 53.59 | 55.99 | 54.15 | 55.33 | 52.81 | |||
| Minimally adjusted | 54.61 | 53.43 | 52.67 | 51.86 | 50.64 | -1.10 (-3.05, 0.81) | 0.26 | |
| Fully adjusted | 54.76 | 53.64 | 52.92 | 52.15 | 50.99 | -1.03 (-2.91, 0.85) | 0.28 | |
| RV Stroke Volume, mL | ||||||||
| Unadjusted mean | 74.44 | 78.34 | 79.27 | 76.21 | 69.08 | |||
| Minimally adjusted | 80.36 | 77.22 | 75.19 | 73.04 | 69.78 | -2.95 (-4.54, -1.35) | <0.001 | |
| Fully adjusted | 80.45 | 77.25 | 75.19 | 72.99 | 69.67 | -3.01 (-4.63, -1.38) | <0.001 | |
| RV End Diastolic Mass, g | ||||||||
| Unadjusted mean | 21.38 | 22.28 | 22.74 | 22.15 | 22.78 | |||
| Minimally adjusted | 23.93 | 23.14 | 22.64 | 22.10 | 21.29 | -0.73 (-1.49, 0.02) | 0.06 | |
| Fully adjusted | 23.84 | 23.14 | 22.69 | 22.22 | 21.49 | -0.65 (-1.41, 0.12) | 0.10 | |
| RV End Diastolic Mass/RV End Diastolic Volume Ratio, g/mL | ||||||||
| Unadjusted mean | 0.17 | 0.17 | 0.17 | 0.17 | 0.21 | |||
| Minimally adjusted | 0.18 | 0.18 | 0.18 | 0.18 | 0.19 | 0.00 (-0.01, 0.01) | 0.57 | |
| Fully adjusted | 0.18 | 0.18 | 0.19 | 0.19 | 0.19 | 0.00 (-0.01, 0.01) | 0.47 | |
| RV Ejection Fraction, % | ||||||||
| Unadjusted mean | 59.43 | 59.31 | 59.80 | 58.43 | 58.30 | |||
| Minimally adjusted | 60.52 | 60.00 | 59.67 | 59.32 | 58.78 | -0.49 (-1.28, 0.31) | 0.23 | |
| Fully adjusted | 60.51 | 59.93 | 59.55 | 59.16 | 58.55 | -0.55 (-1.34, 0.24) | 0.17 | |
“Minimally adjusted” adjusted for age, sex, race/ethnicity, height, weight and cohort.
“Fully adjusted” adjusted for variables in minimally adjusted model in addition to smoking status, pack-years, hypertension, sleep apnea and high mAs.
Figure 2. Multivariate Relationships between Percent Emphysema and Right Ventricular End-Diastolic Volume and Mass.
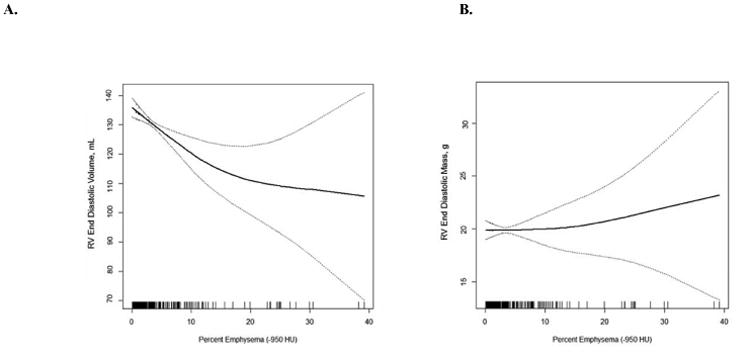
Smoothed regression plot of the relationship (solid line) of percent emphysema with right ventricular end-diastolic volume (Panel A) and mass (Panel B) and 95% confidence intervals (dashed lines). The plots were obtained from regression models adjusted for age, sex, race/ethnicity, cohort, height, weight, smoking status, pack-years, hypertension, sleep apnea and mAs. The hash marks denote data points.
The presence of emphysema assessed by radiologist interpretation was also associated with lower RV end-diastolic volume and RV stroke volume (p=0.003 and 0.004, respectively) in fully adjusted models. Whereas centrilobular emphysema and paraseptal emphysema were significantly related to lower RV end-diastolic volume (P<0.001 and P= 0.003, respectively), there was no evidence for such a relationship for panlobular emphysema (P=0.39) (Supplemental Table 3).
The findings for percent emphysema and RV end-diastolic volume were not sensitive to additional adjustment or subset analyses (Supplemental Figure 4). There was no interaction between percent emphysema and smoking status or race in terms of the relationship with RV end-diastolic volume (p for interaction=0.78 and 0.18, respectively).
Other Measures
Among participants with gadolinium-enhanced MRI (n = 141) (Supplemental Table 4), smaller RV end-diastolic volumes were associated with reduced pulmonary microvascular blood flow and reduced pulmonary microvascular blood volume (Supplemental Table 5). Higher diffusing capacity for carbon monoxide was associated with larger RV end-diastolic volume, end-systolic volume, and stroke volume. There was no association between lung volumes and RV parameters (Supplemental Table 6). Subset analysis with only MESA and EMCAP participants showed similar results (Data not shown).
For all of the models, we performed routine checks for model fit to make sure the conclusions were not based on a few “influential” subjects. These procedures reassured that the models had adequate fit. Adjustment for arterial oxygen saturation by pulse oximetry did not change the results (Data not shown).
Discussion
Patients with COPD had, on average, smaller RV volumes compared to controls in this multicenter study that used MRI to assess RV structure and function. More severe COPD was associated with smaller RV volumes, but there was no consistent relationship of COPD severity with RV mass. Furthermore, the presence and severity of emphysema on CT scan was associated with smaller RV volumes and no change in RV mass.
The finding of reduced RV volumes contradicts the classical paradigm of cor pulmonale in COPD, that is, increased RV mass and volume in the setting of lung disease with or without RV dysfunction (3, 33). Our results for RV volumes are consistent with a recent small study that showed smaller RV volumes, but greater RV mass, in 25 patients with COPD and mild hypoxemia (12); other investigations in COPD (all with < 20 patients) have shown similar findings (9-11). These studies, however, included few, highly selected patients and did not adjust for potential confounders, issues which were addressed in this study.
A prior study in the parent MESA cohort showed that greater percent emphysema in the lower two-thirds of the lungs was associated with smaller RV volumes and mass specifically in smokers, with more complicated relationships after adjustment for the respective LV measures (16). Lower FEV1/FVC ratio was associated with smaller RV mass after adjustment for LV mass in that study. In the current study, increasing COPD severity was linked to increased RV mass/RV end-diastolic volume ratio, suggesting increased RV afterload. However, this association was attributable to smaller RV end-diastolic volume in more severe COPD patients (rather than increasing RV mass), which is difficult to attribute to increased RV wall stress.
Our findings may differ from the traditional manifestation of enlarged RV volumes and increased RV mass in COPD for several reasons. First, we sampled participants predominantly from the general population, resulting in a sample of COPD patients who may be less severe than those in prior studies but making the results more generalizable. However, the sample size of patients with severe COPD was similar to (or larger than) most prior studies. While there was a suggestion of a J-shaped relationship of RV mass with COPD severity, there was no such suggestion for RV end-diastolic volume or in relation to percent emphysema. Hence, the disease spectrum alone does not account for these differences.
Another explanation may be the predominant COPD subphenotypes studied. Burrows et al. found that COPD patients with emphysema on chest radiograph were less likely to demonstrate RV hypertrophy on electrocardiogram than other COPD patients, given the same pulmonary vascular resistance (14). Furthermore, early autopsy studies showed that patients dying with emphysema did not have evidence of RV hypertrophy, which was more common in COPD patients with airway inflammation and mucus gland hypertrophy suggestive of chronic bronchitis (15). More recently, increasing airway wall size was more strongly associated with increased pulmonary artery diameter in COPD than was percent emphysema (34). Other studies of the “comorbidome” of COPD have suggested that cardiac complications are linked to more prominent airways disease and less parenchymal destruction, supporting a stronger link between the “chronic bronchitis” subphenotype and traditional cardiac sequelae than the “emphysema” subphenotype (35, 36). We showed that increasing centrilobular and paraseptal emphysema were associated with smaller RV volumes, whereas panlobular emphysema was not. Therefore, rather than being inconsistent with the classic paradigm of cor pulmonale, our findings may reflect the current phenotype of COPD in the general population in the US and may not apply to selected patients with severe chronic bronchitis or marked gas trapping.
Consistent with this, Hilde et al. published a recent study of Norwegian COPD patients with residual volume ∼200% predicted of normal undergoing echocardiography and right heart catheterization (6). These patients demonstrated increased RV mass (without correction for body size) and more RV dysfunction compared to smoking controls. In contrast, patients in our study generally had normal residual volumes, which were not significantly associated with RV morphology. The different mix of subphenotypes of COPD may explain these population differences.
Third, treatments for COPD may secondarily affect afterload and preload and the RV sequelae. Long-acting bronchodilators reduce hyperinflation with gas trapping, and supplemental oxygen could impact on pulmonary vascular disease and RV morphology. We were not able to test these hypotheses; however the very small number of patients in our study receiving long-acting bronchodilators and oxygen (< 5%) and the persistence of the results despite adjustment for supplemental oxygen make use of these therapies unlikely to explain the results.
The mechanism of reduced RV filling in emphysematous COPD may relate to several factors. Watz et al. suggested that pulmonary hyperinflation reduces right atrial and RV filling in moderate-severe COPD (7), and lung volume reduction surgery for very severe COPD (which decreases hyperinflation)(37, 38) is associated with increased oxygen pulse (39, 40), RV end-diastolic volume, RV stroke volume, and reduced atrial pressure (41). However, measures of hyperinflation were not associated with RV volumes in the current study. Other mechanisms that reduce blood return to the thorax in severe COPD, affecting filling of both ventricles and the pulmonary vasculature, include a reduced gradient in pressure between the abdomen and chest and abnormal diaphragm orientation compressing the vena cava (42). Alternatively, intrinsic RV diastolic dysfunction, possibly related to increased inflammation or endothelial dysfunction, could decrease RV filling (43, 44). These novel mechanisms may suggest innovative approaches which target diastolic function (for example, soluble guanylate cyclase activators) to treat the cardiac component of exercise limitation in these patients.
There were some limitations to our study. Although we included a modest number of patients with severe COPD, the findings appeared to be similar to those with mild and moderate COPD. We excluded patients with clinically apparent heart failure, potentially leading to selection bias. However, the number of participants excluded for heart failure was very small, lessening the impact on the results. Assessment of RV morphology can be challenging due to the presence of the tricuspid valve, however prior studies using the same methodology in our Reading Center have shown outstanding intra-reader and inter-reader reliability for RV measurements. Measurement error (unless differential by COPD status) would bias to the null, so that our findings may underestimate the actual differences in RV morphology between COPD and controls. Percent emphysema measured quantitatively reflects pulmonary emphysema and other factors; however, radiologist-determined emphysema showed similar findings. We did not perform invasive hemodynamic measures, which would be difficult to justify in a large population-based sample, or transthoracic echocardiography, which is technically challenging in patients with COPD, which is our main population of study. Our perfusion measures may have certain technical limitations due to the determination of the arterial input function and the bolus dose. Although we adjusted for most potential confounders in multivariate analyses, residual confounding of multivariable analyses is possible.
Conclusions
In summary, more severe COPD and emphysema on CT were associated with lower RV volumes without changes in RV ejection fraction or RV mass. Smaller rather than larger RV size appears to be the more common RV phenotype in COPD in the US general population without overt cardiovascular disease, perhaps better termed cor pulmonale parvus. Future studies of treatment for COPD should consider the role of this novel cardiac comorbidity.
Supplementary Material
Perspectives.
Competency in Medical Knowledge
COPD is associated with smaller RV size rather than cor pulmonale, as traditionally thought.
Translational Outlook
The contribution of RV changes to the morbidity and mortality of COPD require further investigation. A better understanding of the mechanism of these associations could lead to novel therapies.
Acknowledgments
The authors thank the investigators, staff, and participants of the MESA COPD Study for their valuable contributions. A full list of participating MESA Investigators and institutions can be found at http://www.mesa-nhlbi.org. This manuscript has been reviewed by the MESA Investigators for scientific content and consistency of data interpretation with previous MESA publications and significant comments have been incorporated prior to submission for publication.
Funding: The MESA COPD Study is supported by the National Institutes of Health R01-HL093081, R01-HL077612 and R01-HL075476. MESA is supported by N01-HC95159-HC95169 and UL1-RR024156. Dr. Kawut is supported by K24-HL103844 and R01-HL086719.
Abbreviations
- COPD
chronic obstructive pulmonary disease
- CT
computed tomography
- FEV1
forced expiratory volume in one second
- FVC
forced vital capacity
- LV
left ventricle
- MESA
Multi-Ethnic Study of Atherosclerosis
- MRI
magnetic resonance imaging
- RV
right ventricle
Footnotes
Relationships with Industry: None
References
- 1.Hoyert DL, Xu J. Deaths: Preliminary data for 2011. Natl Vital Stat Rep. 2012;61:1–65. [PubMed] [Google Scholar]
- 2.Vestbo J, Hurd SS, Agusti AG, et al. Global strategy for the diagnosis, management, and prevention of chronic obstructive pulmonary disease: GOLD executive summary. Am J Respir Crit Care Med. 2013;187:347–365. doi: 10.1164/rccm.201204-0596PP. [DOI] [PubMed] [Google Scholar]
- 3.MacNee W. Pathophysiology of cor pulmonale in chronic obstructive pulmonary disease. Part one Am J Respir Crit Care Med. 1994;150:833–852. doi: 10.1164/ajrccm.150.3.8087359. [DOI] [PubMed] [Google Scholar]
- 4.Heath D, Brewer DB, Hicken P. Cor pulmonale in emphysema; mechanisms and pathology. Springfield, Ill.: C. C. Thomas; 1968. [Google Scholar]
- 5.Kessler R, Faller M, Weitzenblum E, et al. “Natural history” of pulmonary hypertension in a series of 131 patients with chronic obstructive lung disease. Am J Respir Crit Care Med. 2001;164:219–224. doi: 10.1164/ajrccm.164.2.2006129. [DOI] [PubMed] [Google Scholar]
- 6.Hilde JM, Skjorten I, Grotta OJ, et al. Right ventricular dysfunction and remodeling in chronic obstructive pulmonary disease without pulmonary hypertension. J Am Coll Cardiol. 2013;62:1103–1111. doi: 10.1016/j.jacc.2013.04.091. [DOI] [PubMed] [Google Scholar]
- 7.Watz H, Waschki B, Meyer T, et al. Decreasing cardiac chamber sizes and associated heart dysfunction in copd: Role of hyperinflation. Chest. 2010;138:32–38. doi: 10.1378/chest.09-2810. [DOI] [PubMed] [Google Scholar]
- 8.Jorgensen K, Muller MF, Nel J, Upton RN, Houltz E, Ricksten SE. Reduced intrathoracic blood volume and left and right ventricular dimensions in patients with severe emphysema: An MRI study. Chest. 2007;131:1050–1057. doi: 10.1378/chest.06-2245. [DOI] [PubMed] [Google Scholar]
- 9.Marcus JT, Vonk Noordegraaf A, De Vries PM, et al. MRI evaluation of right ventricular pressure overload in chronic obstructive pulmonary disease. J Magn Reson Imaging. 1998;8:999–1005. doi: 10.1002/jmri.1880080502. [DOI] [PubMed] [Google Scholar]
- 10.Pattynama PM, Willems LN, Smit AH, van der Wall EE, de Roos A. Early diagnosis of cor pulmonale with MR imaging of the right ventricle. Radiology. 1992;182:375–379. doi: 10.1148/radiology.182.2.1531092. [DOI] [PubMed] [Google Scholar]
- 11.Turnbull LW, Ridgway JP, Biernacki W, et al. Assessment of the right ventricle by magnetic resonance imaging in chronic obstructive lung disease. Thorax. 1990;45:597–601. doi: 10.1136/thx.45.8.597. [DOI] [PMC free article] [PubMed] [Google Scholar]
- 12.Vonk-Noordegraaf A, Marcus JT, Holverda S, Roseboom B, Postmus PE. Early changes of cardiac structure and function in COPD patients with mild hypoxemia. Chest. 2005;127:1898–1903. doi: 10.1378/chest.127.6.1898. [DOI] [PubMed] [Google Scholar]
- 13.Saito H, Dambara T, Aiba M, Suzuki T, Kira S. Evaluation of cor pulmonale on a modified short-axis section of the heart by magnetic resonance imaging. Am Rev Respir Dis. 1992;146:1576–1581. doi: 10.1164/ajrccm/146.6.1576. [DOI] [PubMed] [Google Scholar]
- 14.Burrows B, Kettel LJ, Niden AH, Rabinowitz M, Diener CF. Patterns of cardiovascular dysfunction in chronic obstructive lung disease. N Engl J Med. 1972;286:912–918. doi: 10.1056/NEJM197204272861703. [DOI] [PubMed] [Google Scholar]
- 15.Jamal K, Fleetham JA, Thurlbeck WM. Cor pulmonale: Correlation with central airway lesions, peripheral airway lesions, emphysema, and control of breathing. Am Rev Respir Dis. 1990;141:1172–1177. doi: 10.1164/ajrccm/141.5_Pt_1.1172. [DOI] [PubMed] [Google Scholar]
- 16.Grau M, Barr RG, Lima JA, et al. Percent emphysema and right ventricular structure and function: The multi-ethnic study of atherosclerosis-lung and multi-ethnic study of atherosclerosis-right ventricle studies. Chest. 2013;144:136–144. doi: 10.1378/chest.12-1779. [DOI] [PMC free article] [PubMed] [Google Scholar]
- 17.Bild DE, Bluemke DA, Burke GL, et al. Multi-ethnic study of atherosclerosis: Objectives and design. Am J Epidemiol. 2002;156:871–881. doi: 10.1093/aje/kwf113. [DOI] [PubMed] [Google Scholar]
- 18.Mesia-Vela S, Yeh CC, Austin JH, et al. Plasma carbonyls do not correlate with lung function or computed tomography measures of lung density in older smokers. Biomarkers. 2008;13:422–434. doi: 10.1080/13547500802002859. [DOI] [PMC free article] [PubMed] [Google Scholar]
- 19.Rodriguez J, Jiang R, Johnson WC, MacKenzie BA, Smith LJ, Barr RG. The association of pipe and cigar use with cotinine levels, lung function, and airflow obstruction: A cross-sectional study. Ann Intern Med. 2010;152:201–210. doi: 10.1059/0003-4819-152-4-201002160-00004. [DOI] [PMC free article] [PubMed] [Google Scholar]
- 20.Hankinson JL, Kawut SM, Shahar E, Smith LJ, Stukovsky KH, Barr RG. Performance of american thoracic society-recommended spirometry reference values in a multiethnic sample of adults: The Multi-Ethnic Study of Atherosclerosis (MESA)-Lung Study. Chest. 2010;137:138–145. doi: 10.1378/chest.09-0919. [DOI] [PMC free article] [PubMed] [Google Scholar]
- 21.Celli BR, MacNee W. Standards for the diagnosis and treatment of patients with COPD: A summary of the ATS/ERS position paper. Eur Respir J. 2004;23:932–946. doi: 10.1183/09031936.04.00014304. [DOI] [PubMed] [Google Scholar]
- 22.Spiromics protocol.
- 23.Gevenois PA, de Maertelaer V, De Vuyst P, Zanen J, Yernault JC. Comparison of computed density and macroscopic morphometry in pulmonary emphysema. Am J Resp Crit Care Med. 1995;152:653–657. doi: 10.1164/ajrccm.152.2.7633722. [DOI] [PubMed] [Google Scholar]
- 24.Smith BM, Austin JHM, Newell JD, et al. Pulmonary emphysema subtypes on computed tomography in smokers. American Journal of Medicine. 2014;127:94. doi: 10.1016/j.amjmed.2013.09.020. e7-23. [DOI] [PMC free article] [PubMed] [Google Scholar]
- 25.Exam 5 field center procedures manual of operations. [accessed June 1, 2012];MESA - NHLBI, 2010. at http://www.Mesa-nhlbi.Org/publicdocs/2011/mesae5_mopjanuary2011.Pdf.).
- 26.Chahal H, Johnson C, Tandri H, et al. Relation of cardiovascular risk factors to right ventricular structure and function as determined by magnetic resonance imaging (results from the multi-ethnic study of atherosclerosis) The American journal of cardiology. 2010;106:110–116. doi: 10.1016/j.amjcard.2010.02.022. [DOI] [PMC free article] [PubMed] [Google Scholar]
- 27.Natori S, Lai S, Finn JP, et al. Cardiovascular function in multi-ethnic study of atherosclerosis: Normal values by age, sex, and ethnicity. AJR Am J Roentgenol. 2006;186:S357–365. doi: 10.2214/AJR.04.1868. [DOI] [PubMed] [Google Scholar]
- 28.Kawut SM, Lima JA, Barr RG, et al. Sex and race differences in right ventricular structure and function: The Multi-Ethnic Study of Atherosclerosis-Right Ventricle Study. Circulation. 2011;123:2542–2551. doi: 10.1161/CIRCULATIONAHA.110.985515. [DOI] [PMC free article] [PubMed] [Google Scholar]
- 29.Goldstein TA, Zhang H, Misselwitz B, Gropler RG, Zheng J. Improvement of quantification of myocardial first-pass perfusion mapping: A temporal and spatial wavelet denoising method. Magn Reson Med. 2006;56:439–445. doi: 10.1002/mrm.20950. [DOI] [PubMed] [Google Scholar]
- 30.Hueper K, Parikh MA, Prince MR, et al. Quantitative and semiquantitative measures of regional pulmonary microvascular perfusion by magnetic resonance imaging and their relationships to global lung perfusion and lung diffusing capacity: The Multi-Ethnic Study of Atherosclerosis-Chronic Obstructive Pulmonary Disease Study. Invest Radiol. 2013;48:223–230. doi: 10.1097/RLI.0b013e318281057d. [DOI] [PMC free article] [PubMed] [Google Scholar]
- 31.Psaty BM, Lee M, Savage PJ, Rutan GH, German PS, Lyles M. Assessing the use of medications in the elderly: Methods and initial experience in the cardiovascular health study. The cardiovascular health study collaborative research group. J Clin Epidemiol. 1992;45:683–692. doi: 10.1016/0895-4356(92)90143-b. [DOI] [PubMed] [Google Scholar]
- 32.Smith BM, Kawut SM, Bluemke DA, et al. Pulmonary hyperinflation and left ventricular mass. Circulation. 2013;127:1503–1511. doi: 10.1161/CIRCULATIONAHA.113.001653. [DOI] [PMC free article] [PubMed] [Google Scholar]
- 33.WHO. Chronic cor pulmonale. Circulation. 1963;27:594–615. [Google Scholar]
- 34.Wells JM, Washko GR, Han MK, et al. Pulmonary arterial enlargement and acute exacerbations of COPD. N Engl J Med. 2012;367:913–921. doi: 10.1056/NEJMoa1203830. [DOI] [PMC free article] [PubMed] [Google Scholar]
- 35.Kawut SM. Copd: Cardiopulmonary disease? Eur Respir J. 2013;41:1241–1243. doi: 10.1183/09031936.00009413. [DOI] [PubMed] [Google Scholar]
- 36.Burgel PR, Paillasseur JL, Peene B, et al. Two distinct chronic obstructive pulmonary disease (COPD) phenotypes are associated with high risk of mortality. PLoS One. 2012;7:e51048. doi: 10.1371/journal.pone.0051048. [DOI] [PMC free article] [PubMed] [Google Scholar]
- 37.Benditt JO, Wood DE, McCool FD, Lewis S, Albert RK. Changes in breathing and ventilatory muscle recruitment patterns induced by lung volume reduction surgery. Am J Respir Crit Care Med. 1997;155:279–284. doi: 10.1164/ajrccm.155.1.9001325. [DOI] [PubMed] [Google Scholar]
- 38.Martinez FJ, de Oca MM, Whyte RI, Stetz J, Gay SE, Celli BR. Lung-volume reduction improves dyspnea, dynamic hyperinflation, and respiratory muscle function. Am J Respir Crit Care Med. 1997;155:1984–1990. doi: 10.1164/ajrccm.155.6.9196106. [DOI] [PubMed] [Google Scholar]
- 39.Come CE, Divo MJ, San Jose Estepar R, et al. Lung deflation and oxygen pulse in COPD: Results from the NETT randomized trial. Respir Med. 2012;106:109–119. doi: 10.1016/j.rmed.2011.07.012. [DOI] [PMC free article] [PubMed] [Google Scholar]
- 40.Lammi MR, Ciccolella D, Marchetti N, Kohler M, Criner GJ. Increased oxygen pulse after lung volume reduction surgery is associated with reduced dynamic hyperinflation. Eur Respir J. 2012;40:837–843. doi: 10.1183/09031936.00169311. [DOI] [PubMed] [Google Scholar]
- 41.Mineo TC, Pompeo E, Rogliani P, et al. Effect of lung volume reduction surgery for severe emphysema on right ventricular function. Am J Respir Crit Care Med. 2002;165:489–494. doi: 10.1164/ajrccm.165.4.2108129. [DOI] [PubMed] [Google Scholar]
- 42.Nakhjavan FK, Palmer WH, McGregor M. Influence of respiration on venous return in pulmonary emphysema. Circulation. 1966;33:8–16. doi: 10.1161/01.cir.33.1.8. [DOI] [PubMed] [Google Scholar]
- 43.Harhay MO, Tracy RP, Bagiella E, et al. Relationship of crp, il-6, and fibrinogen with right ventricular structure and function: The MESA-Right Ventricle Study. International Journal of Cardiology. 2013;168:3818–3824. doi: 10.1016/j.ijcard.2013.06.028. [DOI] [PMC free article] [PubMed] [Google Scholar]
- 44.Leary PJ, Barr RG, Bluemke DA, et al. Von willebrand factor and the right ventricle (The MESA-Right Ventricle Study) The American Journal of Cardiology. 2012;110:1846–1851. doi: 10.1016/j.amjcard.2012.08.022. [DOI] [PMC free article] [PubMed] [Google Scholar]
Associated Data
This section collects any data citations, data availability statements, or supplementary materials included in this article.