Abstract
Metabolic heterogeneity is a key factor in cancer pathogenesis. We found that a subset of BRAF and NRAS mutant human melanomas resistant to the MEK inhibitor selumetinib displayed increased oxidative phosphorylation (OxPhos) mediated by the transcriptional co-activator PGC1α. Notably, all selumetinib-resistant cells with elevated OxPhos could be re-sensitized by co-treatment with the mTORC1/2 inhibitor AZD8055, whereas this combination was ineffective in resistant cell lines with low OxPhos. In both BRAF- and NRAS-mutant melanoma cells, MEK inhibition increased MITF expression which in turn elevated levels of PGC1α. In contrast, mTORC1/2 inhibition triggered cytoplasmic localization of MITF, decreasing PGC1α expression and inhibiting OxPhos. Analysis of tumor biopsies from BRAF-mutant melanoma patients progressing on BRAF inhibitor {plus minus} MEK inhibitor revealed that PGC1α levels were elevated in approximately half of the resistant tumors. Overall, our findings highlight the significance of OxPhos in melanoma and suggest that combined targeting of the MAPK and mTORC pathways may offer an effective therapeutic strategy to treat melanomas with this metabolic phenotype.
Keywords: melanoma, oxidative phosphorylation, PGC1alpha, MITF, mTORC1/2
INTRODUCTION
The identification of frequent activating mutations in BRAF (45%) and NRAS (15-20%) has led to the clinical development of MAPK pathway inhibitors for patients with advanced melanoma (1). BRAF and MEK inhibitors have gained regulatory approval for metastatic melanoma patients with activating BRAF mutations (2−4). However, their activity varies markedly between patients, and clinical responses are generally not durable (2, 5). Hence, there is a critical need to determine and overcome mechanisms of de novo and acquired resistance to MAPK pathway inhibitors.
Here we present the results of a whole genome siRNA synthetic lethality screen to identify genes and networks that may be targeted to overcome resistance to MAPK pathway inhibitors. This and other approaches have identified increased mitochondrial oxidative phosphorylation (OxPhos) as a mediator of resistance and a therapeutic target. OxPhos has recently been linked in melanoma to the transcriptional co-activator PGC1α, which is transcriptionally activated by the lineage specific transcription factor MITF (6, 7). Our analysis of both patient samples and cell lines presents new data implicating OxPhos in acquired resistance to MAPK pathway inhibitors, and identifies a novel correlation with sensitivity to mTORC1/2 inhibition. These findings add to our understanding of the significance of OxPhos in this disease and suggest a potential personalized therapeutic strategy to overcome it.
METHODS
Cell lines, plasmids and inhibitors
Cell line authentication and BRAF/NRAS mutation detection were previously described (8-10). Cells were grown in RPMI media in 5% fetal bovine serum. PGC1α promoter reporter was obtained from Addgene. MITF and TRPM1 promoter reporters were obtained from R. Haq (6). Selumetinib (AZD6244/ARRY142886), AZD8055 and AZD2014 were from AstraZeneca, PLX4720 was from Plexxikon, and other inhibitors were from SelleckChem. For in vitro treatments, the inhibitors were dissolved in DMSO.
Patient samples
Collection and processing of excision biopsies from BRAF-mutation positive melanoma patients enrolled in clinical trials at the Melanoma Institute Australia/Westmead Hospital (MIA-WH) and Massachusetts General Hospital (MGH) have been described earlier (11, 6). Patient treatments, tumor biopsies, mutation detection and sample processing are explained in supplementary tables S1 and S2. siRNA Synthetic Lethality Screen. The siRNA screen design and synthetic lethality analysis is described in supplementary methods.
RNA analysis
RNA extraction from the MGH melanoma tumor samples, RNA extraction and whole genome expression profiling from the MIA-WH samples has been described previously (23, 6), and the RNA extraction, whole genome expression profiling, RT-qPCR analysis and Ingenuity analysis from cell lines are described in detail in Supplementary methods. Gene expression data of the clinical samples is available at GEO, accession number GSE50509.
Protein analysis
Cytoplasmic and nuclear protein fractions were prepared as described before (12). Reverse Phase Protein Array (RPPA) analysis of whole cell protein lysates was performed at the MDACC Functional Proteomics Core Facility, and data was analyzed as described previously (8, 13). Western blotting and immunofluorescence microscopy was performed using standard procedures. Antibodies used for RPPA and western blotting are listed at the RPPA core website (26). Additional antibodies in the study are lamin A/C (Cell Signaling), PGC1α (Santa Cruz), and MITF (Neomarkers).
DNA sequence analysis
DNA was isolated from cells using a Qiagen DNA isolation kit. Sequence analysis of the T200 cancer gene panel (Table S5) was performed as described in supplementary methods, at the MDACC Institute for Personalized Cancer Therapy (IPCT).
siRNA transfections
Transfections were performed with 20nM of Dharmacon On-Target-plus siRNAs as described previously (13). After indicated treatments, cells were harvested for qPCR, western blotting, metabolic or cell cycle analyses. Experiments were performed with siRNAs showing >80% target knockdowns in western blots.
Cell biological studies
Cell proliferation assays and cell death analysis by flow cytometry-cell cycle analysis were performed as described previously (13). IC50 and the Combination Index (CI) of inhibitors and combinations were determined using Calcusyn software (Biosoft). Luciferase reporter assays were performed following the manufacturer's instructions after transient transfections. Fugene 6 and Xtremegene were used for plasmid and siRNA transfections respectively.
In vivo xenograft growth assay
Xenograft tumors were generated with sub-cutaneous injections of 107 MEL624 cells/animal in the right flank of Ncr-nu/nu nude mice. Tumor-bearing mice were separated into treatment groups of four mice each, and the indicated inhibitor treatments were performed by oral gavage for 15 days. The treatment groups consisted of vehicle (1% tween-80 bid), selumetinib (25mg/kg bid), AZD2014 (20mg/kg qd) and selumetinib +AZD2014 (dosage equivalent to individual inhibitor treatments).Tumor volumes were recorded every three days. Tumors were extracted 3h after the final treatment and protein lysates were prepared by homogenization in a Precellyis 24 tissue homogenizer.
Cellular Metabolism analysis
Bioenergetics stress tests for oxygen consumption rate (OCR) and extracellular acidification rate were performed by the Seahorse XF analyzer in 96 well plates using the manufacturer's protocol. Oligomycin and FCCP treatments were used to confirm oxygen uptake for mitochondrial OxPhos and to determine mitochondrial spare respiratory capacity respectively. Data was normalized against cell numbers. For glucose consumption and lactate release, cells were grown in 6-well plates for 24 h, then media from the cells was collected and centrifuged at 12000xg for five minutes. The supernatants were transferred into 96 well plates, and the levels of glucose and lactate were measured in a YSI metabolic analyzer (YSI Life Sciences). Cellular ATP levels were determined using the Enliten ATP assay system (Promega).
Results
Genome-wide siRNA and gene expression studies implicate increased mitochondrial OxPhos in resistance to MAPK pathway inhibition.
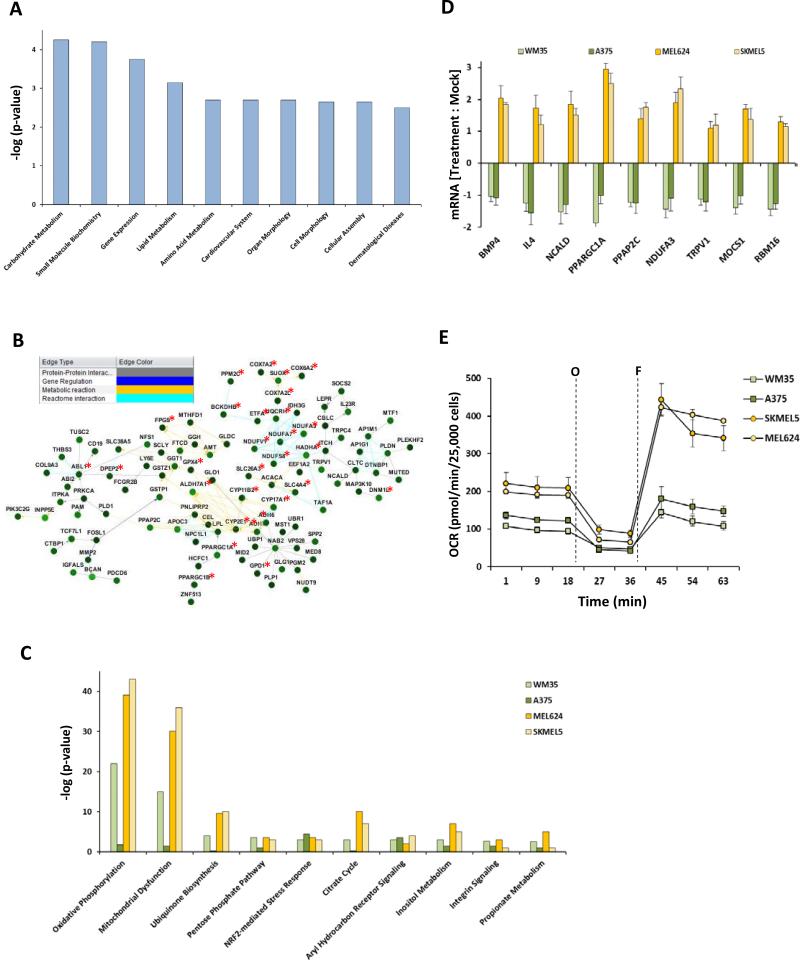
Previous studies showed that the BRAF-mutant, PTEN-intact human melanoma cell line MEL624 was resistant to apoptosis induction by treatment with either the MEK1/2 inhibitor selumetinib or the BRAF inhibitor PLX4720 (13, 14). While antibody-based proteomic profiling with RPPA implicated compensatory activation of the PI3KAKT as one resistance mechanism in these cells, that approach could not interrogate targets/pathways for which validated antibodies were not available. To globally and functionally assess resistance, we performed a genome-wide siRNA screen in the MEL624 cells in the presence of selumetinib or vehicle (DMSO) and identified genes whose loss significantly sensitized the cells to MEK inhibition (synthetic lethality). IPA analysis of the 164 synthetic lethal genes (FDR corrected p<0.05) with selumetinib treatment identified carbohydrate metabolism as the most significantly enriched gene network (Figure 1A). Parallel analysis using Netwalker (15) also identified networks that predominantly consisted of genes associated with mitochondrial functions (Figure 1B). Similar results were obtained in screens with PLX4720 (Figure S1A/B).
Figure 1.
Cellular metabolism genes confer resistance to MEK inhibition by selumetinib. (A) Ingenuity Pathway Analysis (IPA) of cellular functions associated with the 164 genes that showed synthetic lethality (FDR corrected p<0.05) with selumetinib in a genome-wide siRNA screen in the MEL624 cell line. The bar graph shows the ten most significantly enriched cellular functions on the x-axis; y-axis, significance by the Fisher's exact test (p<0.05). (B) Netwalker analysis of the 164 selumetinib-synthetic lethal genes. Genes associated with mitochondrial activity are labeled with a red asterisk. Inset box shows the line colors of known gene interactions. (C) IPA analysis of upregulated KEGG canonical pathways by Fishers exact test (p< 0.05) in the genome-wide expression microarray data of selumetinib-sensitive (A375, WM35) and -resistant BRAF-mutant melanoma cell lines (MEL624, SKMEL5). (D) Synthetic lethal genes that were upregulated in the selumetinib-resistant lines following selumetinib treatment. Y-axis, change in mRNA expression from pre- to post-24 h treatment with 0.25μM selumetinib. (E) Seahorse extracellular flux analysis showing the basal, oligomycin-inhibited (“O”) and FCCP-activated (“F”) OCR in the sensitive and resistant cell lines. Data is average of quadruplicates.
To complement the siRNA screen the effects of selumetinib on the MEL624 cells were examined by whole-genome transcriptional profiling. Selumetinib upregulated OxPhos genes associated with all five complexes of the electron transport chain (Figures S2A/B). To further analyze gene networks associated with selumetinib resistance, gene expression profiling was then performed on BRAF-mutant, PTEN-intact human melanoma cell lines previously characterized to undergo apoptosis (WM35 and A375; “sensitive”) or cell cycle arrest only (MEL624 and SKMEL5; “resistant”) following selumetinib treatment. (13). IPA analysis of canonical pathways identified elevated baseline expression of OxPhos genes in the resistant cells (Figure 1C). Analysis of expression of synthetic lethal genes following treatment with selumetinib for 24h identified nine genes upregulated in both resistant but neither sensitive cell line (Figure 1D). PPARGC1A, which encodes PGC1α, showed the greatest induction following selumetinib treatment among the synthetic lethal genes. PGC1α is a transcriptional co-activator that induces multiple genes involved in mitochondrial OxPhos and increases mitochondrial biogenesis (16). Dynamic metabolic analysis using Seahorse extracellular flux analyzer demonstrated that the resistant cell lines had higher basal and maximal oxygen consumption rates (OCR) (Figures 1E). Resistant cells had lower basal extracellular acidification rates (ECAR), glucose consumption, and lactate release, and higher cellular ATP levels, consistent with an OxPhos-predominant metabolic phenotype (Figures S3A/B/C).
Elevated OxPhos and PGC1α are characteristic features of a subset of MEK inhibitor-resistant melanomas that are sensitive to concurrent mTORC1/2 inhibition
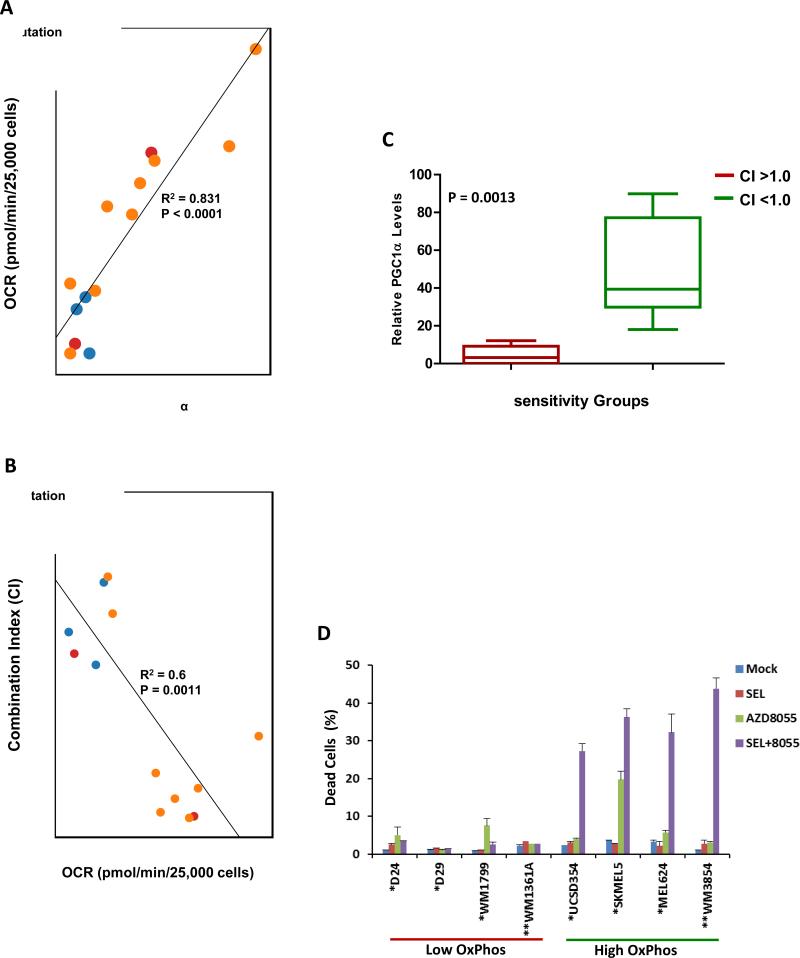
OCR was assessed in a collection of 14 de novo selumetinib-resistant melanoma cell lines. Significant variability in OCR was detected among the cell lines (Figure 2A). OCR did not correlate with BRAF/NRAS mutational status, but it correlated significantly with PGC1α expression (Figure 2A). In previous experiments the selumetinib-resistant, high OxPhos MEL624 and SKMEL5 cells lines demonstrated sensitivity to combined treatment of selumetinib with AZD8055, a catalytic mTOR inhibitor that inhibits both mTORC1 and mTORC2 complexes (13, 17). The growth inhibitory effects of AZD8055 +/- selumetinib were therefore tested in all 14 resistant cell lines (Table S3). IC50 and Combination Indices (CI, ref 18) were determined, which showed that the combination was synergistic (CI<1.0) exclusively in the cell lines with high OxPhos, and the CI correlated significantly and inversely with OCR (Figure 2B and Table S3). PGC1α (p=0.0013) and OCR (p<0.0001) levels were significantly higher in the cell lines with CI<1.0 versus those with CI>1.0 (Figure 2C and S4). FACS analysis of representative cell lines showed that the combination induced cell death (Sub-G1 cells) in 4/4 resistant cell lines with high OxPhos and 0/4 with low OxPhos (Figure 2D). Synergistic apoptosis induction with AZD8055 was also observed with the MEK inhibitor trametinib and the BRAF inhibitor dabrafenib in MEL624 cells (Figure S5).
Figure 2.
mTOR1/2 inhibition is synergistic in melanoma cell lines with de novo resistance to selumetinib and elevated OxPhos. (A) Scatter plot of basal OxPhos (OCR) and PGC1α transcript levels in a panel of 14 selumetinib-resistant melanoma cell lines that are BRAF-mutant (orange), NRAS-mutant (red), or BRAF/NRAS wild-type (blue). (B) Scatter plot showing correlation of the combination index (CI) of selumetinib and AZD8055 with basal OCR in the cell lines. CI < 1.0 indicates synergistic inhibition of cell proliferation by the combination. (C) Box plot showing of PGC1α expression in cell lines with CI>1.0 (Red) and CI<1.0 (Green) for selumetinib+AZD8055. (D) Sub-G1 cell populations detected by FACS following 72 h of the indicated treatments. The BRAF (“*”) mutant and NRAS (“**”) mutant cells were treated with 0.25μM of the inhibitors (alone and in combination). Data is average of 3 replicates; error bars, standard deviation.
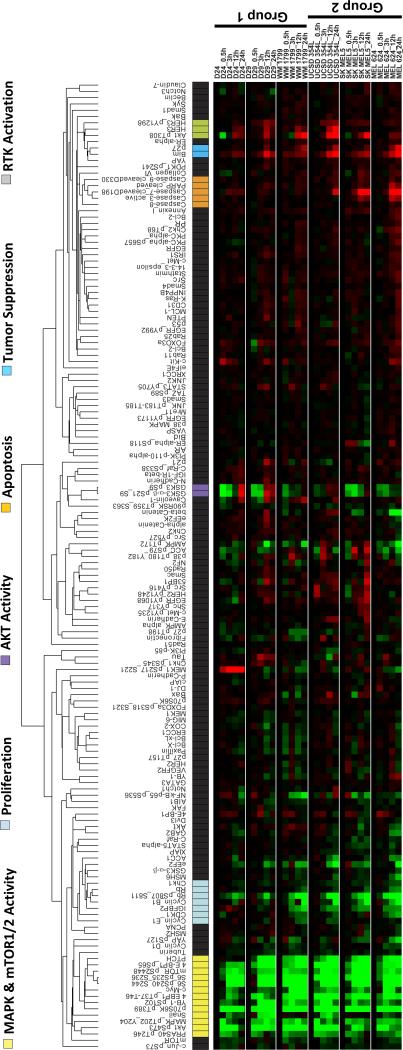
RPPA analysis did not show any differences in target inhibition or known feedback effects (13, 17, 19) between low and high OxPhos BRAF-mutant cell lines following treatment with the combination or the individual inhibitors (Figure 3 and Figure S4A/B/C). However, apoptosis markers (cleaved caspases 3, 7, PARP) were increased in the high OxPhos lines treated with the combination (Figures 3 and S4C). This pattern of differential sensitivity was also observed in a pair of NRAS mutant lines with low (WM1361) and high (WM3854) OxPhos (Figures 2D and S6D).
Figure 3.
RPPA analysis of the effects of selumetinib + AZD8055 treatment on protein signaling networks. Supervised hierarchical clustering heatmap shows time-course analysis of three low OxPhos (Group 1) and three high OxPhos (Group 2) BRAF-mutant human melanoma cell lines treated with 0.25μM each of selumetinib+AZD8055 for 0, 3, 12, and 24 hrs. Data indicates fold changes in the inhibitor treated samples versus DMSO-treated controls in triplicates. Red, increased levels; green, decreased levels of proteins.
Inhibition of mTOR1/2 decreases PGC1 α expression
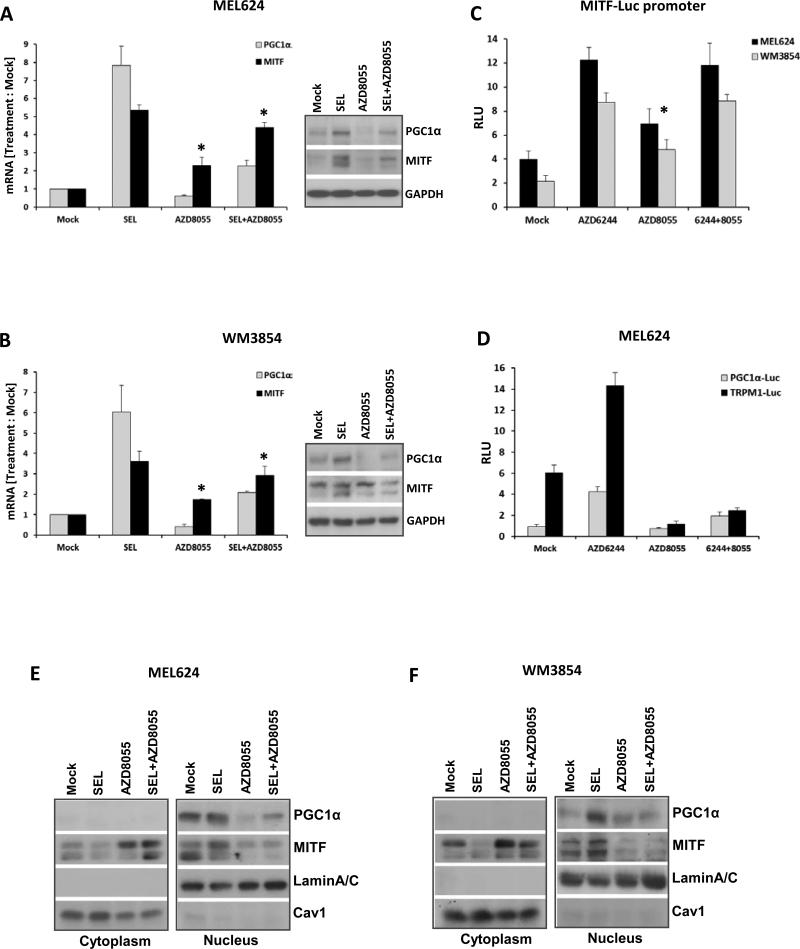
Similar to PGC1α, but less significantly, MITF transcript levels in the 14 cell line panel correlated with MEKi and mTORC1/2i sensitivity and OCR (Figure S7A/B). Selumetinib treatment markedly increased MITF and PGC1α transcript levels in representative BRAF-mutant (MEL624) and NRAS-mutant (WM3854) high OxPhos cell lines (Figure 4A/B), consistent with recently published data (6). In contrast, AZD8055 inhibited basal and selumetinib-induced PGC1α expression, and increased MITF expression (Figure 4A/B). Similar results to the effects on PGC1α were observed for the MITF-regulated genes TRPM1, DCT and TYR (Figure S7C/D), and western blotting analysis showed generally concordant changes in protein expression (Inset western blots in Figures 4A/B). Selumetinib also increased reporter activity for MITF, TRPM1 and PGC1α promoters (Figures 4C and 4D/S7E). AZD8055 decreased the reporter activity of the TRPM1 and PGC1α promoters only (Figure 4C and 4D/S7E).
Figure 4.
AZD8055 decreases PGC1α and OxPhos. qRT-PCR analysis of the fold changes in PGC1α and MITF transcripts (normalized by GAPDH) in MEL624 (A) and WM3854 (B) cells after 24 h treatment with DMSO, 0.25μM of selumetinib or AZD8055, or their combination. Data is average of triplicates. Asterisks indicate significant increases of MITF levels (p<0.05) in the AZD8055 and combination treatments compared to mock, as determined by t-tests. Western blot panels at the right show levels of the indicated proteins for the same treatments. (C) Relative luciferase units (RLU) of MEL624 (black bars) and WM3854 (gray bars) transfected with MITF promoter reporter following the indicated treatments for 24 h in triplicates. Asterisk indicates significant difference (p<0.05) of AZD8055 treatment compared to mock in both cell lines. (D) RLU in MEL624 cells transfected with a PGC1α (black bars) or TRPM1 (gray bars) reporter plasmid followed by the indicated treatments for 24 h in triplicate. Western blotting of cytoplasmic and nuclear extracts from MEL624 (E) and WM3854 (F) cells following treatment with the indicated inhibitors for 24h. Lamin A/C and Caveolin1 served as controls.
Western blotting of nuclear and cytoplasmic extracts showed that AZD8055 treatment resulted in increased cytoplasmic and decreased nuclear MITF protein levels (Figure 4E/F). This was confirmed by immunofluorescence microscopy analysis of similarly treated cells (Figure S8A). To corroborate the MITF dependence of PGC1α and TRPM1 promoter activities in the cells treated with single agents or combination of the inhibitors, luciferase reporter assays were performed in MEL624 cells after siRNA knockdown of MITF. Cells with control siRNA (siRisc) treatment showed a similar profile of inhibitor-induced changes as was observed in the non-siRNA transfected cells in Figure 4D, while cells with MITF knockdown did not upregulate PGC1α and TRPM1 promoter activities after selumetinib treatment (Figures S8B/C). These activities were downregulated after AZD8055 and combination treatments to a greater extent than in the control siRNA treated cells (Figures S8B/C).
Inhibition of mTOR1/2 inhibits OCR in melanoma cells
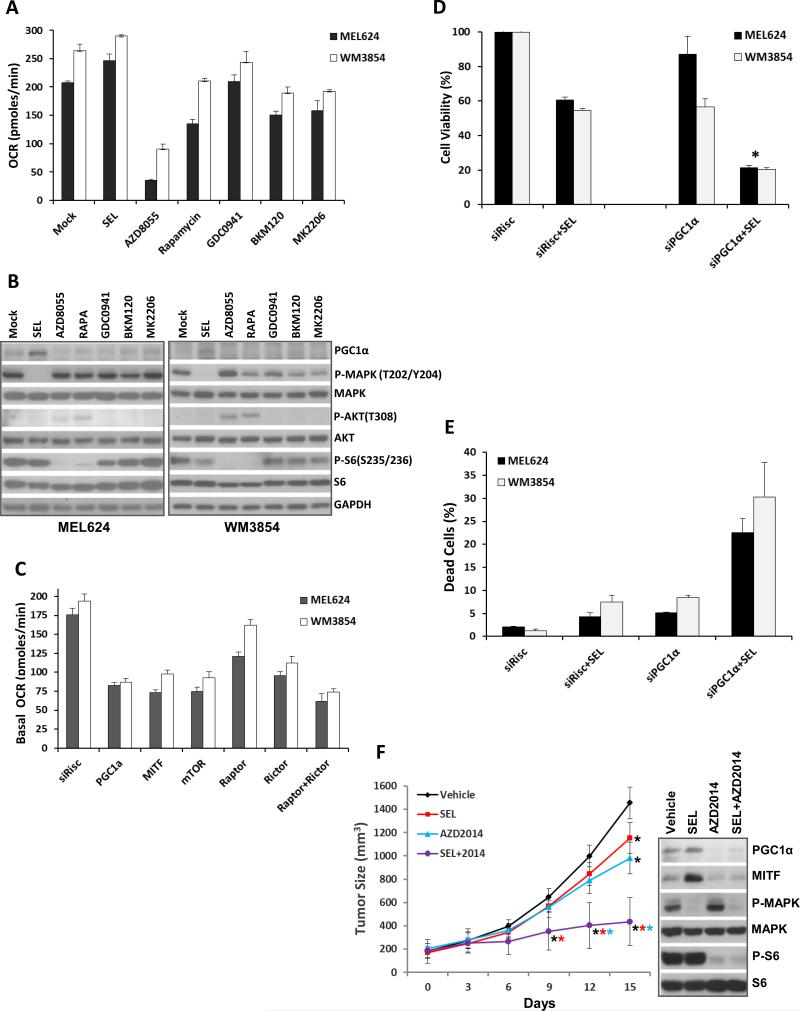
The effects of additional PI3K pathway inhibitors on OCR were assessed. Class I PI3K (GDC0941, BKM120) and AKT (MK2206) inhibitors caused partial inhibition of OCR (Figure 5A) and PGC1α (Figure 5B), but less than was observed with mTORC1/2 inhibition. Treatment with rapamycin, which inhibits mTORC1 only, partially inhibited OCR in both cell lines despite comparable (versus AZD8055) inhibition of phospho-S6 (Figures 5A/B). siRNA-mediated knockdown of mTOR, or combined knockdown of RAPTOR (mTORC1 complex) and RICTOR (mTORC2), inhibited OCR as effectively as knockdown of PGC1α, which was more than knockdown of RAPTOR or RICTOR alone achieved (Figure 5C). Supporting the functional significance of PGC1α, siRNA-mediated knockdown of PGC1α produced additive or synergistic effects with selumetinib on growth inhibition and apoptosis induction in both lines (Figure 5D/E). Knockdown efficacies were confirmed by western blotting (Figure S8D).
Figure 5.
Comparative effects of inhibition of PI3K pathway components and in vivo efficacy of selumetinib+AZD8055. (A) Basal OCR levels in MEL624 (black bars) and WM3854 (white bars) cells after 24 h treatment with 0.25 μM selumetinib, 0.25 μM AZD8055, 0.1 μM Rapamycin, 1 μM of GDC0941, 1 μM BKM120 or 5 μM MK2206. Data is average of quadruplicates. (B) Western blotting following indicated treatments for 24 h. (C) Basal OCR in the MEL624 (black bars) and WM3854 (white bars) after siRNA-mediated knockdown of the indicated genes. OCR was determined 72 h after transfection with 20nM of siRNAs. Bars represent average of quadruplicates. (D) Cell viability in the MEL624 (gray bars) and WM3854 (black bars) following knockdown of PGC1α by siRNA with or without 0.25 μM selumetinib treatment. Selumetinib was added 24 h after siRNA transfection, cell viability was measured after 72 h with CTB. Data is average of triplicates. Asterisk indicates significant difference from siRisc+SEL by t-test (p<0.05). (E) The MEL624 and WM3854 cells were treated as in D, and the sub-G1 dead cell population was determined by FACS analysis (triplicates). (F) In vivo growth of MEL624 subcutaneous tumors treated with indicated inhibitors. Colored asterisks indicate significant difference (p<0.05) of a treatment from a different treatment represented by the respective line color. Western blot panel shows the levels of indicated proteins in tumor lysates on day 15.
Mice with sub-cutaneous xenografts of MEL624 cells were treated with vehicle, selumetinib, AZD2014 (analog of AZD8055 with superior in vivo pharmacokinetics (20, Figure S9)), or selumetinib + AZD2014. After 15 days of continuous treatment, tumor growth was only slightly inhibited with each single agent but was significantly inhibited by selumetinb + AZD2014 (Figure 5F). Western blotting revealed that the individual treatments and the combination inhibited direct targets (P-ERK, P-S6) of each inhibitor (Figure 5F right panel). Selumetinib increased PGC1α and MITF levels, and AZD2014 decreased PGC1α, and also decreased MITF, which was unlike the effects observed in vitro (Figure 5F).
Increased OxPhos in melanoma cell lines and patient samples with acquired resistance to MAPK pathway inhibitors
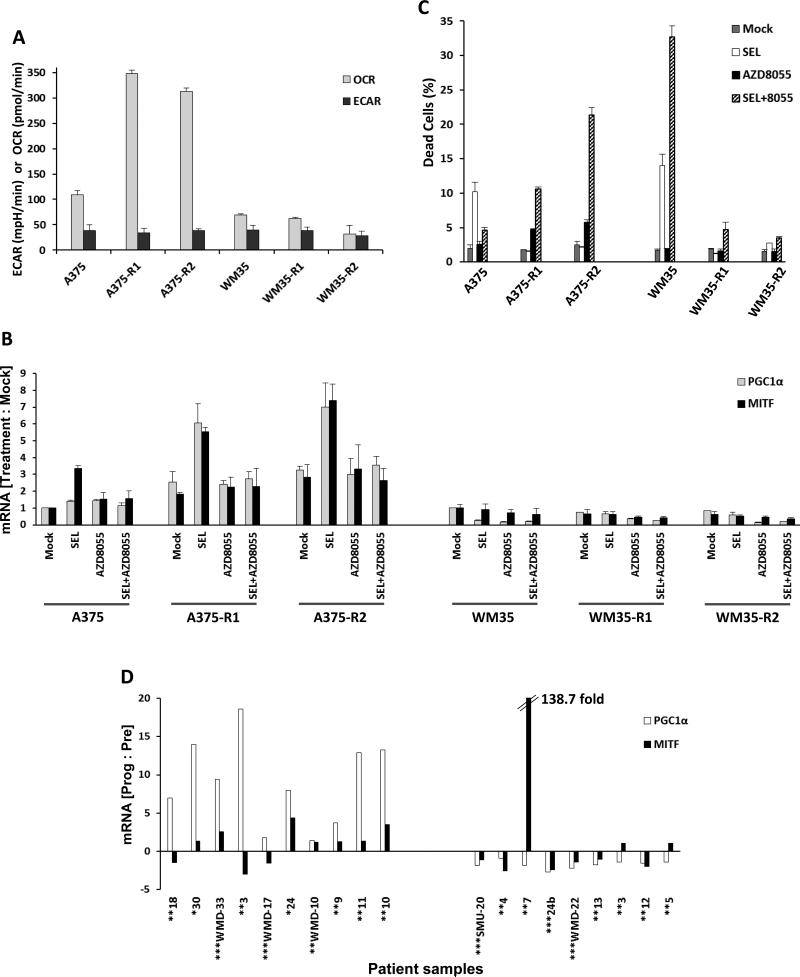
The selumetinib-sensitive A375 and WM35 cell lines were cultured in 0.5 μM selumetinib for 60 days and MEKi-resistant clones (A375−R1 and –R2; WM35−R1 and –R2) were isolated (Figure S10A/B). Sequencing of 202 genes with known cancer mutations demonstrated that all four resistant clones had mutations in MEK1 that were not present in the parental cell lines (MEK1F129L in A375-R1/2, MEK1I99N in WM35-R1/2) (Supplementary Table S4). These mutations were previously associated with MEKi resistance (21). Seahorse analysis showed that both A375−R1 and A375−R2 had 3-fold higher basal OCR and 5-fold higher maximal OCR than the parental A375 but similar ECAR (Figures 6A and S10C). The clones demonstrated increased MAPK activity which was partially inhibited by selumetinib (Figure S10D). Both A375−R1 and –R2 showed higher expression of PGC1α compared to the parental cells, and markedly increased expression following selumetinib treatment (Figure 6B). AZD8055 treatment blocked the increase in PGC1α (Figure 6B), caused synergistic short-term and long-term growth inhibition (Figure S11), and induced apoptosis in the A375-R1 and A375-R2 (Figure 6C). Similar to the heterogeneity observed in de novo resistant cell lines, WM35−R1 and −R2 clones did not demonstrate increases in OCR (Figures 6A and S10C) or PGC1α (Figures 6B), nor synergy with selumetinib+AZD8055 (Figures S11 and 6C).
Figure 6.
OxPhos and PGC1α in acquired resistance to MAPK pathway inhibitors. (A) Basal OCR and ECAR levels in the parental A375, WM35 cell lines and their selumetinib-resistant clones (“-R1”, “-R2”) determined by Seahorse flux analysis. Gray bars, OCR; Black bars, ECAR. Data is average of quadruplicates. (B) PGC1α and MITF mRNA levels in the A375 and WM35 cells and their resistant clones at 24 h following treatment with DMSO (mock), 0.25μM selumetinib, 0.25μM AZD8055, or selumetinib+AZD8055. qPCR was performed on triplicate samples, and GAPDH-normalized changes in mRNA levels in inhibitor treatments versus mocks were determined. (C) Sub-G1 dead cell populations of A375 and WM35 parental cells and their resistant clones following treatment with the indicated inhibitors for 72h. Data is average of triplicates. (D) Ratios of PGC1α and MITF gene expression at the time of disease progression versus pre-treatment in the MIA/WH patient cohort. Patients were treated with vemurafenib (*), dabrafenib (**), or dabrafenib+ trametinib (***). White bars, PGC1α; Black bars, MITF.
PGC1α and MITF transcript levels were assessed in two independent cohorts of BRAF-mutant metastatic melanoma patients treated with MAPK pathway inhibitors with biopsies obtained prior to treatment and at the time of disease progression (Tables S1 and S2). Among the 18 patients in the MIA/WH cohort treated with BRAF inhibitors (five in combination with the MEK inhibitor trametinib), nine demonstrated increased tumor PGC1α expression at the time of disease progression compared to pre-treatment (Figure 6D). Among the five MGH patients treated with BRAF inhibitors (four dabrafenib + trametinib) with evaluable mRNA pre-treatment and at progression, one patient demonstrated >20-fold increase in PGC1α at disease progression, while two others showed ~2-fold increases (Figure S12A). MITF levels in both cohorts generally but not universally correlated with PGC1α levels. MAPK was activated in most of the MIA/WH tumors at progression and on treatment, but did not correlate with PGC1α or MITF expression (Table S1). In the MGH patients, MAPK was activated in 3/5 progressed tumors (Table S2).
Discussion
There is a critical need to identify new approaches to overcome resistance to MAPK pathway inhibitors. Activation of several oncogenic signaling pathways has been implicated previously in resistance to BRAF inhibitors in melanoma. The studies presented here add to the growing evidence that alterations in cellular metabolism may also play a key role. Specifically, our approach using whole genome siRNA screening and mRNA expression profiling to broadly interrogate resistance to MAPK pathway inhibitors implicated high OxPhos as a central resistance mechanism and therapeutic target. Similar to other recent studies in this field (6, 7), we found that elevated OxPhos correlated strongly with increased expression of PGC1α. In addition to characterizing a subset of melanoma cell lines with de novo resistance to MAPK pathway inhibitors, we have also identified elevated OxPhos as a characteristic of cell lines and patients with acquired resistance. Importantly, we have also demonstrated for the first time that melanomas with increased OxPhos are sensitive to combined treatment with MAPK pathway inhibitors and mTORC1/2 inhibition in vitro and in vivo, and that mTORC1/2 inhibition affects MITF localization and PGC1α expression. These results identify a new and unexpected function for mTORC1/2 signaling in melanoma, and identify a potentially clinically actionable strategy to overcome resistance mediated by OxPhos.
Two other groups have recently reported that PGC1α expression correlates with, and is regulated by, MITF in melanoma. Underscoring the clinical significance of this finding, increased expression of PGC1α correlated with shorter survival in a small cohort of melanoma patients with regional metastases (6, 7). One group also demonstrated that inhibition of MAPK pathway signaling in melanomas with activating BRAF mutations resulted in increased MITF expression, and subsequently PGC1α, in both cell lines and patients (6). Enforced expression of PGC1α in melanoma cell lines with activating BRAF mutations reduced their sensitivity to growth inhibition by BRAF inhibitors (6). We similarly have found that inhibition of either BRAF or MEK results in an induction of MITF and PGC1α in roughly half of human melanoma cells lines with de novo resistance to MAPK pathway inhibitors. Notably, this effect is heterogeneous among melanoma cell lines, with much higher levels of MEK inhibitor-induced PGC1α expression occurring in a subset of BRAF-mutant cell lines with de novo resistance compared to BRAF-mutant cells lines that undergo apoptosis. This heterogeneity was also observed in subclones of sensitive BRAF-mutant human melanoma cell lines selected for acquired resistance to MEK inhibitors that have clinically relevant MEK1 mutations. We have also shown for the first time that increased PGC1α expression is detected in a significant subset of tumors collected from patients at the time of disease progression on FDA-approved BRAF and BRAF/MEK inhibitor therapy. Together these findings support that melanomas with elevated OxPhos and PGC1α likely represent a clinically important subtype of this disease. Analysis of the PGC1α expression levels in the Cancer Cell Line Encyclopedia (CCLE) collection supports that this phenotype can characterize melanomas with BRAF mutations, NRAS mutations, and tumors that are wild-type for both of those oncogenes (Figure S12B, inset in Figure S12B).
These results strongly support the need for therapeutic strategies for melanomas with elevated OxPhos and PGC1α. One of the previous studies of MITF and PGC1α showed that mitochondrial poisons can increase the sensitivity of BRAF-mutant cells to BRAF inhibitors in vitro (6). It is likely that such strategies will be challenging to implement safely clinically. We previously observed that some cell lines with de novo resistance to apoptosis induced by MAPK inhibitors were sensitive to the combination of selumetinib and the dual mTORC1/2 inhibitor AZD8055 (13, 14). Testing of this combination across an extended panel of cell lines with de novo resistance in our current study unexpectedly showed that all tested cell lines with high OxPhos and elevated PGC1α demonstrated synergistic growth inhibition and apoptosis, which was not observed in any resistant cell lines with low OxPhos. This synergy was observed in high OxPhos melanoma cell lines with activating BRAF mutations and also in a cell line with an activating NRAS mutation. The correlation of increased OxPhos with sensitivity to the combination was also observed in cell lines selected for acquired resistance to MEK inhibitors. The combination of selumetinib and the dual mTORC1/2 inhibitor AZD2014 was markedly more effective than either agent alone in mice bearing xenografts of the BRAF-mutant, high OxPhos MEL624 human melanoma cell line.
Interrogation of the mechanisms underlying the observed synergy with MEK and TORC1/2 inhibitors showed that inhibition of both complexes of mTOR markedly inhibited PGC1α expression. While mTORC1/2 inhibition in vitro did not decrease MITF mRNA expression or promoter activity, western blotting revealed that this treatment resulted in cytoplasmic localization of MITF protein. Nuclear exclusion of MITF by a small molecule is a novel finding. While the MITF antibody used in this study detected the M (melanocytic) isoform of MITF, up to ten MITF isoforms are known to exist, and future studies will determine if others are similarly regulated. Interestingly, long-term in vivo treatment of the MEL624 tumors with mTORC1/2 inhibitor resulted in complete loss of MITF by an unknown mechanism. Determining the mechanism and timing of these observed differential effects on MITF is an important future endeavor, as is interrogation of MITF subcellular localization in melanoma biology, progression and therapy. While our finding of OxPhos regulation by mTORC is consistent with a previous study by Cunningham et al. (22), which implicated the Raptor-mTOR complex (mTORC1) in the activation of mitochondrial function via the transcription factor YY1, our experiments with siRNAs (siRaptor, siRictor) and inhibitors (rapamycin, AZD8055) demonstrate that inhibition of both mTORC1 and mTORC2 activity decreases OxPhos more than inhibition of TORC1 alone.
In summary, our results demonstrate that both de novo and acquired resistance to MAPK pathway inhibitors in melanomas with high OxPhos can be counteracted by mTORC1/2 inhibition. Notably, the metabolic characterization of cell lines and patient samples demonstrates that high OxPhos is not a universal characteristic of MAPK pathway inhibitor resistance, and mTORC1/2 inhibition did not synergize with MEKi in MEKi-resistant cell lines with low OxPhos. Together, these findings support the rationale for clinical characterization of candidate biomarkers of elevated OxPhos in melanoma and other cancers to guide therapeutic selection, and evaluation of combined inhibition of mTOR1/2 and MAPK signaling in this metabolically-defined cancer subtype.
Supplementary Material
Acknowledgement
siRNA synthetic lethality screen was supported by CPRIT (RP110532) and RPPA Core by NCI (CA16672). T200 sequence analysis was supported by Sheikh Khalifa Foundation to the Sheikh Khalifa Bin Zayed Al Nahyan Institute for Personalized Cancer Therapy (IPCT). We thank IPCT Molecular Analysis Laboratory and Dr. Ken Chen for informatics support. YNVG is supported by a grant from the MDACC SPORE in Melanoma (P50 CA093459). GL and HR are supported by a Cancer Institute New South Wales Research Fellowships and NHMRC Fellowship to HR. We thank Richard Kefford, Julie Howle, Robyn Saw, Kerwin Shannon, Andrew Spillane, Jonathan Stretch, John Thompson, Raghava Sharma, Jessica Hyman, Tracy Liaw, Katherine Carson at Melanoma Institute Australia and Westmead Medical Oncology Center.
Supported by grants from MDACC-AstraZeneca Collaborative Research Alliance and Adelson Medical Research Foundation. PDS owns stock in Astra Zeneca.
REFERENCES
- 1.Hocker T, Tsao H. Ultraviolet radiation and melanoma: a systematic review and analysis of reported sequence variants. Hum Mutat. 2007;28:578–88. doi: 10.1002/humu.20481. [DOI] [PubMed] [Google Scholar]
- 2.Chapman PB, Hauschild A, Robert C, Haanen JB, Ascierto P, Larkin J, et al. Improved survival with vemurafenib in melanoma with BRAF V600E mutation. N Engl J Med. 2011;364:2507–16. doi: 10.1056/NEJMoa1103782. [DOI] [PMC free article] [PubMed] [Google Scholar]
- 3.Hauschild A, Grob JJ, Demidov LV, Jouary T, Gutzmer R, Millward M, et al. Dabrafenib in BRAF-mutated metastatic melanoma: a multicentre, open-label, phase 3 randomised controlled trial. Lancet. 2012;380:358–65. doi: 10.1016/S0140-6736(12)60868-X. [DOI] [PubMed] [Google Scholar]
- 4.Flaherty KT, Robert C, Hersey P, Nathan P, Garbe C, Milhem M, et al. Improved survival with MEK inhibition in BRAF-mutated melanoma. N Engl J Med. 2012;367:107–14. doi: 10.1056/NEJMoa1203421. [DOI] [PubMed] [Google Scholar]
- 5.Sosman JA, Kim KB, Schuchter L, Gonzalez R, Pavlick AC, Weber JS, et al. Survival in BRAF V600-mutant advanced melanoma treated with vemurafenib. N Engl J Med. 2012;366:707–14. doi: 10.1056/NEJMoa1112302. [DOI] [PMC free article] [PubMed] [Google Scholar]
- 6.Haq R, Shoag J, Andreu-Perez P, Yokoyama S, Edelman H, Rowe GC, et al. Oncogenic BRAF regulates oxidative metabolism via PGC1α and MITF. Cancer Cell. 2013;23:302–15. doi: 10.1016/j.ccr.2013.02.003. [DOI] [PMC free article] [PubMed] [Google Scholar]
- 7.Vazquez F, Lim JH, Chim H, Bhalla K, Girnun G, Pierce K, et al. PGC1α expression defines a subset of human melanoma tumors with increased mitochondrial capacity and resistance to oxidative stress. Cancer Cell. 2013;23:287–301. doi: 10.1016/j.ccr.2012.11.020. [DOI] [PMC free article] [PubMed] [Google Scholar]
- 8.Davies MA, Stemke-Hale K, Lin E, Tellez C, Deng W, Gopal YN, et al. Integrated Molecular and Clinical Analysis of AKT Activation in Metastatic Melanoma. Clin Cancer Res. 2009;15:7538–46. doi: 10.1158/1078-0432.CCR-09-1985. [DOI] [PMC free article] [PubMed] [Google Scholar]
- 9.Thomas RK, Baker AC, Debiasi RM, Winckler W, Laframboise T, Lin WM, et al. High-throughput oncogene mutation profiling in human cancer. Nat Genet. 2007;39:347–51. doi: 10.1038/ng1975. [DOI] [PubMed] [Google Scholar]
- 10.Davies MA, Stemke-Hale K, Tellez C, Calderone TL, Deng W, Prieto, et al. A novel AKT3 mutation in melanoma tumours and cell lines. Br J Cancer. 2008;99:1265–8. doi: 10.1038/sj.bjc.6604637. [DOI] [PMC free article] [PubMed] [Google Scholar]
- 11.Rizos H, Menzies AM, Pupo GM, Carlino MS, Fung C, Hyman J, Haydu LE, Mijatov B, Becker TM, Boyd SC, Howle J, Saw R, Thompson JF, Kefford RF, Scolyer RA, Long GV. BRAF Inhibitor Resistance Mechanisms in Metastatic Melanoma: Spectrum and Clinical Impact. Clin Cancer Res. 2014 Apr 1;20:1965–77. doi: 10.1158/1078-0432.CCR-13-3122. [DOI] [PubMed] [Google Scholar]
- 12.Schreiber E, Matthias P, Muller MM, Schaffner W. Rapid detection of octamer binding proteins with ‘mini-extracts', prepared from a small number of cells. Nucleic Acids Res. 1989;17:6419. doi: 10.1093/nar/17.15.6419. 1989. [DOI] [PMC free article] [PubMed] [Google Scholar]
- 13.Gopal YN, Deng W, Woodman SE, Komurov K, Ram P, Smith PD, et al. Basal and treatment-induced activation of AKT mediates resistance to cell death by AZD6244 (ARRY-142886) in Braf-mutant human cutaneous melanoma cells. Cancer Res. 2010;70:8736–47. doi: 10.1158/0008-5472.CAN-10-0902. [DOI] [PMC free article] [PubMed] [Google Scholar]
- 14.Deng W, Gopal YN, Scott A, Chen G, Woodman SE, Davies MA. Role and therapeutic potential of PI3K-mTOR signaling in de novo resistance to BRAF inhibition. Pigment Cell Melanoma Res. 2012;25:248–58. doi: 10.1111/j.1755-148X.2011.00950.x. [DOI] [PubMed] [Google Scholar]
- 15.Komurov K, Dursun S, Erdin S, Ram PT. NetWalker: a contextual network analysis tool for functional genomics. BMC Genomics. 2012;13:282. doi: 10.1186/1471-2164-13-282. [DOI] [PMC free article] [PubMed] [Google Scholar]
- 16.Lin J, Handschin C, Spiegelman BM BM. Metabolic control through the PGC-1 family of transcription coactivators. Cell Metab. 2005;1:361–70. doi: 10.1016/j.cmet.2005.05.004. [DOI] [PubMed] [Google Scholar]
- 17.Chresta CM, Davies BR, Hickson I, Harding T, Cosulich S, Critchlow SE, et al. AZD8055 is a potent, selective, and orally bioavailable ATP-competitive mammalian target of rapamycin kinase inhibitor with in vitro and in vivo antitumor activity. Cancer Res. 2010;70:288–98. doi: 10.1158/0008-5472.CAN-09-1751. [DOI] [PubMed] [Google Scholar]
- 18.Chou TC. Drug combination studies and their synergy quantification using the Chou-Talalay method. Cancer Res. 2010 Jan 15;70:440–6. doi: 10.1158/0008-5472.CAN-09-1947. [DOI] [PubMed] [Google Scholar]
- 19.Rodrik-Outmezguine VS, Chandarlapaty S, Pagano NC, Poulikakos PI, Scaltriti M, Moskatel E, et al. mTOR kinase inhibition causes feedback-dependent biphasic regulation of AKT signaling. Cancer Discov. 2011;1:248–59. doi: 10.1158/2159-8290.CD-11-0085. [DOI] [PMC free article] [PubMed] [Google Scholar]
- 20.Pike KG, Malagu K, Hummersone MG, Menear KA, Duggan HM, Gomez S, et al. Optimization of potent and selective dual mTORC1 and mTORC2 inhibitors: the discovery of AZD8055 and AZD2014. Bioorg Med Chem Lett. 2013;23:1212–6. doi: 10.1016/j.bmcl.2013.01.019. [DOI] [PubMed] [Google Scholar]
- 21.Emery CM, Vijayendran KG, Zipser MC, Sawyer AM, Niu L, Kim JJ, et al. MEK1 mutations confer resistance to MEK and B-RAF inhibition. Proc Natl Acad Sci U S A. 2009;106:20411–6. doi: 10.1073/pnas.0905833106. [DOI] [PMC free article] [PubMed] [Google Scholar]
- 22.Cunningham JT, Rodgers JT, Arlow DH, Vazquez F, Mootha VK, Puigserver P. mTOR controls mitochondrial oxidative function through a YY1-PGC-1alpha transcriptional complex. Nature. 2007;450:736–40. doi: 10.1038/nature06322. [DOI] [PubMed] [Google Scholar]
- 23.Falchook GS, Long GV, Kurzrock R, Kim KB, Arkenau TH, Brown MP, et al. Dabrafenib in patients with melanoma, untreated brain metastases, and other solid tumours: a phase 1 dose-escalation trial. Lancet. 2012;379:1893–901. doi: 10.1016/S0140-6736(12)60398-5. [DOI] [PMC free article] [PubMed] [Google Scholar]
- 24.Pratilas CA, Taylor BS, Ye Q, Viale A, Sander C, Solit DB, et al. (V600E)BRAF is associated with disabled feedback inhibition of RAF-MEK signaling and elevated transcriptional output of the pathway. Proc Natl Acad Sci U S A. 106:4519–24. doi: 10.1073/pnas.0900780106. [DOI] [PMC free article] [PubMed] [Google Scholar]
- 25.Nazarian R, Shi H, Wang Q, Kong X, Koya RC, Lee H, et al. Melanomas acquire resistance to B-RAF(V600E) inhibition by RTK or N-RAS upregulation. Nature. 2010;468:973. doi: 10.1038/nature09626. [DOI] [PMC free article] [PubMed] [Google Scholar]
- 26. http://www.mdanderson.org/education-and-research/resources-for-professionals/scientific-resources/core-facilities-and-services/functional-proteomics-rppa-core/index.html.
Associated Data
This section collects any data citations, data availability statements, or supplementary materials included in this article.


