

Abstract
We illustrate a general principal of electrical potential measurements from the surface of the cerebral cortex, by revisiting and reanalyzing experimental work from the visual, language and motor systems. A naïve decomposition technique of electrocorticographic power spectral measurements reveals that broadband spectral changes reliably track task engagement. These broadband changes are shown to be a generic correlate of local cortical function across a variety of brain areas and behavioral tasks. Furthermore, they fit a power-law form that is consistent with simple models of the dendritic integration of asynchronous local population firing. Because broadband spectral changes covary with diverse perceptual and behavioral states on the timescale of 20–50ms, they provide a powerful and widely applicable experimental tool.
Keywords: Human, Electrocorticography, Brain, Physiology, Broadband spectral change
Introduction
When examining the extracellular voltage power spectrum of occipital or rolandic cortex, the shift from rest to task is strongly associated with an increase in power at high frequencies (greater than ~50Hz), and often accompanied by a decrease in power at low frequencies (less than ~30Hz) (Aoki et al., 1999; Crone et al., 2001; Crone et al., 1998a; Crone et al., 1998b; Miller et al., 2007). When we first investigated these signals, our interpretation was that there would be different high-frequency oscillations specific to each cortical region and function. However, in each case that we examined the high-frequency spectral changes lacked a definitive upper bound, and appeared to extend to the highest frequencies resolvable with our sampling rate and noise floor.
This presented a pair of questions. First, might the high-frequency spectral changes reflect a broadband change in the power spectrum? Second, might this broadband change track asynchronous processes in the underlying neuronal dynamics? In this paper, we review and reanalyze data supporting the claim that that broadband shifts are indeed a generic marker of circuit activation in the neocortex (Manning et al., 2009; Miller, 2010; Miller et al., 2009b; Miller et al., 2009c; Ray and Maunsell, 2011; Whittingstall and Logothetis, 2009). Moreover, we discuss how broadband spectral change can be obscured by rhythmic phenomena at lower (e.g. α, β) frequencies, and we illustrate how the changes in high frequencies are different in kind from changes in the canonical lower-frequency rhythms.
Before describing the details of the broadband power shifts, it is important to distinguish rhythmic and non-rhythmic neural processes and their manifestations in the field potential. Rhythmic processes (such as the occipital α and peri-central motor β rhythms) exhibit band-limited spectral peaks, reflective of a characteristic oscillatory time-scale (Bates, 1951; Crone et al., 1998b; Jasper and Penfield, 1949; Jasper, 1941; Jasper and Andrews, 1938; Miller et al., 1940; Miller et al., 2007; Penfield, 1954; Pfurtscheller, 1999). Non-rhythmic processes do not have an oscillatory timescale and do not produce isolated peaks in the power spectrum. Nonetheless, a non-rhythmic process may exhibit a distinctive spectral profile, and changes in its amplitude will produce changes in the spectrum of the electrical field (Bullock et al., 2003).
We have proposed (Miller et al., 2009b) that the broadband “1/f” background, ubiquitous in neocortical field spectra, reflects a non-rhythmic underlying process with an intuitive connection to neuronal population activity. In particular, the approximately power-law profile of the broadband component can be understood as the signature of the summation of asynchronously arriving synaptic inputs in the dendrites of pyramidal neurons (Bedard et al., 2006; Miller et al., 2009b). The dendritic summation model predicts a particular form of power-law in the spectrum above 80 Hz, and this prediction matches the empirical spectral profile to >500 Hz (once one corrects for gain-modulation in amplifier hardware).
Regardless of the details of the biophysics that produce the broadband 1/f component, it is clear that (i) the underlying process is not rhythmic and (ii) the process is strongly associated with the activation of local circuits. Behavior-locked increases in the broadband component have been demonstrated in peri-Rolandic cortex (during finger tapping) and in the occipital lobe (during visual search) via intracranial recordings from the surface of the human neocortex (Miller et al., 2010; Miller et al., 2009c). More generally, task-locked power increases in the “high gamma” band of the power spectrum (~80–200 Hz) are widely observed in mammalian cortical electrophysiology (Canolty et al., 2007; Crone et al., 2001; Crone et al., 1998a; Edwards et al., 2010; Foster et al., 2012; Gunduz et al., 2011; Hermes et al., 2012; Jacobs and Kahana, 2009; Mesgarani and Chang, 2012; Miller et al., 2007; Pei et al., 2011; Sederberg et al., 2003; Swann et al., 2009; Vidal et al., 2010). In many cases, these wide-band power shifts are probably reflective of an underlying broadband shift, especially when there is no band-limited peak observed above 80 Hz.
Direct support for the broadband model was provided by simultaneous measurements of unit activity and field potentials. Based on 2030 identified units across numerous human neocortical sites, Manning et al (Manning et al., 2009) demonstrated a positive relationship between the average firing rate of the units and the amplitude of the broadband component. Recent work in macaque visual cortex found a robust relationship between broadband high-frequency power increases and single unit activity, and was also able to separate the (non-rhythmic) high-frequency broadband effect from those attributable to (rhythmic) visual gamma (Ray and Maunsell, 2011).
Because rhythmic (band-limited) and non-rhythmic (broadband) components of the power spectrum have distinct frequency profiles and exhibit distinct task-related changes, they can be decoupled from one another (Miller et al., 2009c) (Figure 1). Once decoupling is performed, the spectrum of the electrical field can be expressed as a composite of rhythmic and non-rhythmic components (Figures 1–5). A broadband shift can then be understood as a change in the amplitude of a non-rhythmic, stochastic, process, which reflects the dendritic integration of asynchronous inputs.
Figure 1. Decoupling the cortical spectrum to reveal broadband spectral change.

Simple black-and-white pictures of faces and houses were presented to a patient while recording from an ECoG electrode on the parahippocampal gyrus. (A) Raw potential, with triggers, τq, in the middle of each stimulus and ISI period (noted with arrows, 400ms each). Times of face presentation are shown with pink background, with house presentations in blue. The gray triggers are the middle of ISI periods. (B) 1-s epochs of raw potential centered at each τq are extracted and Hann-windowed: V(τq + t)H(t). (C) The power spectrum of each of these epochs is calculated: P(f, q). (D) Each spectrum is normalized with respect to the mean spectrum across trials of all types, and the log is taken: P⌢(f, q). (E) The average power spectrum is shown for all face/house/ISI presentations in pink/blue/gray. (F) Principal spectral components, e→1, e→2, e→3 (in red, blue, and green; “PSCs”) of the normalized spectra (as in D) are identified, and reveal motifs of change in the power spectrum. The first is primarily broadband increase across all frequencies, whereas the 2nd to 4th typically capture changes in rhythmic, peaked phenomena of power spectral change. (G) Isolated broadband spectra for each stimulus type – the 2nd to 4th PSCs have been removed and the power spectra are reconstructed, and broadband increase across all frequencies is revealed during presentation of house stimuli. (H) Reconstructed power spectra of the 2nd to 4th PSCs only. Selective increase during house stimuli in the theta and high gamma range are extracted from the raw spectra and observed here. (I) The dynamic power spectral density after dividing by the average across all time, then taking the log: similar to D, but where the power spectrum is estimated at each point in time, using 7-cycle Morlet wavelets: P⌢(f, t). (J) The dynamic spectrum, P⌢(f, t), is projected into the 1st PSC, e→1, smoothed, z-scored, and exponentiated to obtain the timecourse of broadband spectral change, B(t). Comparison with stimuli reveals that the cortex beneath this electrode is involved in visual processing of both face and house stimuli, but house stimuli more dramatically than face stimuli.
Figure 5. ECoG broadband power resolves somatotopic representation of fingers.
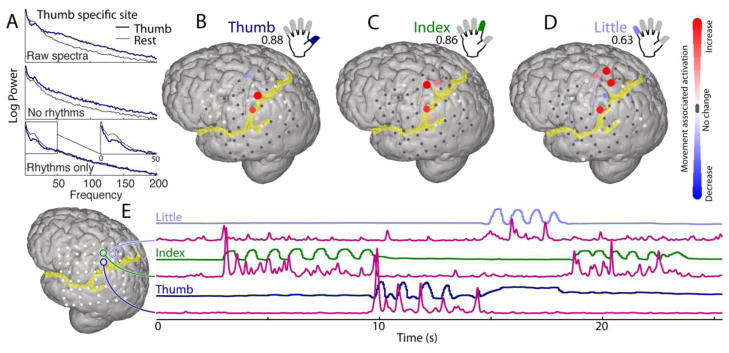
(A) Power spectral changes, raw and decoupled, during thumb movement and rest. (B–D) Changes in broadband at different cortical sites for movement of thumb, index, and little finger, are each compared with rest. Colors denote a signed r2 measurement of increases and decreases in power with movement relative to rest (individually scaled with maximum noted below each label). (C) Traces of thumb (dark blue), index (green), and little finger (light blue) flexion, with corresponding timecourse of broadband spectral change (pink) for 3 pre-central cortical sites. Note that broadband timecourse from each site is remarkably specific for the flexion of only one finger. Figure partially modified from the supplement of (Miller et al., 2012).
In this review, we begin by demonstrating that broadband shifts are a ubiquitous marker of local cortical activity, we present data from five different settings: face and house detection (inferotemporal cortex, Figure 2), visual search (peri-Calcarine cortex, Figure 3), speech production (peri-Sylvian and peri-Rolandic cortex, Figure 4), and finger tapping (peri-Rolandic cortex, Figure 5). In each setting, spatially focal shifts in broadband power are observed in a task-selective manner. We then illustrate how broadband power shifts may appear to be band-limited in certain contexts due to contamination by amplifier noise at high frequencies and masking due to the general anticorrelation of alpha and beta rhythm power at low frequencies (Figure 6).
Figure 2. Inferotemporal category-specific response.

(A) A medial (“1”) and a lateral (“2”) inferotemporal electrode are shown in situ. (B) The raw power spectral density (“Raw spectra”) from site “1” in (A) is decomposed as illustrated in Figure 1. (C) The broadband time series from each site. Note that the lateral electrode shows selective increase during face pictures, and the medial electrode shows significant response during both face and house stimuli, but with larger response for house picture stimuli. Of the 300 presentations of face and house pictures, all 300 correctly identified from the spontaneous stream of data (with 22 false positives, (Miller et al., 2009a)). The correct face or house label could be identified with 95% accuracy, with 23ms precision (23ms standard deviation).
Figure 3. Peri-calcarine broadband response during a visual search task.

(A) The ECoG potential is measured from occipital lobe brain surface sites during participation in a visual search task, and decomposed as in Figure 1. (B) The visual search task consists of a 4-by-5 array of colored squares. Each cue consists of a star in one of the boxes (in this case a blue box), and an arrow. The patient states the color of the box in the direction of the arrow from the star (“green” would be the appropriate response in this case). Visual search cues are shown for 2 seconds, with blank inter-stimulus-interval (ISI) cues shown for intervening 2 seconds. (C) As illustrated previously, power spectral changes during different portions of the experiment (top panel) may be appreciated and naively decoupled into broadband changes (middle panel, 2nd–4th PSCs omitted) and changes in brain rhythms (bottom panel, 2nd–4th PSCs only, with prominent theta and alpha range changes). (D) Broadband increases are observed during the various saccades required for processing of each cue. Figure modified from (Miller et al., 2010).
Figure 4. Language and auditory area activity during verb generation.

(A) The cortical anatomy is shown, with the non-shaded region representing the area of the exposed craniotomy, as seen in panels B and C. Yellow lines indicate the Sylvian fissure and the central sulcus. The blue dot is an electrode site in the inferior frontal gyrus (IFG) - Broca area (Brodmann area 44). The orange dot is an electrode site on the superior temporal gyrus (STG - Brodmann area 22). The white dots are the locations of the remainder of the electrode sites. (B) The locations of the electrodes are shown on the exposed brain surface, and the craniotomy with the grid in situ is also shown (C). (D) As illustrated previously, power spectral changes during different portions of the experiment (top panel) may be appreciated and naively decoupled into broadband (BB) changes (middle panel, 2nd–4th PSCs omitted) and changes in brain rhythms (bottom panel, 2nd–4th PSCs only). (E) BB timecourses from IFG (blue trace) and STG (orange trace). Simultaneous audio recording is also shown (black trace). (F) The lagged cross-correlation between BB from the two ECoG channels and the envelope of the audio trace (absolute value of the Hilbert transformed signal) shows that IFG activity (Blue site) precedes speech by 30ms, while STG activity (Orange site) follows speech by 180ms. (G) Similar comparison of cross-correlation between the IFG and STG sites shows that IFG activity leads STG activity by 280ms. (H) The temporal fidelity and the ability of the varying BB can be estimated by examining the autocorrelations of the BB from the two sites. As would be expected, the unsmoothed lnA autocorrelation falls off much faster. Panels A–C modified from (Miller et al., 2011).
Figure 6. Why “band-limited, high frequency” features may be seen in experimental data.

(A) Stereotypical time-frequency plot, with task-associated power increases observed in a wide frequency range, beginning at f = J0, extending to f = JN. (B) Shows idealized time-averaged broadband power-law spectra seen during task. (C) At high frequencies, the size of the amplifier noise floor drowns out the power in the electric potential due to cortical activity (we denote the frequency where this becomes relevant as JN). (D) At lower frequencies, the presence of co-existent synchronous rhythms obscures changes in the asynchronous broadband, and there is a crossover in power between the task and rest spectra (J0). (E) When the difference between task and rest spectra shown in (D) are plotted, it becomes clear why spectrograms have band-limited, task-associated, high frequency power changes: They are bound on the low end by J0 and the high end by JN.
Methods
Human subjects
Five patients participated in the study, one patient each is reflected in Figures 1–5. All were patients at Harborview Hospital in Seattle, WA, USA, with sub-dural electrocorticographic (ECoG) grids placed for extended clinical monitoring and localization of seizure foci, in the course of the treatment for medically-refractory epilepsy. All patients participated in a purely voluntary manner, after providing informed written consent, under a protocol approved by the Institutional Review Board of the University of Washington.
Electrocorticographic recording
The platinum electrode arrays (Ad-Tech, Racine, WI) were configured as combinations of “grid” (4×8, 8×8) and strip arrays. The electrode pads had 4 mm diameter (2.3 mm exposed), 1 cm inter-electrode distance, and were embedded in silastic. These arrays were surgically placed on the sub-dural brain surface during the treatment for epilepsy. ECoG signals were split into two identical sets. One set was fed into the clinical EEG system (XLTEK, Oakville, Ontario, Canada) and the other set was recorded with Synamps2 (Neuroscan, El Paso, TX) biosignal amplifiers at 1kHz with an instrumental bandpass-filter from 0.3 Hz to 200 Hz. ECoG signals were acquired from the experimental amplifiers using the general-purpose BCI2000 software (Schalk et al., 2004), which was also used for visual stimulus presentation. Audio was recorded using a Logitech USB desktop microphone at 11 kHz, and synchronized with a trigger in the BCI2000 program (Figure 4). Finger position was recorded using a sensor dataglove (5DT, Irvine, CA, Figure 5).
Cortical rendering and electrode localization
The relationship between electrode position and gyral anatomy was determined by first rendering the cortical surface from a pre-operative MRI, using either the freesurfer (Dale et al., 1999) or spm5 (Ashburner and Friston, 2005; Friston et al., 1995) environment. Then, electrode positions were calculated with respect to this pre-operative MRI from post-operative computed tomography (CT) using the CTMR package of Hermes, et. al., 2010 (Hermes et al., 2010), demonstrated to accurately localize the electrode positions within an error of ~4mm (the same as the size of the electrodes).
Spectral Analysis and Decomposition (Figure 1)
After rejection of artifactual or epileptiform electrodes, scalp-referenced ECoG potentials were re-referenced with respect to the common average reference across all remaining electrodes. From each electrode, samples of power spectral density (PSD; P(f, τq)) were calculated from 1 second epochs centered at the midpoint of each “events” (different for each task), τq, where a Hann taper was applied, the Fourier transform was implemented, and the resulting quantity was multiplied by it’s complex conjugate. These samples of power spectral density were then decomposed using a principal-component type approach to obtain “principal spectral components” (PSCs), as illustrated in Figure 1 and described in the associated caption. Reconstruction of the PSDs from a subset of all of the PSCs differentiates underlying motifs, and the 2nd–4th PSCs were first removed, and then examined in isolation in Figures 1–5.
Continuous time-frequency approximations (dynamic spectra) were calculated using a wavelet approach, and projected onto the 1st PSC. After smoothing (by filtering with a Gaussian window of width σ=50ms), z-scoring, and exponentiating, a “broadband time series”, B(t), is obtained. There is a power law in the cortical PSD of the form P(f, t) ~ A(t) f−χ, which is revealed by broadband fluctuations in the PSD across all frequencies (separate from the classic θ, α, β, and γ rhythmic motifs) (Miller et al., 2009b; Miller et al., 2009c), and appears to directly correlate with local neuronal population firing rate (Manning et al., 2009; Miller, 2010). We have proposed that B(t) approximates multiplicative scaling in the timecourse of the power-law coefficient, A(t), and may be directly correlated with multiplicative factor in the average neuronal firing rate of neuronal populations. This manuscript demonstrates that B(t) is highly correlated to task-specific dynamics at very short timescales, and is a general property across many brain areas.
Tasks
Face-house picture task (Figures 1 and 2)
Pictures of simple, luminance and contrast matched, grayscale faces and houses (10cm by 10cm at 1m distance) were displayed in random order for 400ms each, with 400ms inter-stimulus interval between. Patients were asked to report a simple target (a single upside-down house). “Events,” τq, were denoted at midpoint of picture presentation or each blank screen in between stimuli. Figure 2 results also quantified in (Miller et al., 2009a)
Visual search task (Figure 3)
The patient surveyed an array of colored squares (free to saccade at whim, without a fixation cross), on each trial stating the color of a box that was in a particular direction adjacent to a starred box. “Events,” τq, were denoted at midpoint of box array presentation or blank screen in between. For a full description, see (Miller et al., 2010).
Verb generation task (Figure 4)
Patients stated verbs that were connected to written nouns on a screen. “Events,” τq, were denoted at times of speech onset or silent periods in between. For a full description of the task, see (Miller et al., 2011). The data have been analyzed differently in this manuscript from the original.
Finger movement task (Figure 5)
Patients performed self-paced movements of individual fingers in response to simple visual cues. “Events,” τq, were denoted at times of peak finger displacements or points of rest. For a full description, see (Miller et al., 2012) and (Miller et al., 2009c).
Results and Discussion
Decoupling the cortical power spectrum to reveal broadband spectral changes
The decoupling approach illustrated in Figure 1 is used to identify which spectral components covary as the PSD changes over time. The covarying frequency components are referred to as motifs. The strength of the linear spectral decomposition is that it makes few assumptions regarding the underlying structure of the motifs, except that they are orthogonal. The most robust phenomenon in the PSD, seen in every motif decomposition and across five different tasks, is a broadband increase that is roughly even in magnitude across frequencies when plotted in log space (Figures 1–5). In addition, there are task-related changes in the amplitude of low frequency rhythms (usually but not always decreases), with a center frequency that varies across cortical locations.
Because the logarithm is taken prior to linear decomposition, this decoupling process assumes by construction that underlying processes are convolved in time, and therefore their individual power spectra are multiplied together at each frequency bin (this emerges from the convolution theorem). Recent results demonstrate that broadband spectral change is partially entrained on underlying rhythm phase, suggesting that this assumption is valid (Miller et al., 2012; Miller et al., 2010).
Because the low frequency rhythms do not completely decohere during tasks, there is typically residual amplitude in the peaked portions of the PSD during task engagement. The naïve mechanism used in this manuscript does not assume the form for the underlying spectral motifs, and the underlying rhythms are frequently present in the background shape of the “broadband” decoupled.
We include an illustration and description of the decoupling technique so that the reader may gain an intuitive understanding for how a broadband motif in spectral changes emerges naively. This method is important from a conceptual viewpoint because it illustrates that a ‘band-independent’ motif across many frequencies is specific for the dynamics of functionally diverse neuronal populations in different brain areas and across different tasks. From a practical viewpoint, filtering for a “high frequency band” (HFB) may capture a majority of the variance in broadband spectral change. Although the extracted broadband was demonstrated to vary with behavior more closely than with HFB changes ((Miller et al., 2009c), Supplemental material), the decoupling process is more analytically burdensome. For practical purposes, isolating HFB changes is a reasonable and appropriate approximation of the broadband change. For example, HFB power in the 76–100 Hz range approximated the broadband component of intracranial peri-Rolandic recordings ((Miller et al., 2009c), Supplemental Figure 15). However, we emphasize the specific HFB frequency range will vary depending on sites and recording systems, and should always be selected after inspecting the power spectrum for peaked rhythms and signal-to-noise characteristics. In conclusion, when interpreting HFB changes, it is essential to make the distinction between asynchronous broadband change (reflecting a population-averaged stochastic process) and synchronized rhythmic change (reflecting some kind of coherent property of cortical microcircuitry).
Linking behavior to asynchronous broadband activity across tasks and brain regions
As shown in Figures 1–5, broadband spectral change reflects selective activation of local cortical circuits across many tasks and brain areas. In Figures 1 and 2 we see that, broadband responses within the fusiform and parahippocampal gyri track the presentation of visual stimuli (such as faces and houses) on a single stimulus basis with high temporal fidelity. Furthermore, the category-specific nature of these inferotemporal loci is sufficiently robust that the stimulus category can be classified on individual trials by simple inspection of the response trace. Of the 300 presentations of face and house pictures for the patient in Figure 2, all 300 correctly identified from the spontaneous stream of data (with 22 false positives, (Miller et al., 2009a)). The correct face or house label could be identified with 95% accuracy, with 23ms precision (23ms standard deviation).
In peri-calcarine cortex (Figure 3) the broadband time series reveals an activated dynamical state during visual search, but not while resting or staring at a blank screen. Within each cue period, there are broadband fluctuations that presumably reflect individual saccades associated with gaze shifts required for the individual elements of task performance – finding the target box, making a saccade to the arrow, returning to the target, and then identifying the appropriate color.
Broadband changes also reveal the fine temporal dynamics of speech and language in frontal and temporal areas (Figure 4). An intracranial recording from Broca’s area shows broadband activity that immediately precedes speech during verb generation. Conversely, recording from a superior temporal gyral auditory site shows broadband increase following the onset of speech production. Examining the temporal cross-correlations of broadband spectral change and the speech envelope, we see that inferior frontal gyrus (IFG) activity precedes speech by 30ms, while superior temporal gyral (STG) activity follows speech by 180ms. Cross-correlation between activity from the IFG and STG sites shows that IFG leads STG activity by 280ms. The fact that 30+180<280 demonstrates that simplified cross-correlations cannot take into account complex temporal dynamics, and serve only as a first pass for interaction times between cortical areas and behavioral parameters. The cortical activity during speech at each of these cortical sites is sustained for multiple seconds (panel 4E), this 70ms discrepancy is likely explained by more complex within-trial dynamics. The falloff of the autocorrelation functions in Figure 4H suggest meaningful broadband signal change happens at well under 100ms.
Finally, as seen in the hand region of dorsal pre-central cortex, adjacent sites are highly specific for the movements of individual fingers, with minimal overlap, and robustly capture the dynamics of each individual finger flexion (Figure 5, from a larger study, detailed in (Miller et al., 2012)). Close examination of the timing between motor cortex activity and movement onset of approximately 85ms (± 39ms SD) (Miller et al., 2009c).
These data demonstrate, across five behavioral tasks and multiple cortical regions, that broadband power spectral change can be used to track local cortical activity, with meaningful resolution, at approximately the 20–50ms timescale. This suggests that broadband power changes in the ECoG potential are a generic marker of activation within populations of cortical neurons. Future studies will be required to demonstrate that broadband shifts are directly related to changes in population firing rate throughout the cerebral cortex. However, in light of the conserved geometry of superficial pyramidal neurons, this relationship is likely to extend well beyond the occipital (Ray and Maunsell, 2011), temporal (Manning et al., 2009), and somatomotor (Mollazadeh et al., 2009) areas where it has been directly confirmed.
The significance of the power law form of the broadband spectral change
As demonstrated previously, the ECoG cortical power spectral density has a power law form at high frequency, fitting tightly to P(f) ~ 1/fχ, with χ=4 (Miller et al., 2009b). If low frequency oscillations are avoided, either by selecting cortical sites where they are absent, or removing them using a principle component approach, a two-Lorentzian form is revealed. A single Lorentzian form indicates the presence of stochastic activity with a particular biophysical timescale (Miller et al., 2009b); a double Lorentzian indicates the presence of two biophysical timescales within the circuit that generates the cortical surface potential. With behavior, there is a proportional increase at each frequency, e.g. P(f, t) ~ A(t) P(f). This is important, because these two-Lorentzian forms can emerge generically from noise-like processes that have two simple correlation times (Sigeti and Horsthemke, 1987). Transmitted action potentials between neurons are approximately Poisson-distributed in time, and appear as a pure noise-like, Lorentzian, process when averaged over many neurons (Dayan and Abbott, 2001). Laminar recordings, measured alongside the surface potential, suggest that the current source densities (CSD) in different cortical lamina are due to synaptic currents and ensuing current dipoles in the dendritic tree (Mitzdorf, 1985). In contrast, propagating action potentials in axons and axon terminals do not contribute strongly to the CSD at spatial scales of ~50–300 μm, the scale where CSD varies, setting up the dipole currents which the LFPs (and by extension ECoG potentials) measure. The overall magnitude, A(t), of the measured power spectrum results from the averaging of many input action potentials to the population of neurons in the vicinity of a recording electrode. The shape of the power spectrum results from the combination of two simple known neuronal processes (each with a characteristic correlation time and resulting Lorentzian form), such as: temporal integration in dendrites or soma, exponentially decaying membrane currents, low-pass RC filtering by tissue, or local network connectivity which, when modeled, will produce precisely this form. The integer exponent of 2 in each 1/f2 term indicates an underlying stochastic process, suggesting that the ECoG signal does not resolve self-organized critical processes (which would be associated with non-integer exponents).
A simple single-neuron model for the generation of the cortical potential may provide insight into the two-Lorentzian form (Bedard et al., 2006; Miller, 2010; Miller et al., 2009b). Two biophysical processes determine the spectral form: one process is the exponentially decaying post-synaptic current of fast-synapses (decay timescale 2.3ms (Sabatini and Regehr, 1996)), and the other process is the temporal integration and leakage of polysynaptic input in the dendritic tree (leakage timescale 100ms (Koch et al., 1996)). This is only one of many models that are consistent with the measured form, but it is parsimonious and empirically grounded. Our model suggests that broadband spectral shifts generically reflect changes in the input firing rate to a local neuronal population. It may be that inputs to more superficial lamina dominate, or that pyramidal neurons have a larger contribution than interneurons, or that, in some contexts, specific frequency ranges dominate because of peculiarities of local circuitry (Buzsaki and Draguhn, 2004; Cunningham et al., 2003; Rotstein et al., 2005; Sohal et al., 2009; Steriade, 2006; Tiesinga et al., 2008). Additionally, inter-spike temporal correlations will be important at smaller spatial scales. However, the internal correlations between neuronal events are likely to be lost by averaging over large spatial areas, and the spectral changes that we measure using subdural macro-electrodes generically inform us about the overall number of events taking place in the neuronal population.
This hypothesis was tested explicitly by comparing spiking rate to both band-limited and broadband power spectral changes in human microelectrode recordings (Manning et al., 2009). The best predictor of firing rate was the broadband feature of the PSD. This relation was robust, significant, and reproduced across a large number of individuals and brain sites. Several years later, this was reproduced in non-human primates, with similar results (Ray and Maunsell, 2011), and in a setting where the broadband component was concretely distinguished from the occipital gamma rhythm.
When extracted, this broadband spectral change then reflects mean firing rate, spatially averaged over the neuronal population beneath. If the size of the electrode is made smaller, then fewer neurons are being averaged over. The resolution of cortical representation is directly tied to the electrode size and density of spacing. By intrinsically averaging over many stochastic synaptic inputs, broadband spectral change reveals a robust correlate of local cortical activity on the single trial basis, with high temporal fidelity.
Examples of genuinely rhythmic high-frequency activity
We have emphasized the ubiquity and significance of broadband power shifts, and have suggested that (apparently) band-limited spectral changes in the high-gamma range may in many cases actually reflect a broadband shift. However, there are also functionally critical processes, such as hippocampal sharp wave ripples (Buzsaki et al., 1983; Okeefe and Nadel, 1979; Ylinen et al., 1995) that have genuinely high-frequency oscillatory signatures. Other examples include the gamma rhythm in the occipital lobe, which can be observed at frequencies as high as 90 Hz (Figure 1H) (Ray and Maunsell, 2011; Womelsdorf et al., 2006) and which appear to be related to the intrinsic timescales of interneuronal activity (Traub et al., 2001).
Rhythmic and non-rhythmic processes in the high-frequency range may co-occur, if, for example, synchronization of one subpopulation co-occurs with asynchronous firing in another subpopulation of neurons. Therefore the development of tools for separating synchronous and asynchronous processes is crucial. A separation method based on power spectral covariance was illustrated in Figure 1, and other tools based on signal coarse-graining (Yamamoto and Hughson, 1993) have also been employed. It is crucial to test the performance of these methods in cases where the asynchronous broadband component deviates from its expected form (e.g. if it does not precisely follow a power law).
The implication of broadband power shifts will also vary as a function of the spatial geometry of the electrode. When recording with penetrating electrodes, sharp edges in the field potential (due, e.g., to individual action potentials) may introduce wide-band energy into the spectrum. Depending on their spectral profile, these edge-induced bursts may be difficult to distinguish from the asynchronous broadband shifts that reflect population activity (Scheffer-Teixeira et al., 2013). However, when recording with surface electrodes as in the examples shown here (Figures 1–5), the possibility of spike contamination is dramatically reduced, as the signal is aggregated across hundreds of thousands of neurons, and is dominated by currents in proximal apical dendrites (Mitzdorf, 1985).
It has been shown in a variety of behavioral settings that the amplitude of this broadband spectral change is modulated by the phase of low-frequency rhythms — a specific instance of “phase amplitude coupling” (PAC) (Miller et al., 2012; Miller et al., 2010). As such, this modulation likely re ects a macroscopic index of well-known spike- eld interaction (Buzsaki and Draguhn, 2004; Mollazadeh et al., 2009; Okun et al., 2009; Traub et al., 2001), and provides evidence that averaged spiking activity in widespread cortical circuits, reflected by this broadband, can be entrained with the phase of underlying rhythms.
How broadband changes have gained attention
More than 40 years ago, Brindley and Craggs observed that the power in the 80–250 Hz frequency range of the electric potential time series from motor cortex was dynamically and somatotopically increased in adjacent motor areas during movement (Brindley and Craggs, 1972). This finding lay obscure and dormant for more than 25 years, until Nathan Crone and colleagues independently rediscovered that the high-frequency (~75–100 Hz) portion of the human ECoG potential was highly specific for the dynamics of different motor functions (Crone et al., 1998a). Although both groups proposed that this high-frequency power was a correlate of specific cortical activity, the nature and relationship to underlying physiology was unknown. Crone’s group has more clearly postulated that very local populations of neurons were selectively synchronized with one another at multiple fast timescales, in a spatially-overlapping tableau of microdomains, with the spatial scale of coherence falling off with increasing frequency, producing a 1/f shape in the PSD (Crone et al., 2011).
However, the lack of a clear upper bound in the difference between active and inactive spectra in motor cortex led to the hypothesis (Miller et al., 2007), and later demonstration (Miller et al., 2009b; Miller et al., 2009c) that some behavior-related changes in the cortical spectrum do not correspond to synchronized populations of neurons, but are rather asynchronous and broadband in nature. As illustrated in Figure 6, these broadband spectral changes are often mistaken for band-limited changes. The broadband is obscured at lower frequencies by intersection with classic area-specific oscillations such as the α and β rhythms in visual and motor cortices (J0 in Figure 6 (Miller et al., 2008)). At high frequencies, the power in the cortically generated electrical potential falls off rapidly as P ~ 1/f4. Because all amplifiers have an intrinsic noise floor, the brain signal becomes lost in the instrument noise at an upper bound (JN in Figure 8 (Miller et al., 2009b)). When researchers observing only the 1/f correlate of local brain activity between J0 and JN, they may mistakenly refer to it as a band-limited “high-gamma power”.
Focusing on changes in particular frequency bands is practical and computationally expedient, but we suggest caution in interpreting spectral changes (especially those above 60 Hz) as changes in cortical oscillations. The oscillatory interpretation is most plausible when the high-frequency spectral shift is large and tightly band-limited, conditions which are rarely met in extra-cortical recordings. We propose that the first interpretation of a high-frequency change in the spectrum should be in terms of broadband spectral shifts. These broadband shifts, which can be characterized using the methods described above, are the signature of changes in asynchronous firing rate within local population, and they are therefore both expected and observed (Figures 1–5) in wide-ranging experimental settings. An advantage of this approach is that once a broadband shift is isolated, concurrent changes in the θ, α, β, and γ rhythms can be more readily and precisely observed.
Conclusion
Having surveyed a variety of experimental settings, we reiterate the claim that the popular “high-gamma” range of the cortical electrical potential is widely misunderstood. In most cases, changes in spectral power in this band do not reflect changes in synchronous, rhythmic, action potentials in underlying cortex. We propose that, especially for recordings outside the cortex, spectral changes in this band most often reflect changes in asynchronous activity, which has a power-law spectral signature. This power-law process, observable via broadband spectral changes during behavior, likely correlates with the mean neuronal population activity. The data indicate that this broadband spectral signature is robustly linked to function across cortical areas and behaviors, thereby generically tracking the activation of cortical populations with high temporal fidelity.
Highlights.
The ECoG power spectrum is naively decomposed into broadband and rhythmic phenomena.
Broadband ECoG has a power-law form, revealing stochastic population dynamics.
Broadband ECoG closely correlates with local cortical activity across areas and tasks.
Broadband ECoG tracks behavior at the 20–50ms timescale.
Acknowledgments
Funding: This work was supported by the generous contribution of National Aeronautics and Space Administration Graduate Student Research Program (KJM) and NIH R01-NS065186 (KJM, JGO). The funders had no role in study design, data collection and analysis, decision to publish, or preparation of the manuscript. Submitted to special issue: “New Horizons for Neural Oscillations”, Editor Michael Kahana
Footnotes
Publisher's Disclaimer: This is a PDF file of an unedited manuscript that has been accepted for publication. As a service to our customers we are providing this early version of the manuscript. The manuscript will undergo copyediting, typesetting, and review of the resulting proof before it is published in its final citable form. Please note that during the production process errors may be discovered which could affect the content, and all legal disclaimers that apply to the journal pertain.
References
- Aoki F, Fetz EE, Shupe L, Lettich E, Ojemann GA. Increased gamma-range activity in human sensorimotor cortex during performance of visuomotor tasks. Clin Neurophysiol. 1999;110:524–537. doi: 10.1016/s1388-2457(98)00064-9. [DOI] [PubMed] [Google Scholar]
- Ashburner J, Friston KJ. Unified segmentation. Neuroimage. 2005;26:839–851. doi: 10.1016/j.neuroimage.2005.02.018. [DOI] [PubMed] [Google Scholar]
- Bates JA. Electrical activity of the cortex accompanying movement. J Physiol. 1951;113:240–257. doi: 10.1113/jphysiol.1951.sp004569. [DOI] [PMC free article] [PubMed] [Google Scholar]
- Bedard C, Kroeger H, Destexhe A. Does the 1/f frequency scaling of brain signals reflect self-organized critical states? Physical review letters. 2006;97:118102. doi: 10.1103/PhysRevLett.97.118102. [DOI] [PubMed] [Google Scholar]
- Brindley GS, Craggs MD. The electrical activity in the motor cortex that accompanies voluntary movement. Proceedings of the Physiological Society. 1972:28P. [PubMed] [Google Scholar]
- Bullock TH, McClune MC, Enright JT. Are the electroencephalograms mainly rhythmic? Assessment of periodicity in wide-band time series. Neuroscience. 2003;121:233–252. doi: 10.1016/s0306-4522(03)00208-2. [DOI] [PubMed] [Google Scholar]
- Buzsaki G, Draguhn A. Neuronal oscillations in cortical networks. Science. 2004;304:1926–1929. doi: 10.1126/science.1099745. [DOI] [PubMed] [Google Scholar]
- Buzsaki G, Leung LW, Vanderwolf CH. Cellular bases of hippocampal EEG in the behaving rat. Brain Res. 1983;287:139–171. doi: 10.1016/0165-0173(83)90037-1. [DOI] [PubMed] [Google Scholar]
- Canolty RT, Soltani M, Dalal SS, Edwards E, Dronkers NF, Nagarajan SS, Kirsch HE, Barbaro NM, Knight RT. Spatiotemporal dynamics of word processing in the human brain. Front Neurosci. 2007;1:185–196. doi: 10.3389/neuro.01.1.1.014.2007. [DOI] [PMC free article] [PubMed] [Google Scholar]
- Crone NE, Hao L, Hart J, Jr, Boatman D, Lesser RP, Irizarry R, Gordon B. Electrocorticographic gamma activity during word production in spoken and sign language. Neurology. 2001;57:2045. doi: 10.1212/wnl.57.11.2045. [DOI] [PubMed] [Google Scholar]
- Crone NE, Korzeniewska A, Franaszczuk PJ. Cortical gamma responses: searching high and low. Int J Psychophysiol. 2011;79:9–15. doi: 10.1016/j.ijpsycho.2010.10.013. [DOI] [PMC free article] [PubMed] [Google Scholar]
- Crone NE, Miglioretti DL, Gordon B, Lesser RP. Functional mapping of human sensorimotor cortex with electrocorticographic spectral analysis. II. Event-related synchronization in the gamma band. Brain. 1998a;121 (Pt 12):2301–2315. doi: 10.1093/brain/121.12.2301. [DOI] [PubMed] [Google Scholar]
- Crone NE, Miglioretti DL, Gordon B, Sieracki JM, Wilson MT, Uematsu S, Lesser RP. Functional mapping of human sensorimotor cortex with electrocorticographic spectral analysis. I. Alpha and beta event-related desynchronization. Brain. 1998b;121 (Pt 12):2271–2299. doi: 10.1093/brain/121.12.2271. [DOI] [PubMed] [Google Scholar]
- Cunningham MO, Davies CH, Buhl EH, Kopell N, Whittington MA. Gamma oscillations induced by kainate receptor activation in the entorhinal cortex in vitro. J Neurosci. 2003;23:9761–9769. doi: 10.1523/JNEUROSCI.23-30-09761.2003. [DOI] [PMC free article] [PubMed] [Google Scholar]
- Dale AM, Fischl B, Sereno MI. Cortical surface-based analysis. I. Segmentation and surface reconstruction. Neuroimage. 1999;9:179–194. doi: 10.1006/nimg.1998.0395. [DOI] [PubMed] [Google Scholar]
- Dayan P, Abbott LF. Theoretical neuroscience: computational and mathematical modeling of neural systems. Massachusetts Institute of Technology Press; Cambridge, Mass: 2001. [Google Scholar]
- Edwards E, Nagarajan SS, Dalal SS, Canolty RT, Kirsch HE, Barbaro NM, Knight RT. Spatiotemporal imaging of cortical activation during verb generation and picture naming. Neuroimage. 2010;50:291–301. doi: 10.1016/j.neuroimage.2009.12.035. [DOI] [PMC free article] [PubMed] [Google Scholar]
- Foster BL, Dastjerdi M, Parvizi J. Neural populations in human posteromedial cortex display opposing responses during memory and numerical processing. Proc Natl Acad Sci U S A. 2012;109:15514–15519. doi: 10.1073/pnas.1206580109. [DOI] [PMC free article] [PubMed] [Google Scholar]
- Friston KJ, Holmes AP, Worsley KJ, Poline JB, Frith CD, Frackowiak RSJ. Statistical parametric maps in functional imaging: a general linear approach. Human brain mapping. 1995;2:189–210. [Google Scholar]
- Gunduz A, Brunner P, Daitch A, Leuthardt EC, Ritaccio AL, Pesaran B, Schalk G. Neural correlates of visual-spatial attention in electrocorticographic signals in humans. Front Hum Neurosci. 2011;5:89. doi: 10.3389/fnhum.2011.00089. [DOI] [PMC free article] [PubMed] [Google Scholar]
- Hermes D, Miller KJ, Noordmans HJ, Vansteensel MJ, Ramsey NF. Automated electrocorticographic electrode localization on individually rendered brain surfaces. Journal of neuroscience methods. 2010;185:293–298. doi: 10.1016/j.jneumeth.2009.10.005. [DOI] [PubMed] [Google Scholar]
- Hermes D, Miller KJ, Vansteensel MJ, Aarnoutse EJ, Leijten FS, Ramsey NF. Neurophysiologic correlates of fMRI in human motor cortex. Hum Brain Mapp. 2012;33:1689–1699. doi: 10.1002/hbm.21314. [DOI] [PMC free article] [PubMed] [Google Scholar]
- Jacobs J, Kahana MJ. Neural representations of individual stimuli in humans revealed by gamma-band electrocorticographic activity. J Neurosci. 2009;29:10203–10214. doi: 10.1523/JNEUROSCI.2187-09.2009. [DOI] [PMC free article] [PubMed] [Google Scholar]
- Jasper H, Penfield W. Electrocorticograms in man: effect of voluntary movement upon the electrical activity of the precentral gyrus. European Archives of Psychiatry and Clinical Neuroscience. 1949;183:163–174. [Google Scholar]
- Jasper HH. Electrical activity of the brain. Annual Review of Physiology. 1941;3:377–398. [Google Scholar]
- Jasper HH, Andrews HL. Brain potentials and voluntary muscle activity in man. Journal of Neurophysiology. 1938;1:87. [Google Scholar]
- Koch C, Rapp M, Segev I. A brief history of time (constants) Cereb Cortex. 1996;6:93–101. doi: 10.1093/cercor/6.2.93. [DOI] [PubMed] [Google Scholar]
- Manning JR, Jacobs J, Fried I, Kahana MJ. Broadband shifts in local field potential power spectra are correlated with single-neuron spiking in humans. Journal of Neuroscience. 2009;29:13613. doi: 10.1523/JNEUROSCI.2041-09.2009. [DOI] [PMC free article] [PubMed] [Google Scholar]
- Mesgarani N, Chang EF. Selective cortical representation of attended speaker in multi-talker speech perception. Nature. 2012;485:233–236. doi: 10.1038/nature11020. [DOI] [PMC free article] [PubMed] [Google Scholar]
- Miller FR, Stavraky GW, Woonton GA. Effects of eserine, acetylcholine and atropine on the electrocorticogram. Journal of Neurophysiology. 1940;3:131. [Google Scholar]
- Miller KJ. Broadband spectral change: evidence for a macroscale correlate of population firing rate? J Neurosci. 2010;30:6477–6479. doi: 10.1523/JNEUROSCI.6401-09.2010. [DOI] [PMC free article] [PubMed] [Google Scholar]
- Miller KJ, Abel TJ, Hebb AO, Ojemann JG. Rapid online language mapping with electrocorticography. Journal of Neurosurgery: Pediatrics. 2011;7 doi: 10.3171/2011.2.PEDS1156. [DOI] [PMC free article] [PubMed] [Google Scholar]
- Miller KJ, Hermes D, Honey CJ, Hebb AO, Ramsey NF, Knight RT, Ojemann JG, Fetz EE. Human motor cortical activity is selectively phase-entrained on underlying rhythms. PLoS Comput Biol. 2012;8:e1002655. doi: 10.1371/journal.pcbi.1002655. [DOI] [PMC free article] [PubMed] [Google Scholar]
- Miller KJ, Hermes D, Honey CJ, Sharma M, Rao RP, den Nijs M, Fetz EE, Sejnowski TJ, Hebb AO, Ojemann JG, Makeig S, Leuthardt EC. Dynamic modulation of local population activity by rhythm phase in human occipital cortex during a visual search task. Front Hum Neurosci. 2010;4:197. doi: 10.3389/fnhum.2010.00197. [DOI] [PMC free article] [PubMed] [Google Scholar]
- Miller KJ, Hermes D, Schalk G, Ramsey NF, Jagadeesh B, den Nijs M, Ojemann JG, Rao RP. Detection of spontaneous class-specific visual stimuli with high temporal accuracy in human electrocorticography. IEEE Eng Med Biol Soc. 2009a;2009:6465–6468. doi: 10.1109/IEMBS.2009.5333546. [DOI] [PubMed] [Google Scholar]
- Miller KJ, Leuthardt EC, Schalk G, Rao RP, Anderson NR, Moran DW, Miller JW, Ojemann JG. Spectral changes in cortical surface potentials during motor movement. J Neurosci. 2007;27:2424–2432. doi: 10.1523/JNEUROSCI.3886-06.2007. [DOI] [PMC free article] [PubMed] [Google Scholar]
- Miller KJ, Shenoy P, den Nijs M, Sorensen LB, Rao RN, Ojemann JG. Beyond the gamma band: the role of high-frequency features in movement classification. IEEE transactions on biomedical engineering. 2008;55:1634. doi: 10.1109/TBME.2008.918569. [DOI] [PubMed] [Google Scholar]
- Miller KJ, Sorensen LB, Ojemann JG, den Nijs M. Power-law scaling in the brain surface electric potential. PLoS Comput Biol. 2009b;5:e1000609. doi: 10.1371/journal.pcbi.1000609. [DOI] [PMC free article] [PubMed] [Google Scholar]
- Miller KJ, Zanos S, Fetz EE, den Nijs M, Ojemann JG. Decoupling the Cortical Power Spectrum Reveals Real-Time Representation of Individual Finger Movements in Humans. Journal of Neuroscience. 2009c;29:3132. doi: 10.1523/JNEUROSCI.5506-08.2009. [DOI] [PMC free article] [PubMed] [Google Scholar]
- Mitzdorf U. Current Source-Density Method and Application in Cat Cerebral-Cortex - Investigation of Evoked-Potentials and Eeg Phenomena. Physiological Reviews. 1985;65:37–100. doi: 10.1152/physrev.1985.65.1.37. [DOI] [PubMed] [Google Scholar]
- Mollazadeh M, Aggarwal V, Thakor NV, Law AJ, Davidson A, Schieber MH. Coherency between Spike and LFP Activity in M1 during Hand Movements. Neural Engineering, 2009. NER ‘09. 4th International IEEE/EMBS Conference on; 2009. pp. 506–509. [Google Scholar]
- Okeefe J, Nadel L. The Hippocampus as a Cognitive Map. Behavioral and Brain Sciences. 1979;2:520–528. [Google Scholar]
- Okun M, Naim A, Lampl I. Intracellular recordings in awake rodent unveil the relation between local field potential and neuronal firing. Society for Neuroscience; Chicago, IL, USA: 2009. [DOI] [PMC free article] [PubMed] [Google Scholar]
- Pei X, Barbour DL, Leuthardt EC, Schalk G. Decoding vowels and consonants in spoken and imagined words using electrocorticographic signals in humans. J Neural Eng. 2011;8:046028. doi: 10.1088/1741-2560/8/4/046028. [DOI] [PMC free article] [PubMed] [Google Scholar]
- Penfield W. Mechanisms of voluntary movement. Brain. 1954;77:1. doi: 10.1093/brain/77.1.1. [DOI] [PubMed] [Google Scholar]
- Pfurtscheller G. Event-Related Desynchronization (ERD) and Event Related Synchronization (ERS) Williams and Wilkins; Baltimore: 1999. [Google Scholar]
- Ray S, Maunsell JH. Different origins of gamma rhythm and high-gamma activity in macaque visual cortex. PLoS Biol. 2011;9:e1000610. doi: 10.1371/journal.pbio.1000610. [DOI] [PMC free article] [PubMed] [Google Scholar]
- Rotstein HG, Pervouchine DD, Acker CD, Gillies MJ, White JA, Buhl EH, Whittington MA, Kopell N. Slow and fast inhibition and an H-current interact to create a theta rhythm in a model of CA1 interneuron network. J Neurophysiol. 2005;94:1509–1518. doi: 10.1152/jn.00957.2004. [DOI] [PubMed] [Google Scholar]
- Sabatini BL, Regehr WG. Timing of neurotransmission at fast synapses in the mammalian brain. Nature. 1996;384:170–172. doi: 10.1038/384170a0. [DOI] [PubMed] [Google Scholar]
- Schalk G, McFarland DJ, Hinterberger T, Birbaumer N, Wolpaw JR. BCI2000: a general-purpose brain-computer interface (BCI) system. IEEE Trans Biomed Eng. 2004;51:1034–1043. doi: 10.1109/TBME.2004.827072. [DOI] [PubMed] [Google Scholar]
- Scheffer-Teixeira R, Belchior H, Leao RN, Ribeiro S, Tort AB. On high-frequency field oscillations (>100 Hz) and the spectral leakage of spiking activity. J Neurosci. 2013;33:1535–1539. doi: 10.1523/JNEUROSCI.4217-12.2013. [DOI] [PMC free article] [PubMed] [Google Scholar]
- Sederberg PB, Kahana MJ, Howard MW, Donner EJ, Madsen JR. Theta and gamma oscillations during encoding predict subsequent recall. J Neurosci. 2003;23:10809–10814. doi: 10.1523/JNEUROSCI.23-34-10809.2003. [DOI] [PMC free article] [PubMed] [Google Scholar]
- Sigeti D, Horsthemke W. High-Frequency Power Spectra for Systems Subject to Noise. Physical Review A. 1987;35:2276–2282. doi: 10.1103/physreva.35.2276. [DOI] [PubMed] [Google Scholar]
- Sohal VS, Zhang F, Yizhar O, Deisseroth K. Parvalbumin neurons and gamma rhythms enhance cortical circuit performance. Nature. 2009;459:698–702. doi: 10.1038/nature07991. [DOI] [PMC free article] [PubMed] [Google Scholar]
- Steriade M. Grouping of brain rhythms in corticothalamic systems. Neuroscience. 2006;137:1087–1106. doi: 10.1016/j.neuroscience.2005.10.029. [DOI] [PubMed] [Google Scholar]
- Swann N, Tandon N, Canolty R, Ellmore TM, McEvoy LK, Dreyer S, DiSano M, Aron AR. Intracranial EEG reveals a time- and frequency-specific role for the right inferior frontal gyrus and primary motor cortex in stopping initiated responses. J Neurosci. 2009;29:12675–12685. doi: 10.1523/JNEUROSCI.3359-09.2009. [DOI] [PMC free article] [PubMed] [Google Scholar]
- Tiesinga P, Fellous JM, Sejnowski TJ. Regulation of spike timing in visual cortical circuits. Nat Rev Neurosci. 2008;9:97–107. doi: 10.1038/nrn2315. [DOI] [PMC free article] [PubMed] [Google Scholar]
- Traub RD, Kopell N, Bibbig A, Buhl EH, LeBeau FEN, Whittington MA. Gap junctions between interneuron dendrites can enhance synchrony of gamma oscillations in distributed networks. Journal of Neuroscience. 2001;21:9478–9486. doi: 10.1523/JNEUROSCI.21-23-09478.2001. [DOI] [PMC free article] [PubMed] [Google Scholar]
- Vidal JR, Ossandon T, Jerbi K, Dalal SS, Minotti L, Ryvlin P, Kahane P, Lachaux JP. Category-Specific Visual Responses: An Intracranial Study Comparing Gamma, Beta, Alpha, and ERP Response Selectivity. Front Hum Neurosci. 2010;4:195. doi: 10.3389/fnhum.2010.00195. [DOI] [PMC free article] [PubMed] [Google Scholar]
- Whittingstall K, Logothetis NK. Frequency-band coupling in surface EEG reflects spiking activity in monkey visual cortex. Neuron. 2009;64:281–289. doi: 10.1016/j.neuron.2009.08.016. [DOI] [PubMed] [Google Scholar]
- Womelsdorf T, Fries P, Mitra PP, Desimone R. Gamma-band synchronization in visual cortex predicts speed of change detection. Nature. 2006;439:733–736. doi: 10.1038/nature04258. [DOI] [PubMed] [Google Scholar]
- Yamamoto Y, Hughson RL. Extracting Fractal Components from Time-Series. Physica D. 1993;68:250–264. [Google Scholar]
- Ylinen A, Bragin A, Nadasdy Z, Jando G, Szabo I, Sik A, Buzsaki G. Sharp wave-associated high-frequency oscillation (200 Hz) in the intact hippocampus: network and intracellular mechanisms. J Neurosci. 1995;15:30–46. doi: 10.1523/JNEUROSCI.15-01-00030.1995. [DOI] [PMC free article] [PubMed] [Google Scholar]