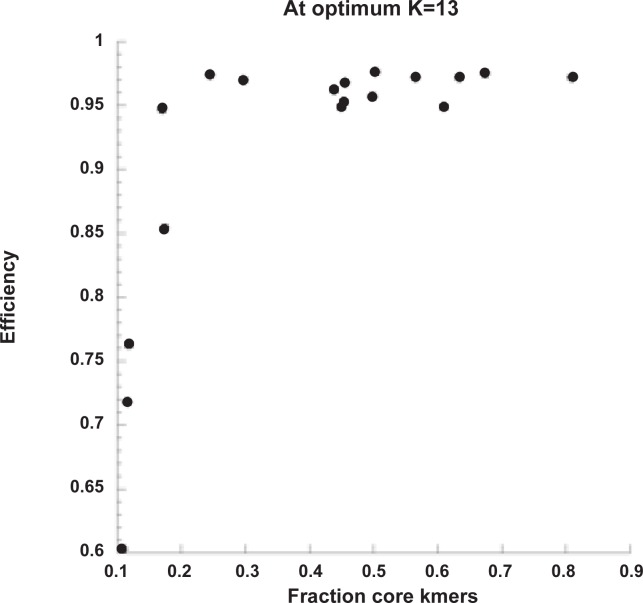
As the result of a bug in Kchooser, values of Fraction of Core kmers (FCK) were under-calculated by about a factor of two. As a result, the following sections of the paper were affected. The authors have uploaded a bug-fix version of Kchooser to SourceForge (https://sourceforge.net/projects/ksnp), along with an explanation of the issue.
In the Results and Discussion section, under the “Kchooser, a program to select an optimal k” subsection, there is an error in the third to final sentence and the second to final sentence. In the third to final sentence, “≥0.1” should read “>0.2.” In the second to final sentence, “-0.14029–0.19177log(Branch length), R = 0.99246” should read “-0.24507–0.34278 log(Branch length), R = 0.99265.” The correct sentences are as follow: “Based on these simulations it seems likely that when the fraction of core kmers is >0.2 over 90% of the SNPs will be identified by kSNP. At the optimum k = 13, the fraction of core kmers decreases very regularly as branch length (sequence variation) increases: Fraction of core kmers = -0.24507–0.34278 log(Branch length), R = 0.99265.”
Also in the Results and Discussion section, under the “Consequences of choosing a larger than optimal value of k” subsection, there is an error in the first and third sentences. The number 0.1 should read 0.2. The correct first sentence is as follows: “Table 1 shows that for all of the viral genomes, and for the Acinetobacter genomes, at the optimum value of k the fraction of core kmers is well below 0.2, suggesting that a substantial fraction of the SNPs have not been detected.” The correct third sentence is as follows: “When the fraction of core kmers is below 0.2, there is a risk of missing a significant fraction of the SNPs.”
Table 1. Optimum values of k for the examples in Table 2.
| Target Set | Optimum K | Fraction core kmersat optimum K |
|---|---|---|
| Example 1 1 | 13 | 0.124 |
| Example 2 2 | 21 | 0.666 |
| Filoviridae family | 15 | 0.128 |
| Rabies Lyssavirus | 13 | 0.146 |
| Rhabdoviridae family | 13 | 0.030 |
| Acinetobacter | 19 | 0.021 |
| Escherichia coli O104:H4 clade | 19 | 0.793 |
| Escherichia coli-Shigella 68 finished genomes | 19 | 0.525 |
| Escherichia coli-Shigella including O104:H4 strains from European outbreak | 19 | 0.522 |
1Example 1 data set (provided with kSNP) consists of 11 equine encephalitis virus finished genomes.
2Example 2 data set provided with kSNP consists of 7 finished, 5 assembled and 2 raw read E. coli genomes.
Additionally, there are errors in the “Fraction core kmers at optimum K” column of Table 1. Please view the correct Table 1 below.
Further, Fig. 3 is incorrect. Please view the correct Fig. 3 here.
Fig. 3. kSNP efficiency vs the fraction of core kmers in simulated data sets.
Reference
- 1. Gardner SN, Hall BG (2013) When Whole-Genome Alignments Just Won’t Work: kSNP v2 Software for Alignment-Free SNP Discovery and Phylogenetics of Hundreds of Microbial Genomes. PLoS ONE 8(12): e81760 doi: 10.1371/journal.pone.0081760 [DOI] [PMC free article] [PubMed] [Google Scholar]


