

Abstract
Background
Deep Brain Stimulation (DBS) of the globus pallidus interna (GPi) is established as efficacious for dystonia yet the optimal target within this structure is not well defined. Published evidence suggests that spatial normalization provides a better estimate of DBS lead location than traditional methods based on standard stereotactic coordinates.
Methods
We retrospectively reviewed our pallidal implanted dystonia population. Patient imaging scans were morphed into an MRI atlas using a non-linear image registration algorithm. Active contact locations were projected onto the atlas and clusters analyzed for the degree of variance in two groups: 1) good and poor responders and 2) cervical (CD) and generalized dystonia (GD).
Results
Average active contact location between CD and GD good responders was distinct but not significantly different. Mean active contact for CD poor responders was significantly different from CD responders and GD poor responders in the dorsoventral direction.
Conclusions
A normalized imaging space is arguably more accurate in visualizing postoperative leads. Despite some separation between groups, this data suggests there was not an optimal pallidal target for common dystonia patients. Degrees of variance overlapped due to a large degree of individual target variation. Patient selection may ultimately be the key to maximizing patient outcomes.
Keywords: Dystonia, Deep brain stimulation, globus pallidus, functional atlas, brain mapping
Introduction
Dystonia is commonly seen in movement disorder clinics, occurring in a variety of phenotypic and pathophysiologic forms either as an isolated symptom or in combination with more complex phenomenology [1-2]. It can be difficult to treat pharmacologically and can sometimes be refractory to botulinum toxin injections [3-5]. Deep brain stimulation (DBS) is an alternative surgical modality that has demonstrated pronounced benefit in treating some types of dystonia [6-9].
It is generally accepted that posterolateroventral placement of electrodes in the sensorimotor part of the globus pallidus interna (GPi) is ideal [10-12]. This area has been favored due to ablative surgery data from the 1950's, and the efficacy of both DBS and pallidotomy in Parkinson's disease [13]. However, this location is relatively large with little consistent published data to support an optimal lead location [14]. One study looking at pallidal DBS outcomes found variable clinical response in dystonia patients. This was irrespective of mean lead location when comparing lead location in relation to GPi borders in both good and bad responders [12]. Another study looked at active contact location in Parkinson's disease, cervical dystonia and generalized dystonia patients who had undergone bilateral GPi DBS. The investigators found that active contacts were similarly placed among groups and that exact placement of the electrodes as measured by various landmarks and borders of the GPi had no significant bearing on clinical outcome [15]. Vayssiere et al did find some differences in the anterior-posterior direction in terms of optimal target location of the right lead in bilaterally implanted dystonia patients depending on the predominant anatomical location of the patient's dystonia [11]. Finally, Cheung et al recently used computational models looking at volumes of tissue activation retrospectively in implanted DYT1 generalized dystonia patients. While there was a broad area of stimulation, they did find a smaller area of overlap indicating a possible more defined target location [14].
There are no known studies using a functional atlas in a multipatient normalized space to assess the optimal pallidal DBS target location for dystonia. Non-linear normalization provides a truer estimate of the postoperative anatomical location of DBS leads as opposed to more conventional approaches that rely on an anterior-posterior commissure coordinate system [16]. Termed CRAVE, our center employs such an atlas to assist with preoperative, perioperative and postoperative care. We have previously demonstrated the accuracy of this method based on predictions of anatomical landmarks as well as by correlating statistical maps of electrophysiological data with underlying anatomy [16-17]. In this study, we used this technique in a large portion of our pallidal implanted dystonia population in attempts to better identify the optimal target location within the GPi for cervical (CD) and generalized dystonia (GD). Good and poor responders as determined by six month post-operative data were compared. Given literature that patient selection and patient characteristics may also influence clinical outcomes, in depth chart review was employed.
Methods
We conducted an IRB approved retrospective review of the pallidal implanted DBS CD and GD population at Vanderbilt University from January, 1996 until June, 2011. DBS surgeries were performed using a miniature stereotactic frame, the microTargeting platform® (FHC, Inc., Bowdoin, ME), and a multipass approach for microelectrode recording and microstimulation. Details of this center's surgical technique have been published elsewhere [18-19]. The GPi was targeted using general parameters from the mid-commissural point at 17-20 mm lateral, 0-3 mm anterior and 0-3 mm inferior. The planned target was in the posteroventral aspect of the GPi just superior to the optic tract. Surgeries were performed by two functional neurosurgeons well experienced with DBS.
Candidates were identified from records of pallidal DBS implanted dystonia patients at our center during the aforementioned time period who had appropriate preoperative MRIs, pre and postoperative CTs, and at least six months of programming follow-up. Typical CT images were acquired at kVp = 120 V, exposure = 350 mAs and 512×512 pixels. In-plane resolution and slice thickness were respectively 0.5 mm and 0.75 mm. MRI images (TR 12.2 ms, TE 2.4 ms, 256×256×170 voxels, with typical voxel resolution of 1×1×1 mm3) were acquired using the SENSE parallel imaging technique (T1W/3D/TFE) on a Philips 3T scanner. The Toronto Western Spasmodic Torticollis Rating Scale (TWSTRS), Burke-Fahn-Marsden (BFM) and the Clinical Global impression score (CGI) were used to assess dystonia severity and change in clinical outcome post-operatively. The TWSTRS and BFM were performed by the same rater preoperatively. CGI scores were determined by the treating physician.
CGI scores were the primary marker of clinical change after surgery given the unavailability of TWSTRS and BFM postoperative scores in all patients. A score of 1-2 defined a good responder and 3-7 a poor responder. On the CGI scale, a 3 equates to minimal response and a 4 to no response. Scores above 3 are progressively more efficacious responses and scores below 4 are progressively more negative responses. Individual patients were also separated into cervical and generalized dystonia. These diagnoses were taken from the treating movement disorder specialists' expert opinion as documented in the chart and confirmed on video review by the PI. This created four distinct groups for analysis: CD good, CD poor, GD good and GD poor. Imaging data from the selected patients were inputted into the functional atlas and visualized into a normalized MRI volume. Details of our atlas system as well as the registration process of patient data have been previously described [20]. Briefly, for each patient, the leads and individual contacts were extracted using a fully automatic algorithm. Then, the pre-operative CT was registered to the pre-operative MRI using an automatic mutual information based rigid registration process, and the pre-operative MRI was registered to the atlas MRI using a non-linear image registration process [17, 20]. The locations of the electrodes and the individual contacts were extracted from the lead identified in the post-operative CT. Using the transformations described above, the locations of active contacts from the patients were next mapped onto the atlas or normalized imaging space. This normalized space was visualized as MRI images that could be analyzed both in 2D and 3D space.
Forty-six dystonia patients were found from this time period whose data had been placed in our functional atlas. Six patients did not have CD or GD so were withheld. Fifteen patients, including two excluded for more rarely implanted dystonia, were removed due to inadequate imaging data not compatible with the current software. Ultimately, twenty-seven patients were included in this study. Patient characteristics deemed pertinent given literature referencing patient attributes that possibly influenced clinical outcome were obtained from medical records [21-28]. These variables included medical comorbidities (diabetes, hypertension, hyperlipidemia, chronic obstructive pulmonary disease, coronary artery disease), DYT1 genetic testing, primary (e.g. no known neurodegenerative disorder, cerebral palsy or other initiating cause as well as no basal ganglia changes on MRI) vs secondary, fixed skeletal deformities, dystonia duration, demographic information, TWSTRS score or BFM preoperative score, fixed (defined as “fixed” if 5's on duration subscale on TWSTRS or multiple recorded 4's on the BFM that was confirmed by visual assessment of the patient's testing video) versus dynamic presentation, operating surgeon and time of surgery.
Investigators computed the centroid or mean location of the active contact of the group clusters in X,Y,Z space as measured from the anterior-posterior commissure mid-commissural point as well as the standard deviation or variance of the group clusters. This was done both for the left and right side separately as well as for an overall average of both sides. When more than one active contact was present in individual patients, the cathode was selected as the active contact in bipolar configurations and the average cathode in instances of double or triple monopolar configurations. Statistical differences in centroid parameters were calculated using independent t tests. An ANOVA with a Bonferroni correction for multiple comparisons was used to assess differences in patient characteristics amongst groups when analyzing continuous data. Fisher's exact test was performed on all categorical data of patient characteristics. The exact test was not adjusted for multiple comparisons. Individual groups were compared against the rest of the sample population. All statistics were performed using Stata/IC 12.0 software.
Results
Twenty-seven patients (53 leads) were included in this analysis. With the exception of one unilateral placement for CD, all were bilateral implants. All implants were simultaneously placed with one exception where leads were placed one week apart. There were 9 CD good responders (one patient had the unilateral implant) and 4 CD poor responders. There were 7 GD good and 7 poor responders. Patient imaging data was collected and aligned into a normalized space. The illustration below depicts all patients' individual active contacts in normalized space on the 2D MRI image (Figure 1). Figure 2 depicts the patients divided into CD and GD as well as good versus bad responders in 3D. There is some clustering, especially in CD good vs poor responders. However, active contacts were noted to be distributed across a wide area in the posterolateroventral aspect of the rendered GPI, especially in the cumulative map (Figure 1) and the GD map (Figure 2b). The underlying GPi segmentation was created by individually tracing the outlines of the GPi in our MRI atlas.
Figure 1.
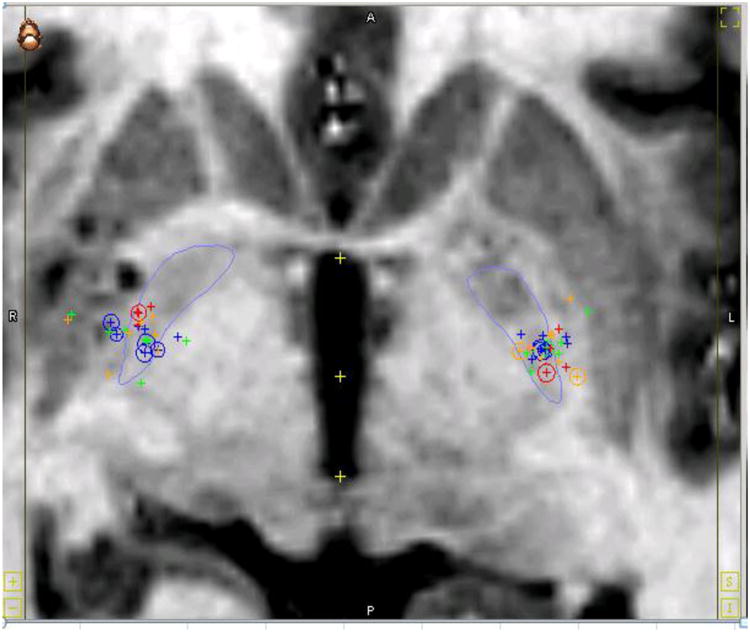
Active Contact Location of all Dystonia Patients. This coronal MRI image shows the active contacts of all study participants in 2D within a normalized space. Legend: Large outline of globus pallidus is in blue. Cervical dystonia good responders = blue. Generalized good responders = green. Cervical dystonia poor responders = red. Generalized poor responders = yellow. The circles are the actual points on the 2D MRI whereas the pluses are projections of the points lying in other slices.
Figure 2.
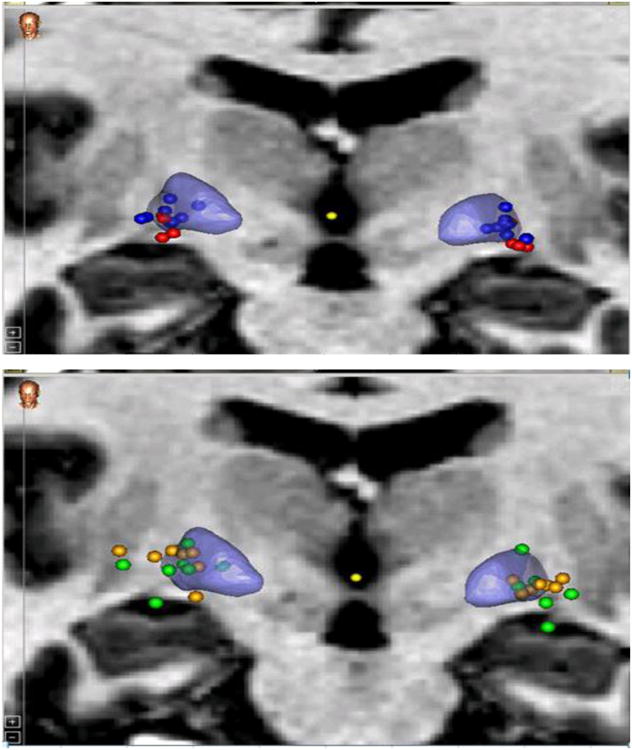
Comparison of Active Contact Location Among Dystonia Groups. These two coronal MRI images illustrate the comparative locations of the active contacts of study participants between groups. These are presented in 3D within a normalized space. Top (a): Good vs Poor Cervical Responders Bottom (b): Good vs poor General Dystonia Responders. Legend: 3D representation of globus pallidus is in blue. Cervical dystonia good responders=blue circles. Generalized good responders=green circles. Cervical dystonia poor responders=red circles. Generalized poor responders=yellow circles.
Centroids and degrees of variance of the active contacts in each of the groups are depicted in Table 1. Coordinates were reported as lateral, anterior and inferior which are the X, Y and Z coordinates respectively. There was some separation of the centroids among groups but rarely was this statistically significant. The only statistically significant finding was that, inferiorly, the CD good and CD poor as well as CD poor and GD poor groups had notable separation (p=0.0084 and p=0.0024). Still, it should be noted the CD good (22.52 mm, 2.69 mm, 1.04 mm) seemed distinct from the GD good (23.32 mm, 2.40 mm, 1.45 mm). Also, when comparing CD good vs. CD poor and Gen good versus Gen poor, there were pronounced differences, most notably inferiorly (1.04 mm versus 3.30 mm and 1.45 mm versus 0.33 mm). Variances were large at all points, indicating a fairly wide spread distribution of individual target locations and eliminating the chance for much statistical significance. This can be seen again in Figure 1 and 2.
Table 1.
Coordinates of Average Contact Location. The table depicts the target coordinates of the centroids and degrees of variance of the good and poor responders in both the cervical and generalized dystonia groups.
| DYSTONIA TYPE | LEFT (mm) | RIGHT (mm) | Average of Both Sides (mm) | ||||||
|---|---|---|---|---|---|---|---|---|---|
| N = 9, L = 17 | |||||||||
| CD Good | Lateral | Anterior | Inferior | Lateral | Anterior | Inferior | Lateral | Anterior | Inferior |
| Centroid | 22.82 | 2.28 | 2.19 | 22.23 | 3.11 | -0.11 | 22.52 | 2.69 | 1.04 |
| Std | 1.66 | 0.88 | 1.87 | 2.40 | 1.15 | 1.60 | 2.03 | 1.02 | 1.73 |
|
| |||||||||
| N = 7, L = 14 | |||||||||
| GD Good | Lateral | Anterior | Inferior | Lateral | Anterior | Inferior | Lateral | Anterior | Inferior |
| Centroid | 23.30 | 2.02 | 3.35 | 23.33 | 2.78 | -0.46 | 23.32 | 2.40 | 1.45 |
| Std | 2.48 | 1.88 | 3.97 | 3.99 | 2.19 | 2.96 | 3.23 | 2.04 | 3.46 |
|
| |||||||||
| N = 4, L = 8 | |||||||||
| CD poor | Lateral | Anterior | Inferior | Lateral | Anterior | Inferior | Lateral | Anterior | Inferior |
| Centroid | 24.03 | 1.29 | 4.55 | 22.39 | 5.47 | 2.05 | 23.21 | 3.38 | 3.30 |
| Std | 1.00 | 2.07 | 2.09 | 0.72 | 0.84 | 1.99 | 0.86 | 1.45 | 2.04 |
|
| |||||||||
| N = 7, L = 14 | |||||||||
| GD poor | Lateral | Anterior | Inferior | Lateral | Anterior | Inferior | Lateral | Anterior | Inferior |
| Centroid | 23.43 | 2.06 | 2.44 | 23.58 | 3.18 | -1.79 | 23.51 | 2.62 | 0.33 |
| Std | 2.31 | 2.60 | 0.85 | 3.68 | 2.16 | 2.89 | 3.00 | 2.38 | 1.87 |
Legend: N=patient number, L=lead number, Average of Both Sides=Average of both sides' coordinates as measured from the mid-commissural point, CD=cervical dystonia, GD=generalized dystonia, Good=Good responder, Poor=poor responder. Units in millimeters (mm). Lateral=X plane, Anterior= Y plane, Inferior=Z plane.
Demographic and surgical data on patient characteristics of interest were listed in Table 2. Genetic testing of DBS candidates is not common practice at our center and not included in analysis. Of the six patients who had undergone genetic testing, only one patient was positive for DYT1 and was represented in the GD good responder group. Most variables were not significantly different between groups but there were a few differences of note. The GD poor responder group contained a high number of the secondary dystonia participants (83%, p=0.001). 72% (5/7) of the GD poor responders were secondary dystonias. Age at diagnosis was significant between groups (p=0.0016) with a test of multiple comparisons revealing that GD good and GD bad were both individually different from the two CD groups. GD poor responders (18.43±26.79 years) were the youngest and CD poor responders were the oldest (57.86±7.82 years). CD good responders had the shortest duration of symptoms (6.11±3.35 years) whereas GD good responders had the longest (23.91±17.14), significant at p=0.013. Finally, age at surgery was significant between the two poor responder groups (p=0.053).
Table 2.
Dystonia Demographic Data. The table depicts characteristics of the good and poor responders in both the cervical and generalized dystonia groups.
| Variable | CD good (n=9) | CD poor (n=4) | GD good (n=7) | GD poor (n=7) |
|---|---|---|---|---|
| Gender M=male F=female |
M=2 F=7 (p=0.41) |
M=1 F=3 (p=1.0) |
M=3 F=4 (p=1.0) |
M=4 F=3 (p=0.37) |
| Surgeon S1=Surgeon 1 S2=Surgeon 2 |
S1=4 S2=5 (p=0.7) |
S1=2 S2=2 (p=1.0) |
S1=4 S2=3 (p=1.0) |
S1=4 S2=3 (p=1.0) |
| Primary vs Secondary | Primary=8 Secondary=1 (p=0.63) |
Primary=4 Secondary=0 (p=0.55) |
Primary=7 Secondary=0 (p=0.16) |
Primary=2 Secondary=5 *(p=0.001) |
| Fixed vs Mobile | Mobile=6 Fixed=3 (p=0.13) |
Mobile=3 Fixed=1 (p=0.61) |
Mobile=6 Fixed=1 (p=0.091) |
Mobile=3 Fixed=4 (p=0.66) |
| Basal ganglia changes on MRI | Yes=2 No=7 (p=0.68) |
Yes=2 No=2 (p=0.56) |
Yes=1 No=5 (p=0.63) |
Yes=3 No=5 (p=0.63) |
| Fixed Deformity | Yes=0 No=9 (p=0.54) |
Yes=1 No=3 (p=0.28) |
Yes=1 No=6 (p=0.46) |
Yes=0 No=7 (p=1.0) |
| Pre-op Severity (TWSTRS, BFM) | TWSTRS=20±3.94 (p=0.25) |
TWSTRS=17.25±3.096 (p=0.25) |
BFM=38.5±34.93 #3 (p=0.24) |
BFM=65.67±27.58 #6 (p=0.24) |
| Medical Comorbidity | None=6 (p=0.68) HTN=1 (p=0.37) Smoker=3 (p=0.30) |
None=1 (p=0.29) HTN=2 (p=1.0) Smoker=1 (p=0.20) |
None=4 (p=1.0) HTN=3 (p=0.29) DM=1 (p=0.46) CAD=1 (p=0.46) |
None=4 (p=1.0) HTN=1 (p=0.63) DM=1 (p=0.46) CAD=1(p=0.46) Smoker=1 (p=1.0 Prior stroke=1 (p=0.26) |
| Age (yrs) at diagnosis *p=0.0016 |
51.33±14.12 | 57.86±7.82 | 23.14±18.06 | 18.43±26.79 |
| Age (yrs) at Surgery *p=0.030 |
57.44±14.80 | 65.50±8.62 | 47.06±16.23 | 34.63±23.27 |
| Date of surgery (days) p=0.63 |
2/24/2009±586.38 | 3/14/2008± 536.23 | 5/15/2008±745.11 | 2/14/2009±426.44 |
| Duration at surgery (yrs) *p=0.012 |
6.11±3.35 | 7.64±4.45 | 23.91±17.14 | 16.20±8.98 |
Legend: Age at Diagnosis, Age at Surgery, Date of surgery and Duration of surgery p values were calculated using an ANOVA. Significant Anova and bonferroni calculations are reported separately in the manuscript. Numerical values for these variables in the rows reflect mean± standard deviation. Other variable p values were calculated using Fisher's exact test. P values from comparisons between groups and rest of the sample population are reported. BFM p values were calculated from 3 and 6 patients in the GD good and poor groups respectively.
p<0.05, CD=cervical dystonia, GD=generalized dystonia, n=participant numbers, TWSTRS=Toronto Western Spasmodic Torticollis Rating Scale, BFM=Burke-Fahn-Marsden Dystonia Rating Scale
Discussion
This study used a functional atlas with normalized imaging space to assess whether there was an optimal pallidal target location for CD and GD patients. There was a difference in the average active contact location between the CD and GD dystonia patients as well as good and poor responders, especially inferiorly. CD poor responders showed the only statistically significant difference in average active contact location when they were compared to CD good and GD poor responders in the Z plane (superior-inferior or dorsoventral direction). The standard deviations were fairly large and the degrees of variance overlapped between groups in most directions, eliminating much chance for statistically significant results. The large variances reflected the amount of difference seen in individual active contact locations. Imaging data demonstrates the same spread of individual active contact location seen with the raw data. The CD map did show the most notable clustering of active contacts between good and bad responders, reflecting perhaps more uniformity amongst the disease phenomenology in this group. Generalized dystonia clinically is a much more heterogeneous condition which seems to be reflected in the greater variance in active contact location. Albeit with a limited sample size, this study suggests that there is not an optimal target location within the GPi and that clinical outcome is not dependent on precise coordinates within the posterolateroventral portion of the GPi. While the hope was to see definite anatomical separation between good and poor responders as well as different types of dystonia using this technique, the findings are in accordance with findings in the literature using older, more traditional methods of lead localization [12, 15]. The review of patient characteristics suggests that patient selection has the potential to have more bearing on clinical outcome than precise targeting, and should likely be the focus of DBS programs in future.
Published data is limited on the ideal dystonia target location within the posterolateroventral GPi as well as how clinical outcome or dystonia type may correlate with target location. Further, the standard post-operative imaging with MRI or post-operative MRI fused with preoperative CT scans used in prior studies can be suboptimal to accurately visualize lead location [13]. Hamani et al retrospectively assessed Parkinson's disease, CD patients and GD patients who had undergone GPi DBS [15]. They found no statistical difference in location between groups nor correlation with location and clinical outcome. Starr et al analyzed data on a variety of implanted dystonia patients using MRI sequences [12]. Mean lead tip and active contact location did not significantly differ between good and bad responders [12]. The investigators did state that mean lead tip location for their patients was 20 mm lateral, 2.5 mm anterior, and 5.8 mm inferior to the mid-commissural point [12]. Pinsker et al more recently defined their target as 20.76 mm lateral, 2.75 mm anterior and 1.95 mm inferior to the mid-commissural point using a fast spin-echo inversion-recovery sequence and T1 MRI sequence [29]. Starr et al (2006) cites others who have published similar coordinates for GPi targeting [11,25,27]. Most of the cited authors present little data on targeting of good vs bad responders or targeting of individual dystonia subtypes. Cheung at el recently used an innovative approach using computationally derived volumes of tissue activation to retrospectively define the GPi target in a collection of DYT1 generalized dystonia patients [14]. The overall stimulated area was large but there was a smaller area of overlap, indicating a possible optimal stimulation area [14].
Vayssiere et al did look at different anatomical types of dystonia and found that, on the right side, there were statistically significant differences in optimal contact location, suggesting a somatotopic organization of the GPi [11]. This group found that, in bilateral good responders, the right active contact position was more posterior for predominant symptoms in the superior limb, and more anterior and central for symptoms predominant in the inferior limb [11]. Some microrecording data also suggests that cells correlating with the leg seem more consistently central, and that arm and face are more caudal/posterior [30] or more in the dorsoventral GPi segment [31]. Given that dystonia patients in our study did not have individual clinical ratings for each limb, it is difficult to make accurate comparisons. There did seem to be separation between groups in our study but the amount of variability in individual target location makes it difficult to make assessments about the GPi somatotopic organization.
Patient characteristics that may influence DBS outcomes have been better researched. Studies of generalized dystonia have suggested younger age at surgery, shorter duration of disease, mobile posture, DYT1 status and a primary dystonia diagnosis predict a better clinical outcome [21-28]. With the exception of a primary dystonia diagnosis, these findings are too inconsistent to make definitive conclusions. Other investigations have failed to find any patient characteristic that predicts clinical outcome [8,28]. Our findings support prior observations that secondary dystonias did not respond as well to GPi DBS as primary dystonias. GD good responders had an older age at surgery and longer duration of disease until surgery despite a lack of statistical significance when compared to the GD poor responder group. We believe this difference reflects the complicated nature of the secondary dystonias that tended to be diagnosed and surgically treated earlier at our center. For the CD population, surgery is typically performed at an older age than GD given the later disease presentation. Several studies have not seen a correlation of better outcomes with a shorter disease duration at time of surgery and younger age at time of surgery as potentially in the GD population [5,9,32]. In this study, the CD good responders were younger and had a shorter disease duration at time of surgery as compared to CD poor responders, suggesting that, with our population, performing surgery earlier was beneficial. Notably, duration of disease at time of surgery was not statistically significant in the CD good versus poor responders. Our primary statistical differences in age and time to surgery between groups were more a reflection of the different GD and CD populations.
There were several potential shortcomings of this study. Although the sample size is relatively large for a dystonia DBS study, it is still too small to make wide reaching conclusions about clinical outcomes. Dystonia is such a variable entity that conclusions about its treatment are inherently difficult. Further, in twenty patients, one month postoperative CT scans were used for nonrigid registration. In the other seven, only immediate postoperative scans were available. Pneumocephalus present on the immediate post-op scans may have impacted results. However, when analyzed, the width of pneumocephalus in the dorsoventral direction and distance to the centroid of all active contacts was not linear (R=0.31), making this impact less clear. We also cannot say with certainty whether clinical outcome is a cumulative response of bilateral lead placement or potentially the result of one well-placed singular lead. Finally, the use of the CGI score to assess clinical outcome is certainly not as desirable as standardized ratings such as the TWSTRS or BFM. In this study, however, the objective was not to quantify changes in clinical outcome on a continuous scale; thus, the comparison was made between good and poor responders. The authors believed the CGI score post DBS sufficiently assessed this difference in outcomes.
In conclusion, this study used a functional atlas and normalized imaging space to more accurately assess the optimal target location of pallidal DBS for dystonia. This work is representative of how useful this technology can be in postoperative lead comparison. We discovered significant overlap in active contact between the good and non-responder groups and between CD and GD groups, suggesting that the target area may be broader than previously reported. A multicenter trial using this technique would be useful to make more definitive conclusions about the target area. Defining the region of influence for GPi stimulation is an important topic given the challenges of postoperative programming in this population (eg long time intervals until stimulation induced clinical benefits often of several months duration and a lack of accepted programming parameters) as well as challenges inherent with more complex DBS apparatus involving more contact selections potentially on the horizon. In this future study, CT scans used for map creation should be performed at least one month postoperatively to negate any potential impact of brain shift and pneumocephalus. Ultimately, however, patient selection may be a more important factor in determining outcomes from DBS. In this study, primary dystonias had better outcomes than secondary dystonias, regardless of CD or GD status. CD patients implanted with a shorter duration of disease also had superior results.
Acknowledgments
This research has been supported in part by NIH R01 EB006136. The content is solely the responsibility of the authors and does not necessarily represent the official views of these institutes.
Footnotes
Conflicts of Interest/Disclosures: Dr. D'Haese, Dr. Konrad and Dr. Dawant are founding members and stock holders, and Dr. Pallavaram is a stock holder, in Neurotargeting, LLC that licenses the CRAVE software suite from Vanderbilt University. Dr. Phibbs has done consulting work for Medtronic, Inc. and has received speaking honoraria from Teva. All authors have approved the final article.
Works Cited
- 1.Tarsy D, Simon DK. Dystonia. N Engl J Med. 2006;355:818–29. doi: 10.1056/NEJMra055549. [DOI] [PubMed] [Google Scholar]
- 2.Geyer HL, Bressman SB. The diagnosis of dystonia. Lancet Neurol. 2006;5:780–90. doi: 10.1016/S1474-4422(06)70547-6. [DOI] [PubMed] [Google Scholar]
- 3.Jankovic J. Treatment of dystonia. Lancet Neurol. 2006;5:864–72. doi: 10.1016/S1474-4422(06)70574-9. [DOI] [PubMed] [Google Scholar]
- 4.Jankovic J. Re-emergence of surgery for dystonia. J Neurol Neurosurg Psychiatry. 1998;65(4):434. doi: 10.1136/jnnp.65.4.434. [DOI] [PMC free article] [PubMed] [Google Scholar]
- 5.Kiss ZH, Doig-Beyaert K, Eliasziw M, Tsui J, Haffenden A, Suchowersky O Functional and Stereotactic Section of the Canadian Neurosurgical Society; Canadian Movement Disorders Group. The Canadian multicentre study of deep brain stimulation for cervical dystonia. Brain. 2007;130(11):2879–86. doi: 10.1093/brain/awm229. [DOI] [PubMed] [Google Scholar]
- 6.Hamani C, Moro E. Surgery for other movement disorders-dystonia, tics. Curr opin Neurol. 2007;20(4):470–6. doi: 10.1097/WCO.0b013e32825ea69d. [DOI] [PubMed] [Google Scholar]
- 7.Vasques X, Cif L, Gonzalez V, Nicholson C, Coubes P. Factors predicting improvement in primary generalized dystonia treated by pallidal deep brain stimulation. Mov Disord. 2009;24(6):846–53. doi: 10.1002/mds.22433. [DOI] [PubMed] [Google Scholar]
- 8.Kupsch A, Bencke R, Muller J, Trottenberg T, Schneider GH, Poewe W, Eisner W, Wolters A, Müller JU, Deuschl G, Pinsker MO, Skogseid IM, Roeste GK, Vollmer-Haase J, Brentrup A, Krause M, Tronnier V, Schnitzler A, Voges J, Nikkhah G, Vesper J, Naumann M, Volkmann J Deep-Brain Stimulation for Dystonia Study Group. Pallidal deep-brain stimulation of the globus pallidus in primary generalized or segmental dystonia. N Engl J Med. 2006;355(19):1978–90. doi: 10.1056/NEJMoa063618. [DOI] [PubMed] [Google Scholar]
- 9.Hung SW, Hamani C, Lozano AM, Poon YY, Piboolnurak P, Miyasaki JM, Lang AE, Dostrovsky JO, Hutchison WD, Moro E. Long-term outcome of bilateral pallidal deep brain stimulation for primary cervical dystonia. Neurology. 2007;68(6):457–59. doi: 10.1212/01.wnl.0000252932.71306.89. [DOI] [PubMed] [Google Scholar]
- 10.Starr PA, Turner RS, Rau G, Lindsey N, Heath S, Volz M, Ostrem JL, Marks WJ., Jr Microelectrode –guided implantation of deep brain stimulators into the globus pallidus internus for dystonia: Techniques, electrode locations, and outcomes. Neurosurg Focus. 2004;17(1):E4. doi: 10.3171/foc.2004.17.1.4. [DOI] [PubMed] [Google Scholar]
- 11.Vayssiere N, van der Gaag N, Cif L, Hemm S, Verdier R, Frerebeau P, Coubes P. Deep brain stimulation for dystonia confirming a somatopic organization in the globus pallidus internus. J Neurosurg. 2004;101:181–8. doi: 10.3171/jns.2004.101.2.0181. [DOI] [PubMed] [Google Scholar]
- 12.Starr PA, Turner RS, Rau G, Lindsey N, Heath S, Volz M, Ostrem JL, Marks WJ., Jr Microelectrode –guided implantation of deep brain stimulators into the globus pallidus internus for dystonia: Techniques, electrode locations, and outcomes. J Neurosurg. 2006;104(4):488–501. doi: 10.3171/jns.2006.104.4.488. [DOI] [PubMed] [Google Scholar]
- 13.Vitek JL, Delong MR, Starr PA, Hariz MI, Metman LV. Intraoperative Neuropshysiology in DBS for Dystonia. Mov Dis. 2011;26(S1):S35–S40. doi: 10.1002/mds.23619. [DOI] [PubMed] [Google Scholar]
- 14.Cheung T, Noecker AM, Alterman R, McIntyre C, PhD, Tagliati M. Defining a Therapeutic Target for Pallidal Deep Brain Stimulation for Dystonia. Ann Neurol. 2014;76:22–30. doi: 10.1002/ana.24187. [DOI] [PubMed] [Google Scholar]
- 15.Hamani C, Moro E, Zadikoff C, Poon Y, Lozano A. Location of Active Contacts in Patients with Primary Dystonia treated with Globus Pallidus Deep Brain Stimulation. Neurosurgery. 2008;62(3 Suppl 1):217–23. doi: 10.1227/01.neu.0000317396.16089.bc. [DOI] [PubMed] [Google Scholar]
- 16.D'Haese P, Pallavaram S, Kao C, Neimat JS, Konrad PE, Dawant BM. Effect of Data Normalization on the Creation of Neuro-Probabilistic Atlases. Stereotact Funct Neurosurg. 2013;91(3):148–52. doi: 10.1159/000345268. [DOI] [PMC free article] [PubMed] [Google Scholar]
- 17.Pallavaram S, Dawant BM, Koyama T, Yu H, Neimat J, Konrad PE, D'Haese PF. Validation of a fully automatic method for the routine selection of the anterior and posterior commissures in magnetic resonance images. Stereotact Funct Neurosurg. 2009;87:148–54. doi: 10.1159/000209295. [DOI] [PMC free article] [PubMed] [Google Scholar]
- 18.Maks CB, Butson CR, Walter BL, Vitek JL, McIntyre CC. Deep brain stimulation activation volumes and their association with neurophysiological mapping and therapeutic outcomes. J Neurol Neurosurg Psychiatry. 2009;80(6):659–66. doi: 10.1136/jnnp.2007.126219. [DOI] [PMC free article] [PubMed] [Google Scholar]
- 19.Konrad PE, Neimat JS, Yu H, Kao CC, Remple MS, D'Haese PF, Dawant BM. Customized, miniature rapid-prototype stereotactic frames for use in deep brain stimulator surgery: initial clinical methodology and experience from 263 patients from 2002 to 2008. Stereotact Funct Neurosurg. 2011;89(1):34–41. doi: 10.1159/000322276. [DOI] [PMC free article] [PubMed] [Google Scholar]
- 20.D'Haese P, Pallavaram S, Li R, Remple MS, Kao C, Neimat JS, Konrad PE, Dawant BM. CranialVault and its CRAVE tools: a clinical computer assistance system for Deep Brain Stimulation (DBS) therapy. Med Image Anal. 2012;16(3):744–53. doi: 10.1016/j.media.2010.07.009. [DOI] [PMC free article] [PubMed] [Google Scholar]
- 21.Alterman RL, Tagliati M. Deep Brain Stimulation for torsion dystonia in children. Childs Nerv Syst. 2009;23(9):1033–40. doi: 10.1007/s00381-007-0382-x. [DOI] [PubMed] [Google Scholar]
- 22.Isais IU, Alterman RL, Tagliati M. Outcome predictors of pallidal stimulation in patients with primary dystonia: the role of disease duration. Brain. 2008;131(Pt 7):1895–1902. doi: 10.1093/brain/awn120. [DOI] [PubMed] [Google Scholar]
- 23.Coubes P, Roubertie A, Vayssiere N, Hemm S, Echenne B. Treatment of DYT-1 generalised dystonia by stimulation of the internal globus pallidus. Lancet. 2000;355(9222):2220–1. doi: 10.1016/S0140-6736(00)02410-7. [DOI] [PubMed] [Google Scholar]
- 24.Eltahawy HA, Saint-Cyr J, Giladi N, Lang AE, Lozano AM. Primary dystonia is more responsive than secondary dystonia to pallidal interventions: outcome after pallidotomy or pallidal deep brain stimulation. Neurosurgery. 2004;54(3):613–9. doi: 10.1227/01.neu.0000108643.94730.21. [DOI] [PubMed] [Google Scholar]
- 25.Bereznai B, Steude U, Seelos K, Bötzel K. Chronic high-frequency globus pallidus internus stimulation in different types of dystonia: a clinical, video and MRI report of six patients presenting with segmental, cervical, and generalized dystonia. Mov Disord. 2002;17(1):138–44. doi: 10.1002/mds.1250. [DOI] [PubMed] [Google Scholar]
- 26.Albanese A, Barnes MP, Bathia KP, Fernandez-Alvarez E, Filippini G, Gasser T, Krauss JK, Newton A, Rektor I, Savoiardo M, Valls-Solè J. A systemic review on the diagnosis and treatment of primary (idiopathic) dystonia and dystonia plus syndromes; report of an EFNS/MDS-ES task force. Eur J Neurol. 2006;13(5):433–44. doi: 10.1111/j.1468-1331.2006.01537.x. [DOI] [PubMed] [Google Scholar]
- 27.Vidailhet M, Vercuik L, Houeto JL, Krystkowiak P, Benabid AL, Cornu P, Lagrange C, Tézenas du Montcel S, Dormont D, Grand S, Blond S, Detante O, Pillon B, Ardouin C, Agid Y, Destée A, Pollak P French Stimulation du Pallidum Interne dans la Dystonie (SPIDY) Study Group. Bilateral deep-brain stimulation of the globus pallidus in primary generalized dystonia. N Engl J Med. 2005;352(5):459–67. doi: 10.1056/NEJMoa042187. [DOI] [PubMed] [Google Scholar]
- 28.Bronte-Stewart H, Taira T, Valldeoriola F, Merello M, Marks WJ, Jr, Albanese A, Bressman S, Moro E. Inclusion and Exclusion Criteria for DBS in dystonia. Mov Disord. 2011;26(S1):S5–S16. doi: 10.1002/mds.23482. [DOI] [PMC free article] [PubMed] [Google Scholar]
- 29.Pinsker MO, Volkmann J, Falk D, Herzog J, Alfke K, Steigerwald F, Deuschl G, Mehdorn M. Electrode implantation for deep brain stimulation in dystonia: a fast spin-echo inversion-recovery sequence technique for direct stereotactic targeting of the GPI. Zentralbl Neurochir. 2008;69(2):71–5. doi: 10.1055/s-2007-1004583. [DOI] [PubMed] [Google Scholar]
- 30.Delong MR, Georgopoulos AP, Crutcher MD, Mitchell SJ, Richardson RT, Alexander GE. Functional organization of the basal ganglia: contributions of single-cell recording studies. Ciba Found Symp. 1984;107:64–82. doi: 10.1002/9780470720882.ch5. [DOI] [PubMed] [Google Scholar]
- 31.Taha JM, Favre J, Baumann TK, Burchiel KJ. Characteristics and somatotopic organization of kinesthetic cells in the globus pallidus of patients with Parkinson's disease. J Neurosurg. 1996;85(6):1005–12. doi: 10.3171/jns.1996.85.6.1005. [DOI] [PubMed] [Google Scholar]
- 32.Witt J, Moro E, Ash R, Hamani C, Starr PA, Lozano AM, Hodaie M, Poon YY, Markun LC, Ostrem JL. Predictive Factors of Outcome in Primary Cervical Dystonia Following Pallidal Deep Brain Stimulation. Mov Disord. 2013;28(10):1451–55. doi: 10.1002/mds.25560. [DOI] [PubMed] [Google Scholar]