

Abstract
Objective
The pathologic validation of European Alzheimer's Disease Consortium Alzheimer's Disease Neuroimaging Center Harmonized Hippocampal Segmentation Protocol (HarP).
Methods
Temporal lobes of nine Alzheimer's disease (AD) and seven cognitively normal subjects were scanned post-mortem at 7 Tesla. Hippocampal volumes were obtained with HarP. Six-micrometer-thick hippocampal slices were stained for amyloid beta (Aβ), tau, and cresyl violet. Hippocampal subfields were manually traced. Neuronal counts, Aβ, and tau burden for each hippocampal subfield were obtained.
Results
We found significant correlations between hippocampal volume and Braak and Braak staging (ρ = −0.75, P = .001), tau (ρ = −0.53, P = .034), Aβ burden (ρ = −0.61, P = .012), and neuronal count (ρ = 0.77, P < .001). Exploratory subfield-wise significant associations were found for Aβ in CA1 (ρ = −0.58, P = .019) and subiculum (ρ = −0.75, P = .001), tau in CA2 (ρ = −0.59, P = .016), and CA3 (ρ = −0.5, P = .047), and neuronal count in CA1 (ρ = 0.55, P = .028), CA3 (ρ = 0.65, P = .006), and CA4 (ρ = 0.76, P = .001).
Conclusions
The observed associations provide the pathological confirmation of hippocampal morphometry as a valid biomarker for AD and the pathologic validation of HarP.
Keywords: Hippocampus, Atrophy, Hippocampal atrophy, Alzheimer, Dementia, Hippocampal segmentation, Hippocampal volumes, Subfields, Pathology, Braak, CERAD, Amyloid, Tau, Neuronal count
1. Introduction
The gold standard for the diagnosis of Alzheimer's disease (AD) remains post-mortem examination of brain tissue. It is well known that the clinical AD diagnosis has suboptimal accuracy [1,2]. Accordingly, 15% of AD subjects enrolled into the Alzheimer's Disease Neuroimaging Initiative (ADNI)—a premier AD natural disease history study with stringent inclusion and exclusion criteria—were reported to be amyloid negative on in vivo Florbetapir scans, reported to have 93% sensitivity and 100% specificity for amyloid pathology when compared with post mortem immunohistochemistry [3,4]. These data emphasize the need for a pathologic validation of clinical diagnostic criteria and any and all biomarkers proposed to be useful for diagnosing AD or tracking its course over time.
Hippocampal atrophy is the most established structural imaging biomarker for AD to date. Hippocampal atrophy can be relatively easily ascertained from magnetic resonance imaging (MRI) data. Many groups including ours have consistently replicated the utility of hippocampal atrophy in assessing neurodegeneration in AD across the disease spectrum [5–15].
Recently, the European Alzheimer's Disease Consortium (EADC) and ADNI investigators developed the EADC-ADNI Harmonized Protocol for Hippocampal Segmentation (HarP, Appendix II in this special issue) [16]. The motivation behind this undertaking was the significant discrepancy between existing hippocampal segmentation protocols resulting in up to 2.5-fold differences in hippocampal volumetric estimates as reported in Boccardi et al. [17]. The methodology for the development and validation of the HarP has previously been described [17–22]. Briefly, after quantifying the variability in hippocampal volumetric estimates between the 12 most commonly used hippocampal segmentation protocols [17], the EADC-ADNI HarP work group carefully examined, operationalized, and quantified the differences in hippocampal segmentation among these 12 protocols [20]. This was followed by an iterative Delphi procedure polling a group of international hippocampal segmentation experts until a consensus on a final protocol was achieved [19]. Once the final HarP was established, five master experts in hippocampal segmentation from different laboratories produced the benchmark hippocampal traces—i.e. the “gold standard” for naive rater training and qualification [23]. Next, the protocol was validated in naive tracers [24]. However, the HarP has not been pathologically validated to date.
The pathologic hallmarks of AD are amyloid plaques and neurofibrillary tangles (NFT). The pathologic diagnosis of AD cannot be established in the absence of amyloid plaques, whose main constituent is the amyloid β (Aβ) protein. Yet, although the role of amyloid pathology in AD pathophysiology is clearly established and strongly supported by the existence of autosomal dominant AD variants with causative mutations causing the overproduction of Aβ, amyloid plaques alone do not seem sufficient to result in cognitive impairment [25,26].
NFT are composed of hyperphosphorylated tau protein. They are not specific for AD and are seen in many other neurodegenerative disorders [25]. NFT restricted to subcortical structures (such as the hippocampus) are commonly observed in cognitively normal subjects. Yet widespread cortical NFT pathology almost invariably implies substantive cognitive impairment. NFT burden and Braak and Braak staging have been previously associated with cortical and hippocampal atrophy [27,28].
The trajectories of the spread of Aβ and tau through the brain differ. Aβ is deposited and then spreads through the neocortex before invading the limbic structures (hippocampus, amygdala, and cingulate cortex). It is later is found in to the basal ganglia, diencephalon, and finally the pons and cerebellum [25]. Conversely, NFTs develop first in the transentorhinal and entorhinal areas. From there they spread to the subiculum and CA1, followed by the CA2 and CA3 areas of the hippocampus, before involving the neocortex [29–31]. Tau pathology correlates well with cognitive decline and brain and hippocampal atrophy [26].
In this study we took advantage of high-resolution MR imaging and advanced digital pathology methods to conduct a pathological validation of the HarP. In addition to associations between mean hippocampal pathology indices and global hippocampal volume, we also sought correlations between hippocampal subfield disease burden and hippocampal volume. We hypothesized that global hippocampal volume will show significant association with mean Aβ and tau burden and neuronal counts and that these associations will also be observed at the subfield level (exploratory analyses).
2. Methods
2.1. Subjects
Study materials included the autopsy brains of 10 consecutive AD (six males and four females) and seven normal control (NC, one male and six females) adult subjects who did not have strokes or other gross abnormalities in the temporal lobe areas. NC died of nonneurological causes and had no history of cognitive decline. The post-mortem interval (i.e., time from death until autopsy) ranged from 3 to 99 hours (mean 22.9 ± 24.7 hours, median 16 hours). The brains were weighed and fixed in 10% neutral buffered formalin for at least 10 days. One of the temporal lobes was excised, taking care to preserve the structure of the underlying hippocampus, and provided for imaging. The remainder of the brain was dissected and specific cortical and subcortical sites were sampled as per our local autopsy protocol.
2.2. Imaging acquisition and hippocampal volumetry
The temporal lobes were scanned for 60 hours (three acquisitions of 20 hours each) on a 7T Bruker Biospec MRI scanner with the following protocol: rapid acquisition with relaxation enhancement, time to repetition 1000 ms, time to echo 80.3 ms, flip angle 180°, number of excitations 24, matrix 1024 × 475 × 256, and field of view 10 × 6 × 5 cm. The three acquisitions were averaged, resulting in a final resolution of 0.125 × 0.125 × 0.195 mm (see Supplementary Figure 1). One cognitively normal subject with optimal gray-white differentiation and optimal signal-to-noise was selected as the reference image. All other hippocampal scans were manually coregistered to the reference subject using the register function of the Display and Register software package developed at the Montreal Neurological Institute, Montreal, Canada, freely available at (http://www.bic.mni.mcgill.ca/software/Display/Display.html) using a six-parameter transformation. Five tag points per scan were selected as registration anchors (see Supplementary Figure 2). The hippocampal structures were manually traced by the first author—one of the original HarP master tracers [21]—although explicitly following the HarP protocol (Appendix II in this special issue and Supplementary Figure 1). Tracing was performed in Multi-Tracer—an interactive segmentation software platform developed at Laboratory of NeuroImaging University of Southern California, Los Angeles, CA, USA (freely available at http://www.loni.usc.edu/Software/MultiTracer).
Volumes for the hippocampal formation and any cerebrospinal fluid (CSF) pockets as defined by the HarP (Appendix II in this special issue). Volumes were computed using the MultiTracer “Frust” volume computation function. This method gives better results in the whole-volume interpolation when the areas of segmentation are not perfectly aligned from one slice to another. The volume is calculated by assuming that (1) the structure extends from the center of the first plane to the center of the last plane and (2) the square root of segmented areas on each slice vary linearly when moving from the center of one plane to the center of the next. Final volumes were obtained by subtracting the CSF pocket volumes from the main hippocampal volume as previously described [21].
2.3. Routine pathology and diagnostic classification
Braak and Braak scores [32–35] were determined for all cases. The pathologic diagnosis of AD was based on Braak and Braak and Consortium to Establish a Registry for AD (CERAD) pathologic criteria [36].
2.4. Hippocampal tissue processing and systemic sampling
After the imaging was completed the scanned temporal lobes were sectioned coronally in 5 mm slabs using a motor-driven rotary slicer beginning at the level of pes hippocampi as previously described [37]. The slabs were embedded in paraffin and 6-μm sections cut from them using a microtome. The slices were mounted on Superfrost Plus glass slides. Four consecutive slides from each slab were stained with hematoxylin and eosin, cresyl violet, amyloid β 1-40 antibody (AB5074 P, EMD Millipore Corporation, Billerica, USA), and tau antibody (MN1020, Thermo Fisher Scientific Pierce, Rockford, IL, USA). Appropriate horseradish peroxidase-linked secondary antibodies (Vector MP7401 and MP7402, Vector Laboratories, Burlingame, CA, USA) and 3,3′-diaminobenzidine Peroxidase Substrate Kit (Vector SK-4100, Vector Laboratories, Burlingame, CA, USA) was utilized to visualize immunostaining.
2.5. Digital pathology and subfield delineation
The demarcations of each hippocampal subfield (CA1, CA2, CA3, CA4, and subiculum) were drawn manually on Aperio ImageScope® CS digitally scanned images of the cresyl violet, Aβ-, and tau-immunostained slices. Subfield margins were identified based on cytoarchitectonic features (i.e., differences in size, shape, orientation, and distribution of neurons), as briefly described later (for detailed description please see West and Gundersen [38]). The transition from CA1 to subiculum was determined based on change in cell shape. CA1 is characterized by neurons with distinct triangular (i.e., pyramidal) shape. Subicular neurons are smaller and more oblong in appearance. To assure that we had obtained clean subfield metrics, we did not include the CA1 and subicular portions of the prosubiculum—a region where these two subfields overlap with each other. The CA1–CA2 and CA2–CA3 transitions are marked by a relatively abrupt shift from the wider and less densely packed pyramidal cell layers in CA1 and CA3 to the tightly packed pyramidal cell layer characteristic of CA2. Additionally both CA2 and CA3 neurons are larger than CA1 neurons. The CA3–CA4 transition is characterized by the bend of the CA3 pyramidal cell on itself as it enters the hilus. The pyramidal cells of the CA4 (also known as the hilus of the dentate fascia) form a sparsely diffuse cell layer, which is completely contained within the dentate gyrus. Supplementary Figure 3A shows a representative hippocampal slice with all five subfields outlined.
We used Aperio Positive Pixel Count Algorithm v9 to detect the positive reactivity of immunostaining for Aβ and tau for each subfield calculated in positive pixels per square micrometer (pixel/μm2). The software produces three intensity ranges (weak, positive, and strong). For pixels that satisfy the color specification, the algorithm counts the number of positive, and negative staining pixels. Default parameters for the algorithm are hue value = 0.1, hue width = 0.5, total Intensity of Weak Positive pixels (IWP)—high = 220, low = 175, total intensity of strong positive pixels (ISP)— high = 100 and low = 0. For our analyses the hue width, IWP high, IWP low, and ISP high values were adjusted to 0.31, 200, 180, and 160, respectively, to discount any background immunostaining that could be quantified as false strong positive pixels. Hue value and ISP (low) remained at 0.1 and 0, respectively. Supplementary Figure 3B–G shows representative examples for CA4 Aβ and CA1 tau digital pathology. As one can see in the figures, tau positivity was based on tau immunoreactivity detected in both NFT and neuropil threads, whereas Aβ immunoreactivity detected mostly signal from amyloid plaques. Neuronal counts were determined using a Nuclear Image Analysis algorithm. The algorithm uses morphological processing to determine which of the nuclei in the areas of interest belong to neurons (i.e., positive nuclei) and which do not (i.e., negative nuclei). This was followed by careful visual inspection and manual correction of any mislabeled neurons. Supplementary Figure 3H–J shows an example of Aperio's Nuclear Image Analysis algorithm.
Although the mean post-mortem interval for the NC cases was significantly longer than those of the AD cases (30 vs. 9 hours, P = .042) we found no difference in the quality of the histology material or our ability to identify hippocampal neurons using the Aperio technique followed by manual correction or to detect Aβ and tau pathology.
2.6. Statistical approach
Univariate analyses were performed for all imaging and pathology variables (i.e., hippocampal volume, Aβ, and tau burden and neuronal counts) to identify any outliers. Outliers whose measures fell ≥2 standard deviations (SD) from the group mean were removed from analyses. Demographic comparisons were conducted with Mann-Whitney U test for continuous and Fisher exact test for categorical variables. Braak and Braak disease severity distribution differences between cases and controls was analyzed with chisquare test. Imaging-pathology correlations were conducted with Spearman ρ. Finally, we investigated the between-group whole hippocampus and subfield differences in Aβ, tau, and neuronal count medians using Mann-Whitney U test for two samples.
3. Results
Analyses were done with nine AD and seven NC subjects. One 96-year-old AD male subject with pathologically proven AD per NIA-Reagan criteria and Braak and Braak stage VI with frequent neuritic plaques per CERAD criteria with fresh brain weight of 1020 g and a hippocampal volume of 4887 mm3 (4.8 SD from the mean of the NC) was excluded from further analyses. The temporal lobe sectioning cut through the very end of the hippocampal tail for one control subject. The subject's hippocampal volume measured 2282 mm3 (1.3 SD from the mean of the NC). Although this subject was not technically an outlier, we elected to nevertheless perform the analyses with and without this sample. There were no significant differences in age and gender distribution between the two groups. As expected, fresh brain weight and hippocampal volume were significantly lower in AD vs. NC subjects (Table 1).
Table 1. Demographic and volumetric subject characteristics.
| Variable | Controls, N = 7 | AD, N = 9 | P-value |
|---|---|---|---|
| Age, yrs | 63 (23) | 82 (8) | .101 |
| Gender, F/M | 6/1 | 4/5 | .145 |
| Braak and Braak stage | 3 I–II, 2 III, 2 IV | 1 V, 7 VI | .01 |
| CERAD plaque frequency | Four none, one sparse, one moderate | Two moderate, Seven frequent | .02 |
| Fresh brain weight, g | 1286 (63) | 1090 (155) | .039 |
| Hippovolume, mm3 | 2837 (427) | 1867 (532) | .007 |
Abbreviations: AD, Alzheimer's disease; CERAD, Consortium to Establish a Registry for Alzheimer's Disease; F, female; M, male; mm, millimeter; g, gram.
Braak and Braak stage correlated strongly with fresh brain weight (ρ = −0.64, P = .007), hippocampal volume (ρ = −0.75, P = .001), mean tau burden (ρ = 0.65, P = .007), and mean Aβ burden (ρ = 0.65, P = .007). Trend-level correlation was seen for mean neuronal count (ρ = −0.452, P = .079). The scatterplot graphs depicting these associations can be seen in Figure 1.
Fig. 1.

Scatterplot graphs of pathology distribution by Braak and Braak stage.
Hippocampal volume defined by the HarP correlated strongly with fresh brain weight (ρ = 0.69, P = .003), Braak and Braak stage (ρ = −0.75, P = .001), mean tau (ρ = −0.53, P = .034), mean Aβ burden (ρ = −0.61, P = .012), and mean neuronal count (ρ = 0.77, P < .0001). The results remained unchanged after the exclusion of the NC subject with cut hippocampal tail. In addition the association between mean Aβ and hippocampal volume remained significant after excluding an AD outlier with very high mean Aβ burden (2.5 SD above the grand mean). These results can be seen in the top portion of Table 2 and the top row of Figure 2.
Table 2. Spearman correlations between EADC-ADNI Harmonized Protocol-derived hippocampal volume and pathology indices.
| Variable | All subjects | Variable-specific outliers excluded | ||
|---|---|---|---|---|
|
|
|
|||
| Spearman rho | P-value | Spearman rho | P-value | |
| Fresh brain weight, g | 0.69 | .003 | ||
| Braak and Braak stage | −0.75 | .001 | ||
| Mean Aβ, pixel/μm2 | −0.61 | .012 | −0.56 | .031 |
| Mean tau, pixel/μm2 | −0.53 | .034 | ||
| Mean neuronal count, cell count/μm2 | 0.77 | .0001 | ||
| Subiculum | ||||
| Aβ, pixel/μm2 | −0.75 | .001 | −0.72 | .003 |
| Tau, pixel/μm2 | −0.43 | .094 | ||
| Neuronal count, cell count/μm2 | 0.76 | .001 | 0.78 | .001 |
| CA1 | ||||
| Aβ, pixel/μm2 | −0.58 | .019 | ||
| Tau, pixel/μm2 | −0.42 | .105 | ||
| Neuronal count, cell count/μm2 | 0.55 | .028 | ||
| CA2 | ||||
| Aβ, pixel/μm2 | -0.31 | .24 | −0.18 | .48 |
| Tau, pixel/μm2 | −0.59 | .016 | ||
| Neuronal count, cell count/μm2 | 0.3 | .26 | 0.2 | .48 |
| CA3 | ||||
| Aβ, pixel/μm2 | −0.36 | .169 | −0.27 | .328 |
| Tau, pixel/μm2 | −0.50 | .047 | −0.48 | .069 |
| Neuronal count, cell count/μm2 | 0.36 | .172 | 0.23 | .41 |
| CA4 | ||||
| Aβ, pixel/μm2 | −0.26 | .339 | ||
| Tau, pixel/μm2 | −0.47 | .064 | −0.45 | .095 |
| Neuronal count, cell count/μm2 | 0.65 | .006 | ||
Abbreviations: EADC-ADNI, European Alzheimer's Disease Consortium Alzheimer's Disease Neuroimaging Center; Aβ, amyloid beta; g, gram; μm, micrometer.
Fig. 2.
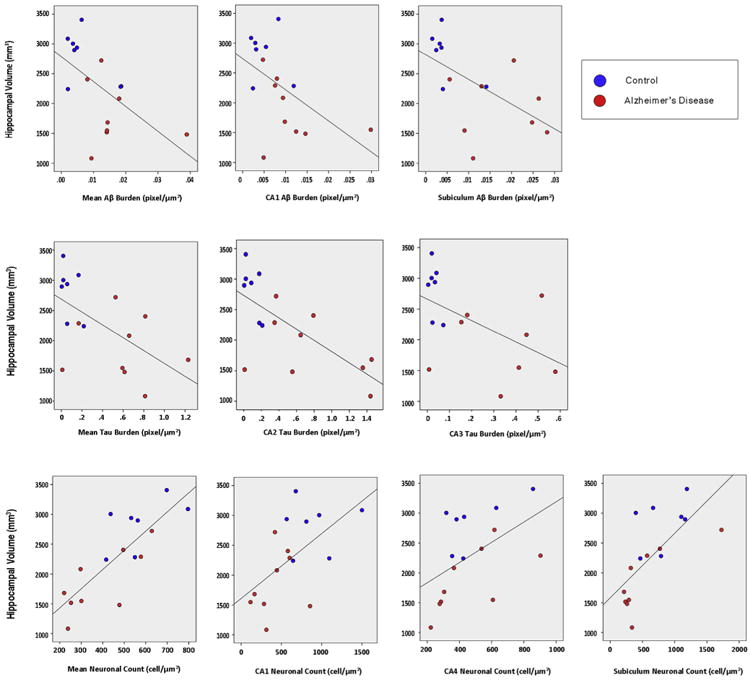
Scatterplot graphs showing the correlation between hippocampal volume defined by the European Alzheimer's Disease Consortium Alzheimer's Disease Neuroimaging Center (EADC-ADNI) Harmonized Protocol (HaRP) and pathology indices (outliers removed for mean amyloid beta [Aβ], Aβ subiculum, and tau CA3).
Mann-Whitney U comparison of medians showed significant differences between the two groups for total hippocampal tau and Aβ burden (P = .008 for both) and trend for significance for neuronal count (P = .071, Table 3). Significant differences in the medians were also seen in all sub-fields for tau, the subiculum, CA1, CA3, and CA4 for Aβ, and the subiculum and CA1 for neuronal counts. These results can be seen in Table 3. Figure 3 illustrates the ratio of median pathology burden between the two groups by sub-field.
Table 3. Mann-Whitney U comparison of medians test.
| Pathology index | Field | NC (N = 7), median (min, max) | AD (N = 9), median (min, max) | P value |
|---|---|---|---|---|
| Aβ | Subiculum | 0.0037 (0.0015, 0.0141) | 0.0205 (0.0056, 0.0658) | .004 |
| CA1 | 0.0031 (0.002, 0.0119) | 0.0094 (0.0047, 0.0298) | .04 | |
| CA2 | 0.0043 (0.0013, 0.0375) | 0.0083 (0.0034, 0.0273) | .39 | |
| CA3 | 0.0041 (0.0013, 0.018) | 0.0141 (0.0024, 0.0637) | .02 | |
| CA4 | 0.0044 (0.0013, 0.0104) | 0.0112 (0.0011, 0.0497) | .06 | |
| Whole hippocampus* | 0.02 (0.009, 0.092) | 0.071 (0.04, 0.195) | .008 | |
| Tau | Subiculum | 0.0304 (0.0028, 0.345) | 0.8171 (0.0142, 1.569) | .02 |
| CA1 | 0.041 (0.004, 0.47) | 0.617 (0.0094, 1.396) | .03 | |
| CA2 | 0.0855 (0.0049, 0.21) | 0.6468 (0.0101, 1.453) | .008 | |
| CA3 | 0.0232 (0.0041, 0.072) | 0.4133 (0.0077, 1.419) | .008 | |
| CA4 | 0.0201 (0.0051, 0.064) | 0.31 (0.0059, 1.2038) | .008 | |
| Whole hippocampus* | 0.0568 (0.0042, 0.2177) | 0.614 (0.0095, 1.229) | .008 | |
| Neuronal count | Subiculum | 788 (394, 1189) | 319 (214, 1726) | .042 |
| CA1 | 810 (566, 1500) | 420 (116, 855) | .005 | |
| CA2 | 230 (213, 347) | 163 (47, 364) | .114 | |
| CA3 | 330 (219, 933) | 278 (215,714) | .47 | |
| CA4 | 423 (318, 857) | 366 (222, 903) | .47 | |
| Whole hippocampus* | 550 (416, 796) | 300 (220, 628) | .071 |
Abbreviations: NC, normal control; AD, Alzheimer's disease; Aβ, amyloid beta.
Median (min, max) of the pathology summed across the five regions.
Fig. 3.

The ratio of median subfield amyloid beta (Aβ) and tau burden, and neuronal count between the groups.
Our exploratory correlation analyses between subfield pathology metrics and hippocampal volume defined by the HarP led to several interesting observations. We observed significant associations between hippocampal volume and mean Aβ burden in the subiculum (ρ = −0.75, P = .001) and CA1 (ρ = −0.58, P = .019). These results remained unchanged after exclusion of the NC subject with cut hippocampal tail. The subiculum association also remained significant after excluding one AD subject with very high subicular Aβ burden (3.1 SD greater than the grand mean). These results can be seen in Table 2 and top row of Figure 2.
We observed significant associations between hippocampal volume and mean tau burden in the CA2 (ρ = −0.59, P = .016) and CA3 (ρ = −0.5, P = .047). These results remained unchanged after the exclusion of the NC subject with cut hippocampal tail and also after excluding one AD subject with very dense CA2 and CA3 tau pathology (3.1 SD and 3 SD, respectively, greater than the grand mean). These results can be seen in Table 2 and the middle row of Figure 2.
We observed significant associations between hippocampal volume and mean neuronal count in the subiculum (ρ = 0.76, P = .001), CA1 (ρ = 0.55, P = .028), and CA4 (ρ = 0.65, P =.006). These results remained unchanged after exclusion of the NC subject with cut hippocampal tail and also after excluding one AD subject with very high neuronal counts in the subiculum (3 SD greater than the grand mean). These results can be seen in Table 2 and the bottom row of Figure 2.
4. Discussion
This is the first research study that investigates the pathologic validity of the HarP. Our results show that hippocampal volume measured with the HarP method significantly correlates with all three pathologic indices—Aβ burden, tau burden, and neuronal counts. It is possible that the HarP will become the “gold standard” for manual and automated hippocampal segmentation and volumetric analyses, making the pathologic validation of such methodology critically important.
Ours is one of only a few studies to date to systematically examine the AD pathology burden for all hippocampal sub-regions [39–41]. Despite our small sample size we found significant associations between hippocampal volumetric estimates and disease burden measured by Aβ, tau pathology, and neuronal counts. Our findings are in agreement with previous reports [37,41,42]. In our exploratory analyses we found the greatest neuronal count difference in the CA1 (see Fig. 3) as previously reported by others [37,42–44]. Also, it is of interest to note that one of the studies examined the differences in neuronal counts in all hippocampal subfields between NC and AD subjects and found the exact same pattern as the one we report here, namely, significantly lower neuronal counts in subiculum and CA1 but not in CA2–4 in AD compared with NC [44]. In addition we also report that the mean neuronal count of the subiculum, CA1 and CA4 correlate with EADC-ADNI HarP defined hippocampal volume, which is in agreement with our previous work [37].
We found the strongest associations between Aβ burden and hippocampal volume in the subiculum and CA1. We also observed significant difference in amyloid load in subiculum, CA1, and to a lesser extent CA3. This is in agreement with the previously reported sequence of Aβ pathology deposition in the human brain where the temporal neocortex (not examined in our study) was affected first, followed by the entorhinal cortex, subiculum, and CA1 and then the remaining hippocampal subfields [45].
As already discussed in the background section, NFTs have a highly staged and orderly progression through the brain, the earliest stages of tau pathology appearing in the entorhinal and CA1 regions often seen in subjects in their 1930s and 1940s, later spreading to the CA2–4 regions. Consistent with these observations, in our exploratory analyses we found significant differences in tau pathology burden in all hippocampal subfields between the groups; however, the differences were most significant in CA2–4 (see Table 3). This is due to the fact that many of our normal cases showed some degree of tau pathology as previously reported [46,47]. Because the subiculum and CA1 are affected early, with the rest of the hippocampal subfields to follow, it is not surprising that the late-to-become affected subfields were the ones showing greatest differences.
Several 7T or higher human post mortem studies in AD have been published to date [48–50]. The motivation behind two of the studies [49,50] was to establish whether one could detect the MRI signature of amyloid plaques or neurofibrillary tangles in the human brain. The third [48] explored the utility of diffusion tensor imaging at 11.7 T in detecting white matter abnormalities in subjects with concomitant AD and vascular disease. These studies did not research imaging-pathologic correlations.
Several strengths and limitations of our article need to be recognized. This is to our knowledge the first post mortem AD imaging-pathologic study conducted at 7T. Post mortem imaging allows for longer acquisition times and focused field of view, and results in a greatly improved resolution compared in vivo imaging. In addition the use of ultra high field magnetic resonance technology significantly improves the signal-to-noise ratio and the spatial resolution. Major limitations of our study are its small sample size and the lack of measurement of and adjustment for intracranial volume. However, we were able to show statistically significant associations between hippocampal volume determined with the help of the HarP, and neuropathologically proven disease burden. The data were collected from consecutive autopsies at UCLA. UCLA is a tertiary health care center and UCLA autopsies are not representative of the US population at large. As such, our findings should be interpreted with caution. Nevertheless, our findings will need to be validated in an independent study with a larger population-driven sample size in the future.
In conclusion, we were able to show powerful associations between hippocampal volume determined with the help of the first standardized hippocampal segmentation protocol and neuropathologically proven disease burden. This provides the pathologic validation of HarP as a reliable structural biomarker tool for AD. We anticipate that our work will help establish the HarP the gold standard for hippocampal tracing in the near future.
Although hippocampal subfield segmentation has not been widely used in mild cognitive impairment-AD imaging research due to the difficulty to reliably discern hippocampal subfield margins on conventional 1.5 and 3T images, many groups have made significant advances toward developing reliable hippocampal subfield segmentation rules [51–55]. These protocols would eventually benefit from pathologic validation and our data set could be easily used to achieve this and help the current effort for harmonizing the segmentation of hippocampal subfields [56].
Supplementary Material
Research in Context.
Systematic review: Hippocampal segmentation protocols can vary and often produce conflicting measurements. A unified Harmonized Protocol for Hippocampal Segmentation (HarP) was recently developed. Here we provide pathologic validation for the HarP. We searched PubMed for related research using the following keywords: “post-mortem”, “Alzheimer's disease”, “pathology”, “7T”, “high-resolution imaging”, and “MRI”. Relevant studies were additionally found in the reference lists of articles or from the related citations list on PubMed.
Interpretation: We were able to show powerful associations between HarP-derived hippocampal volume and disease burden. This provides the pathologic validation of HarP as an accurate structural biomarker tool for Alzheimer's disease.
Future directions: We anticipate that our work will help establish the HarP the gold standard for hippocampal tracing in the near future.
Acknowledgments
The authors would like to thank Andrew Frew for his technical help during MRI scanning.
Footnotes
Deceased.
Supplementary data: Supplementary data related to this article can be found at http://dx.doi.org/10.1016/j.jalz.2015.01.001.
References
- 1.Shim YS, Roe CM, Buckles VD, Morris JC. Clinicopathologic study of Alzheimer's disease: Alzheimer mimics. J Alzheimers Dis. 2013;35:799–811. doi: 10.3233/JAD-121594. [DOI] [PMC free article] [PubMed] [Google Scholar]
- 2.Beach TG, Monsell SE, Phillips LE, Kukull W. Accuracy of the clinical diagnosis of Alzheimer disease at National Institute on Aging Alzheimer Disease Centers, 2005–2010. J Neuropathol Exp Neurol. 2012;71:266–73. doi: 10.1097/NEN.0b013e31824b211b. [DOI] [PMC free article] [PubMed] [Google Scholar]
- 3.Clark CM, Schneider JA, Bedell BJ, Beach TG, Bilker WB, Mintun MA, et al. Use of florbetapir-PET for imaging beta-amyloid pathology. JAMA. 2011;305:275–83. doi: 10.1001/jama.2010.2008. [DOI] [PMC free article] [PubMed] [Google Scholar]
- 4.Clark CM, Pontecorvo MJ, Beach TG, Bedell BJ, Coleman RE, Doraiswamy PM, et al. Cerebral PET with florbetapir compared with neuropathology at autopsy for detection of neuritic amyloid-beta plaques: a prospective cohort study. Lancet Neurol. 2012;11:669–78. doi: 10.1016/S1474-4422(12)70142-4. [DOI] [PubMed] [Google Scholar]
- 5.Apostolova LG, Dinov ID, Dutton RA, Hayashi KM, Toga AW, Cummings JL, et al. 3D comparison of hippocampal atrophy in amnestic mild cognitive impairment and Alzheimer's disease. Brain. 2006;129:2867–73. doi: 10.1093/brain/awl274. [DOI] [PubMed] [Google Scholar]
- 6.Apostolova LG, Dutton RA, Dinov ID, Hayashi KM, Toga AW, Cummings JL, et al. Conversion of mild cognitive impairment to Alzheimer disease predicted by hippocampal atrophy maps. Arch Neurol. 2006;63:693–9. doi: 10.1001/archneur.63.5.693. [DOI] [PubMed] [Google Scholar]
- 7.Apostolova LG, Mosconi L, Thompson PM, Green AE, Hwang KS, Ramirez A, et al. Subregional hippocampal atrophy predicts Alzheimer's dementia in the cognitively normal. Neurobiol Aging. 2010;31:1077–88. doi: 10.1016/j.neurobiolaging.2008.08.008. [DOI] [PMC free article] [PubMed] [Google Scholar]
- 8.Apostolova LG, Thompson PM, Green AE, Hwang KS, Zoumalan C, Jack CR, Jr, et al. 3D comparison of low, intermediate, and advanced hippocampal atrophy in MCI. Hum Brain Mapp. 2010;31:786–97. doi: 10.1002/hbm.20905. [DOI] [PMC free article] [PubMed] [Google Scholar]
- 9.Chetelat G, Fouquet M, Kalpouzos G, Denghien I, De la Sayette V, Viader F, et al. Three-dimensional surface mapping of hippocampal atrophy progression from MCI to AD and over normal aging as assessed using voxel-based morphometry. Neuropsychologia. 2008;46:1721–31. doi: 10.1016/j.neuropsychologia.2007.11.037. [DOI] [PubMed] [Google Scholar]
- 10.Csernansky JG, Wang L, Joshi S, Miller JP, Gado M, Kido D, et al. Early DAT is distinguished from aging by high-dimensional mapping of the hippocampus. Dementia of the Alzheimer type Neurology. 2000;55:1636–43. doi: 10.1212/wnl.55.11.1636. [DOI] [PubMed] [Google Scholar]
- 11.De Leon MJ, George AE, Golomb J, Tarshish C, Convit A, Kluger A, et al. Frequency of hippocampal formation atrophy in normal aging and Alzheimer's disease. Neurobiol Aging. 1997;18:1–11. doi: 10.1016/s0197-4580(96)00213-8. [DOI] [PubMed] [Google Scholar]
- 12.Frisoni GB, Ganzola R, Canu E, Rub U, Pizzini FB, Alessandrini F, et al. Mapping local hippocampal changes in Alzheimer's disease and normal ageing with MRI at 3 Tesla. Brain. 2008;131:3266–76. doi: 10.1093/brain/awn280. [DOI] [PubMed] [Google Scholar]
- 13.Jack CR, Jr, Dickson DW, Parisi JE, Xu YC, Cha RH, O'Brien PC, et al. Antemortem MRI findings correlate with hippocampal neuropathology in typical aging and dementia. Neurology. 2002;58:750–7. doi: 10.1212/wnl.58.5.750. [DOI] [PMC free article] [PubMed] [Google Scholar]
- 14.Jack CR, Jr, Petersen RC, Xu Y, O'Brien PC, Smith GE, Ivnik RJ, et al. Rates of hippocampal atrophy correlate with change in clinical status in aging and AD. Neurology. 2000;55:484–9. doi: 10.1212/wnl.55.4.484. [DOI] [PMC free article] [PubMed] [Google Scholar]
- 15.Jack CR, Jr, Petersen RC, Xu YC, O'Brien PC, Smith GE, Ivnik RJ, et al. Prediction of AD with MRI-based hippocampal volume in mild cognitive impairment. Neurology. 1999;52:1397–403. doi: 10.1212/wnl.52.7.1397. [DOI] [PMC free article] [PubMed] [Google Scholar]
- 16.Frisoni GB, Jack CR. Harmonization of magnetic resonance-based manual hippocampal segmentation: a mandatory step for wide clinical use. Alzheimers Dement. 2011;7:171–4. doi: 10.1016/j.jalz.2010.06.007. [DOI] [PubMed] [Google Scholar]
- 17.Boccardi M, Ganzola R, Bocchetta M, Pievani M, Redolfi A, Bartzokis G, et al. Survey of protocols for the manual segmentation of the hippocampus: preparatory steps towards a joint EADC-ADNI harmonized protocol. J Alzheimers Dis. 2011;26(Suppl 3):61–75. doi: 10.3233/JAD-2011-0004. [DOI] [PMC free article] [PubMed] [Google Scholar]
- 18.Boccardi M, Bocchetta M, Apostolova LG, et al. Establishing MRI orientation for the EADC-ADNI manual hippocampal segmentation protocol. J Neuroimaging. 2014;24:509–14. doi: 10.1111/jon.12065. [DOI] [PubMed] [Google Scholar]
- 19.Boccardi M, Bocchetta M, Apostolova LG, Barnes J, Bartzokis G, Corbetta G, et al. Delphi definition of the EADC-ADNI Harmonized Protocol for hippocampal segmentation on magnetic resonance. Alzheimers Dement. 2014 doi: 10.1016/j.jalz.2014.02.009. http://dx.doi.org/10.1016/jjalz.2014.02.009. [DOI] [PMC free article] [PubMed]
- 20.Boccardi M, Bocchetta M, Ganzola R, Robitaille N, Redolfi A, Duchesne S, et al. Operationalizing protocol differences for EADC-ADNI manual hippocampal segmentation. Alzheimers Dement. 2013 doi: 10.1016/j.jalz.2013.03.001. http://dx.doi.org/10.1016/jjalz.2013.03.001. [DOI] [PubMed]
- 21.Bocchetta M, Boccardi M, Ganzola R, Apostolova LG, Preboske GM, Wold D, et al. Benchmark labels of the EADC-ADNI Harmonized Protocol for hippocampal segmentation on magnetic resonance. Alzheimers Dement. 2013 http://dx.doi.org/10.1016/jjalz.2013.12.019.
- 22.Duchesne S, Valdivia F, Robitaille N, Valdivia FA, Bocchetta M, Boccardi M, et al. Certification platform for the EADC-ADNI Harmonized Protocol for Hippocampal Segmentation on magnetic resonance. Alzheimers Dement. Submitted. [Google Scholar]
- 23.Bocchetta M, Boccardi M, Ganzola R, Apostolova LG, Preboske G, Wolf D, et al. Harmonized benchmark labels of the hippocampus on MR: the EADC-ADNI project. Alzheimers Dement. 2014 doi: 10.1016/j.jalz.2013.12.019. in press. [DOI] [PubMed] [Google Scholar]
- 24.Frisoni GB, Jack CR, Bocchetta M, Bauer C, Frederiksen KS, Liu Y, et al. The EADC-ADNI Harmonized Protocol for manual hippocampal segmentation on magnetic resonance: evidence of validity. Alzheimers Dement. 2014 doi: 10.1016/j.jalz.2014.05.1756. [DOI] [PMC free article] [PubMed] [Google Scholar]
- 25.Nelson PT, Alafuzoff I, Bigio EH, Bouras C, Braak H, Cairns NJ, et al. Correlation of Alzheimer disease neuropathologic changes with cognitive status: a review of the literature. J Neuropathol Exp Neurol. 2012;71:362–81. doi: 10.1097/NEN.0b013e31825018f7. [DOI] [PMC free article] [PubMed] [Google Scholar]
- 26.Nelson PT, Braak H, Markesbery WR. Neuropathology and cognitive impairment in Alzheimer disease: a complex but coherent relationship. J Neuropathol Exp Neurol. 2009;68:1–14. doi: 10.1097/NEN.0b013e3181919a48. [DOI] [PMC free article] [PubMed] [Google Scholar]
- 27.Whitwell JL, Dickson DW, Murray ME, Weigand SD, Tosakulwong N, Senjem ML, et al. Neuroimaging correlates of pathologically defined subtypes of Alzheimer's disease: a case-control study. Lancet Neurol. 2012;11:868–77. doi: 10.1016/S1474-4422(12)70200-4. [DOI] [PMC free article] [PubMed] [Google Scholar]
- 28.Whitwell JL, Josephs KA, Murray ME, Kantarci K, Przybelski SA, Weigand SD, et al. MRI correlates of neurofibrillary tangle pathology at autopsy: a voxel-based morphometry study. Neurology. 2008;71:743–9. doi: 10.1212/01.wnl.0000324924.91351.7d. [DOI] [PMC free article] [PubMed] [Google Scholar]
- 29.Arnold SE, Hyman BT, Flory J, Damasio AR, Van Hoesen GW. The topographical and neuroanatomical distribution of neurofibrillary tangles and neuritic plaques in the cerebral cortex of patients with Alzheimer's disease. Cereb Cortex. 1991;1:103–16. doi: 10.1093/cercor/1.1.103. [DOI] [PubMed] [Google Scholar]
- 30.Bobinski M, Wegiel J, Wisniewski HM, Tarnawski M, Reisberg B, Mlodzik B, et al. Atrophy of hippocampal formation subdivisions correlates with stage and duration of Alzheimer disease. Dementia. 1995;6:205–10. doi: 10.1159/000106948. [DOI] [PubMed] [Google Scholar]
- 31.Schonheit B, Zarski R, Ohm TG. Spatial and temporal relationships between plaques and tangles in Alzheimer-pathology. Neurobiol Aging. 2004;25:697–711. doi: 10.1016/j.neurobiolaging.2003.09.009. [DOI] [PubMed] [Google Scholar]
- 32.Braak H, Braak E. Staging of Alzheimer-related cortical destruction. Int Psychogeriatr. 1997;9(Suppl 1):257–61. discussion 69–72. [PubMed] [Google Scholar]
- 33.Braak H, Braak E, Bohl J. Staging of Alzheimer-related cortical destruction. Eur Neurol. 1993;33:403–8. doi: 10.1159/000116984. [DOI] [PubMed] [Google Scholar]
- 34.Braak H, Braak E. Neuropathological staging of Alzheimer-related changes. Acta Neuropathol. 1991;82:239–59. doi: 10.1007/BF00308809. [DOI] [PubMed] [Google Scholar]
- 35.Braak H, Braak E. Development of Alzheimer-related neurofibrillary changes in the neocortex inversely recapitulates cortical myelogenesis. Acta Neuropathol. 1996;92:197–201. doi: 10.1007/s004010050508. [DOI] [PubMed] [Google Scholar]
- 36.Mirra SS, Gearing M, McKeel DW, Jr, Crain BJ, Hughes JP, van Belle G, et al. Interlaboratory comparison of neuropathology assessments in Alzheimer's disease: a study of the Consortium to Establish a Registry for Alzheimer's Disease (CERAD) J Neuropathol Exp Neurol. 1994;53:303–15. doi: 10.1097/00005072-199405000-00012. [DOI] [PubMed] [Google Scholar]
- 37.Zarow C, Vinters HV, Ellis WG, Weiner MW, Mungas D, White L, et al. Correlates of hippocampal neuron number in Alzheimer's disease and ischemic vascular dementia. Ann Neurol. 2005;57:896–903. doi: 10.1002/ana.20503. [DOI] [PMC free article] [PubMed] [Google Scholar]
- 38.West MJ, Gundersen HJ. Unbiased stereological estimation of the number of neurons in the human hippocampus. J Comp Neurol. 1990;296:1–22. doi: 10.1002/cne.902960102. [DOI] [PubMed] [Google Scholar]
- 39.Harding AJ, Halliday GM, Kril JJ. Variation in hippocampal neuron number with age and brain volume. Cereb Cortex. 1998;8:710–8. doi: 10.1093/cercor/8.8.710. [DOI] [PubMed] [Google Scholar]
- 40.Simic G, Kostovic I, Winblad B, Bogdanovic N. Volume and number of neurons of the human hippocampal formation in normal aging and Alzheimer's disease. J Comp Neurol. 1997;379:482–94. doi: 10.1002/(sici)1096-9861(19970324)379:4<482::aid-cne2>3.0.co;2-z. [DOI] [PubMed] [Google Scholar]
- 41.West MJ, Coleman PD, Flood DG, Troncoso JC. Differences in the pattern of hippocampal neuronal loss in normal ageing and Alzheimer's disease. Lancet. 1994;344:769–72. doi: 10.1016/s0140-6736(94)92338-8. [DOI] [PubMed] [Google Scholar]
- 42.von Gunten A, Kovari E, Bussiere T, Rivara CB, Gold G, Bouras C, et al. Cognitive impact of neuronal pathology in the entorhinal cortex and CA1 field in Alzheimer's disease. Neurobiol Aging. 2006;27:270–7. doi: 10.1016/j.neurobiolaging.2005.02.008. [DOI] [PubMed] [Google Scholar]
- 43.Padurariu M, Ciobica A, Mavroudis I, Fotiou D, Baloyannis S. Hippocampal neuronal loss in the CA1 and CA3 areas of Alzheimer's disease patients. Psychiatria Danubina. 2012;24:152–8. [PubMed] [Google Scholar]
- 44.West MJ, Kawas CH, Stewart WF, Rudow GL, Troncoso JC. Hippocampal neurons in pre-clinical Alzheimer's disease. Neurobiol Aging. 2004;25:1205–12. doi: 10.1016/j.neurobiolaging.2003.12.005. [DOI] [PubMed] [Google Scholar]
- 45.Thal DR, Rub U, Schultz C, Sassin I, Ghebremedhin E, Del Tredici K, et al. Sequence of Abeta-protein deposition in the human medial temporal lobe. J Neuropathol Exp Neurol. 2000;59:733–48. doi: 10.1093/jnen/59.8.733. [DOI] [PubMed] [Google Scholar]
- 46.Hof PR, Glannakopoulos P, Bouras C. The neuropathological changes associated with normal brain aging. Histol Histopathol. 1996;11:1075–88. [PubMed] [Google Scholar]
- 47.Giannakopoulos P, Hof PR, Mottier S, Michel JP, Bouras C. Neuro-pathological changes in the cerebral cortex of 1258 cases from a geriatric hospital: retrospective clinicopathological evaluation of a 10-year autopsy population. Acta Neuropathol. 1994;87:456–68. doi: 10.1007/BF00294172. [DOI] [PubMed] [Google Scholar]
- 48.Back SA, Kroenke CD, Sherman LS, Lawrence G, Gong X, Taber EN, et al. White matter lesions defined by diffusion tensor imaging in older adults. Ann Neurol. 2011;70:465–76. doi: 10.1002/ana.22484. [DOI] [PMC free article] [PubMed] [Google Scholar]
- 49.Benveniste H, Einstein G, Kim KR, Hulette C, Johnson GA. Detection of neuritic plaques in Alzheimer's disease by magnetic resonance microscopy. Proc Natl Acad Sci U S A. 1999;96:14079–84. doi: 10.1073/pnas.96.24.14079. [DOI] [PMC free article] [PubMed] [Google Scholar]
- 50.Dhenain M, Privat N, Duyckaerts C, Jacobs RE. Senile plaques do not induce susceptibility effects in T2*-weighted MR microscopic images. NMR Biomed. 2002;15:197–203. doi: 10.1002/nbm.760. [DOI] [PubMed] [Google Scholar]
- 51.Ekstrom AD, Bazih AJ, Suthana NA, Al-Hakim R, Ogura K, Zeineh M, et al. Advances in high-resolution imaging and computational unfolding of the human hippocampus. NeuroImage. 2009;47:42–9. doi: 10.1016/j.neuroimage.2009.03.017. [DOI] [PMC free article] [PubMed] [Google Scholar]
- 52.Zeineh MM, Engel SA, Thompson PM, Bookheimer SY. Unfolding the human hippocampus with high resolution structural and functional MRI. Anat Rec. 2001;265:111–20. doi: 10.1002/ar.1061. [DOI] [PubMed] [Google Scholar]
- 53.Pluta J, Yushkevich P, Das S, Wolk D. In vivo analysis of hippocampal subfield atrophy in mild cognitive impairment via semiautomatic segmentation of T2-weighted MRI. J Alzheimers Dis. 2012;31:85–99. doi: 10.3233/JAD-2012-111931. [DOI] [PMC free article] [PubMed] [Google Scholar]
- 54.Yassa MA, Mattfeld AT, Stark SM, Stark CE. Age-related memory deficits linked to circuit-specific disruptions in the hippocampus. Proc Natl Acad Sci USA. 2011;108:8873–8. doi: 10.1073/pnas.1101567108. [DOI] [PMC free article] [PubMed] [Google Scholar]
- 55.Mueller SG, Weiner MW. Selective effect of age, Apo e4, and Alzheimer's disease on hippocampal subfields. Hippocampus. 2009;19:558–64. doi: 10.1002/hipo.20614. [DOI] [PMC free article] [PubMed] [Google Scholar]
- 56.Amaral R, Augustinack JC, Bender AR, et al. Quantitative comparison of 21 protocols for labeling hippocampal subfields and parahippocampal cortical subregions in in vivo MRI: towards developing a Harmonized Segmentation Protocol. Neuroimage. 2014 doi: 10.1016/j.neuroimage.2015.01.004. Ms. No.: NIMG-14–2271,I revision. [DOI] [PMC free article] [PubMed] [Google Scholar]
Associated Data
This section collects any data citations, data availability statements, or supplementary materials included in this article.