

Abstract
Introduction
Pompe disease is a progressive disease that affects skeletal muscles and leads to loss of ambulation. We investigated the activation of the tibialis anterior (TA) in late onset Pompe disease (LOPD) individuals during maximal voluntary contraction (MVC) and evoked involuntary responses.
Methods
Four LOPD patients and matched control subjects performed MVC of the TA using dorsiflexion and TA evoked responses. Activation of the TA was recorded with surface EMG.
Results
The Pompe patients exhibited greater power at frequencies below 60 Hz and reduced power above 100 Hz. They exhibited reduced increase in M-wave and prolonged M-wave latency and duration in response to stimulation.
Discussion
These results provide evidence that LOPD individuals have an altered activation pattern of the TA during maximal contractions. The observed activation pattern may reflect impairments in voluntary command, neuromuscular junction pathology, or compensatory drive due to a reduced number of functional motoneurons.
Keywords: Pompe disease, Glycogen Storage disease, Skeletal Muscle, Modulation, Motoneuron
Introduction
Pompe disease is rare; it occurs in approximately 1 per 40,000 births. It is a progressive and often fatal neuromuscular disorder resulting from mutation in the gene for acid alpha-glucosidase (GAA), an enzyme necessary to degrade lysosomal glycogen. Weakness is the principal clinical feature in individuals with Pompe disease, due mainly to muscle pathology. In fact, there is evidence that Pompe patients exert approximately 38 % maximal force relative to controls in the lower extremity 1. Nonetheless, little is known about their ability to activate the muscle maximally. In this study, we compared the activation of muscle during maximal contractions in individuals diagnosed with Pompe disease and control subjects.
The clinical spectrum of disease is extremely broad. Juvenile or adult-onset disease occurs after early childhood and manifests in skeletal muscles with a limb-girdle pattern of weakness and diaphragm paralysis. Skeletal muscle weakness in late-onset Pompe disease (LOPD) typically affects lower limbs and axial muscles and results in loss of ambulation and wheelchair dependence 2,3. Additional insight has been gained from animal models. Plantar and dorsal muscle masses are approximately 20% less in the AGLU-/- mouse compared with controls 4-6. In addition, absolute maximal plantarflexion and dorsiflexion torque during single tetanic (i.e. supramaximal) contraction is 53% and 49% lower in AGLU-/- mice than controls, respectively. When normalized to muscle mass, the decline in maximal torque of plantar and dorsiflexors of this Pompe mouse model amounts to 39% and 36%, respectively 4. Hesselink, et.al. 4 proposed that loss of skeletal muscle mass cannot fully account for the decline in muscular force and that an additional factor exerting a negative effect on mechanical performance should be considered.
Our hypothesis is that the weakness observed in Pompe disease is the combined effect of muscular and neural pathology. This hypothesis is supported by the following 2 sets of evidence. First, there are several reports of abnormal spontaneous activity and muscle activation during voluntary or evoked responses in Pompe disease patients. For example, Hobson-Webb and colleagues 7 demonstrated spontaneous activity including fibrillation potentials, positive sharp waves, complex repetitive discharges, abnormal nerve conduction (23% of children), and early recruitment of motor unit potentials (53% of children). Although Hobson-Webb, et.al. 7 attribute these EMG abnormalities only to a primary muscle disorder, several authors have suggested a neurogenic origin, including central or peripheral structures 8-12. Neurogenic involvement is also supported by muscle biopsies, which reveal neurogenic atrophy with fiber type grouping and target or targetoid fibers 8,9. Second, glycogen accumulation in the central nervous system, in both human and animal models of Pompe disease 13-18, is associated with apoptosis in cell culture 19. Spinal neurons seem to be particularly susceptible to excessive glycogen accumulation. The arguments that neural impairments contribute to respiratory and peripheral muscle dysfunction are summarized in our recent review paper 20.
Thus, although LOPD patients exert significantly less lower limb muscle force than control subjects 1, the exact mechanism of the deficits in maximal activation are not known. The purpose of this study was to determine whether tibialis anterior muscle activity, as assessed with surface electromyography, differs between LOPD patients and control individuals during maximal voluntary contractions and evoked responses, thereby offering a further explanation of the cause of weakness in the disease. Our hypothesis is that LOPD patients would exhibit altered tibialis anterior muscle activity during maximal voluntary contractions and prolonged M-wave latency and duration in response to magnetic stimulation of the fibular nerve. To achieve this objective, we compared the activation of muscle during maximal contractions in individuals with LOPD and controls.
Methods
Participants
Four subjects with the diagnosis of LOPD (24.5 ± 10.08 years, 4 women) and four controls (31 ± 8.67 years, 2 women) volunteered to participate. All LOPD participants could complete the six-minute walk test (6MWT), except for 1 subject who was ambulatory only for short distances and wheelchair-dependent for long distances (Table 1). All Pompe subjects in this study were receiving standard of care enzyme replacement therapy (ERT) infusions at the time of study participation. The Institutional Review Board at the University of Florida approved the procedures, and subjects provided written informed consent before participating.
Table 1. Subject characteristics.
| Subjects | Sex | Age (years) | Age at diagnosis (years) | 6MWT (meters) |
|---|---|---|---|---|
| Pompe disease patients | ||||
| P18 | Woman | 15 | 12 | 670 |
| P19 | Woman | 19 | 16 | 665 |
| P26 | Woman | 38 | 35 | NA |
| P44 | Woman | 26 | 26 | 579.12 |
| Average | 24.5(±10.08) | 22.2(±10.34) | 638.03(±51.09) | |
| Controls | ||||
| H01 | Woman | 32 | NA | NA |
| H02 | Woman | 42 | NA | NA |
| H03 | Male | 29 | NA | NA |
| H04 | Male | 21 | NA | NA |
| Average | 31 (±8.67) | |||
Experimental protocol
Each subject participated in 1 experimental session that lasted about an hour. Two tests were performed: 1) MVC of the tibialis anterior during dorsiflexion isometric contraction; 2) magnetic stimulation of the common fibular nerve. All tests were performed bilaterally. Activation of the tibialis anterior was recorded with surface EMG.
Maximal Voluntary Isometric Contraction (MVC)
We investigated the maximal activation of the tibialis anterior muscle while subjects exerted a maximal voluntary isometric contraction during ankle dorsiflexion of the left and right limbs (MVC). Subjects were instructed to increase ankle dorsiflexion force from baseline to maximum over 3 seconds and then to maintain the maximum force for 7 seconds. This procedure allows for identification of a more conservative MVC that reflects the ability to maintain an isometric contraction. Three trials were performed with 1 minute of rest between trials.
Magnetic stimulation of the common fibular nerve
We investigated involuntary evoked responses by studying the M-wave generated by magnetic stimulation of the common fibular nerve. Stimulation was delivered using a single pulse, monophasic stimulator Magstim 2002 (©2013 Magstim, Spring Gardens, Whitland, Carmarthenshire, SA34 0HR, UK) and a double 25mm coil (Peak Magnetic Field Strength − Tesla = 4). The M-wave was generated in response to stimulation of the common fibular nerve approximately 1cm posterior to the fibular head at progressively increasing intensities. We delivered 5 stimuli in 5% increments beginning at an intensity of 40% and increasing to 100% of stimulator output for both the right and left fibular nerves.
Muscle Activity
Tibialis anterior muscle activity was recorded with disposable bipolar surface EMG electrodes (Covidien/Kendall 31078135 Medi-Trace™ 200 Series Adult Electrodes). The location for the electrode was selected according to the European Recommendations for Surface Electromyography 21. The recording electrode was placed in line with the muscle fibers. The reference electrode was placed over the lateral malleolus of the fibula. The EMG signal was sampled at 2 kHz with PowerLab (ADInstruments), band-pass filtered at 10-500 Hz, and stored digitally on a personal computer.
Data analysis
Data were analyzed off-line using LabChart® (LabChart Pro V7) and custom-written programs in Matlab® (Math Works™ Inc., Natick, Massachusetts, USA).
Maximal Voluntary Isometric Contraction (MVC)
The EMG signal during the MVC tests (Figure 1 top row) was analyzed from 3-7 s to exclude the initial adjustments by the subject (0-3 s). The EMG signal was bandpass filtered from 10-500 Hz and detrended. Fourier analysis (Figure 1 bottom row) was performed to quantify the power spectrum of the EMG signal 22. For statistical comparison, the frequency data of the EMG signal was divided into the following frequency bands: 10-35, 35-60, 60-100, 100-150, and 150-200 Hz. Our interest was primarily the sub-100Hz bands, because power in these frequency bands reflects modulation of the motor neuron pool and is not associated with the shape of the action potential, which occurs primarily above 100 Hz 23-25. Specifically, some bands (13-30 and 30-60Hz) have been associated recently with changes in voluntary effort 23. The power in each frequency band was normalized to the total power from 10-200 Hz [(power in each band/total power from 10-200Hz) × 100].
Figure 1. Raw EMG and power spectrum of EMG during MVC.
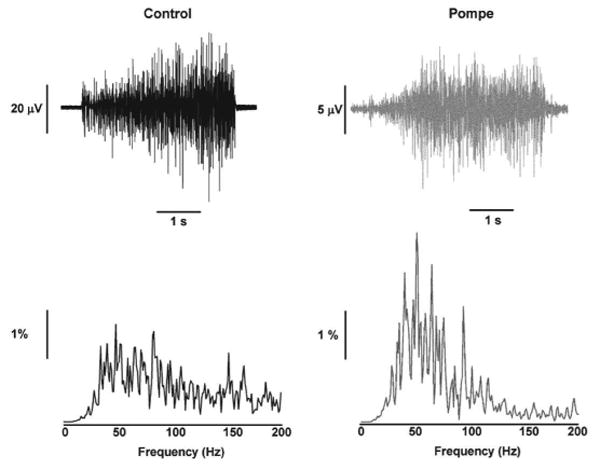
A representative example of the raw EMG recorded during MVC (top row) and power spectrum of the EMG (bottom row) from a control (left column) and a Pompe individual (right column).
Magnetic stimulation of the common fibular nerve
For each subject we analyzed the peak-to-peak amplitude of the M-wave at each stimulation intensity for each leg. M-wave peak amplitudes of 3 trials were averaged together and used to reconstruct the recruitment curve of the M-wave. We also calculated the M-wave increase, defined as the difference between the peak-to-peak amplitude at 100% and 40% stimulation output. Latency and duration of the MEP were also calculated.
Statistical analysis
We used an independent t-test to compare the M-wave amplitude at 100% stimulation, the M-wave increase, the M-wave latency, and M-wave duration in controls and Pompe patients. The values of the 2 legs were averaged together, because they did not differ significantly from each other. We used a mixed 4-factor repeated measures ANOVA (2 groups × 2 legs × 3 trials × 5 frequency bands) to compare the interference EMG power across the left and right leg, 3 trials, and 5 frequency bands (10-35, 35-60, 60-100, and 100-200 Hz) in controls and Pompe patients.
A stepwise multiple linear regression model was used to establish the association between M-wave amplitude and modulation of the interference EMG during the MVC trial. The goodness-of-fit of the model was given by the squared multiple correlation (R2), Durbin Watson statistic and part correlation coefficients that demonstrate the unique contribution of each predictor to the criterion variable.
Analyses were performed with the IBM SPSS Statistics 21.0 statistical package (IBM Corp., Armonk, NY, USA). The alpha level for all statistical tests was 0.05. Data are reported as mean ± SD in the text and mean ± standard error of the mean (SEM) in the figures.
Results
Modulation of maximal muscle activity
We quantified the modulation of tibialis anterior muscle activity during MVC with the power spectrum of the EMG signal at different frequency bands from 10-200 Hz. There was a significant main effect for frequency band for the normalized power spectrum of the interference EMG (F4,24=11.04, P < 0.05). This finding demonstrates that the normalized power in maximal EMG varied with frequency. Most importantly, there was a significant interaction between the group and frequency band for the normalized power spectrum of EMG (F4,24=3.87, P < 0.05; Figure 2). Post hoc analysis reveals that the Pompe patients had greater power from 10-60 Hz and lower power from 100-200 Hz compared with controls.
Figure 2. Power spectrum of the EMG during MVC in healthy and Pompe individuals.
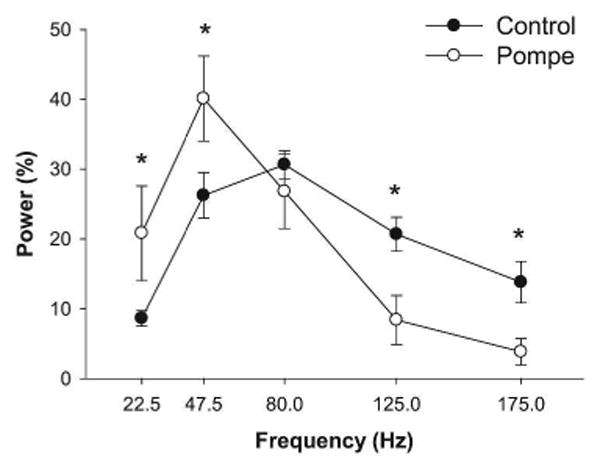
The overall results of the EMG power spectrum during MVC. Pompe individuals exhibited greater power from 10-60 Hz and lower power from 100-200 Hz compared with controls.
Evoked responses
We compared the evoked responses of the tibialis anterior muscle activity for controls and Pompe disease subjects. The M-wave analysis demonstrated the following: 1) the absolute M-wave amplitude at 100% stimulation output was lower (2.48±1.22 mV) in Pompe disease subjects compared with controls (4.14 ± 1.98 mV; Figure 3A); 2) the M-wave increase was lower (t6=-2.3, P=0.029) in Pompe disease subjects (1.72 ± 0.93 mV) compared with controls (3.8 ± 1.51 mV) (Figure 3B); 3) the latency of the M-wave was longer (t6=2.1, P=0.04) in Pompe disease subjects (3.47 ± 0.72 mms) compared with controls (2.64 ± 0.33 mms) (Figure 3C); 4) the duration of the M-wave was longer (t6=1.7, P=0.069) in Pompe disease subjects (26.49 ± 10.02 mms) than in controls (17.66 ± 2.56 mms) (Figure 3C).
Figure 3. M-wave in controls and Pompe disease subjects.
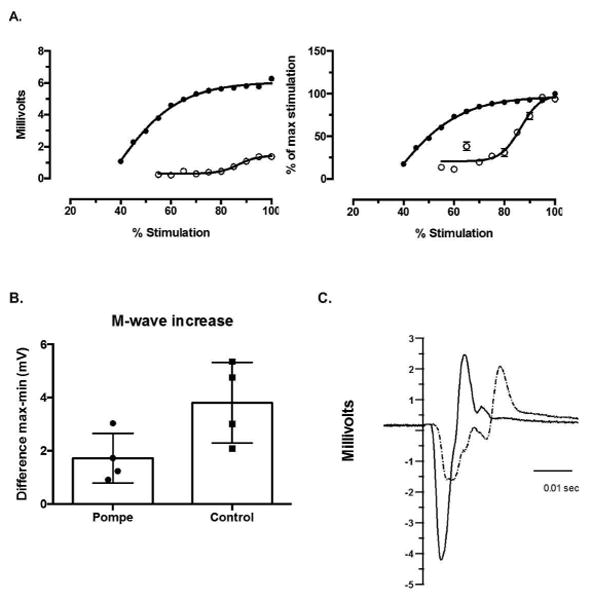
Panel A shows an example of the recruitment curve of the M-wave at each stimulation intensity for a healthy control (filled circles) and a Pompe disease subject (open circles). The left plot shows the absolute M-wave amplitude, and the right plot shows the normalized M-wave to the M-wave at maximum stimulation. The amplitude and the rate of increase of the M-wave is higher for the healthy individual relative to the Pompe individual. Panel B shows the M-wave increase (quantified as the maximum M-wave – minimum M-wave value) of the 4 Pompe disease and the 4 control subjects. The increase of the M-wave is higher for healthy individuals relative to the Pompe individuals. Panel C is an example of M-wave at 100% of Magstim output for a Pompe subject (dashed line) and a control subject (solid line). The Pompe subject has a more complex wave with prolonged duration and latency associated with a decreased peak-to-peak amplitude compared with the control subject.
Relation between M-wave amplitude and EMG power
The M-wave increase with increased stimulation of the peripheral nerve is associated with additional recruitment of motor unit potentials. To determine the frequency bands in the EMG signal during maximal contractions that were associated with the motor unit number we performed a multiple linear regression analysis for both groups. The increase in EMG power from 100-200 Hz was associated with greater rate of increase in M-wave (R2 = 0.43) (Figure 4). As hypothesized, this result demonstrates that the EMG power from 100-200 Hz, is related to the size of the motor neuron pool.
Figure 4. Relation between M-wave increase and EMG power.
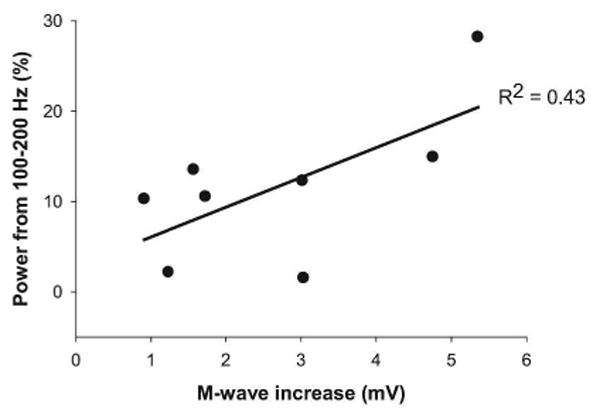
The M-wave increase was correlated positively with the power in the EMG signal from 100-200 Hz.
Discussion/Conclusion
The findings in this study provide novel evidence that maximal activation of muscle in individuals with Pompe disease differs from control subjects. The Pompe disease subjects had prolonged M-wave latency and duration associated with reduced M-wave amplitude following stimulation. In addition, we found that EMG power is higher below 60 Hz and lesser above 100 Hz in Pompe disease individuals. Altered activation of muscle during maximal contractions may reflect an altered voluntary drive from higher centers, likely in response to loss of motor neurons in the spinal cord. Future studies should focus on determining whether altered muscle activation is in response to muscle pathology or to changes at higher centers.
Altered activation of the tibialis anterior muscle
The power spectrum of the EMG during maximal tibialis anterior contractions was different for Pompe disease subjects and controls. Specifically, we found that the Pompe subjects exhibited greater power at frequencies below 60 Hz and lesser power at frequencies above 100 Hz.
There is evidence that power below 60 Hz in the surface EMG during sub-maximal 23 and maximal contractions 26 may reflect changes in voluntary drive in healthy volunteers. Further, reduced power in surface EMG has been observed in a variety of neurological diseases, for example in stroke 27 and neuropathies 28. The increased power below 60 Hz in Pompe subjects may reflect a stronger drive to the motorneuron pool of the tibialis anterior. The stronger drive may be an adaptation to the loss of motor units and an effort to increase force from the tibialis anterior. We provide indirect evidence for a decreased number of motor units in the tibialis anterior for the Pompe subjects. Specifically, they had decreased absolute M-wave amplitude following stimulation and a reduced magnitude of increase in the M-wave. The M-wave reflects summation of the stimulated motor units 29,30 and therefore the amplitude is believed to be proportional to the available number of motor units. The magnitude of increase in the M-wave with increasing stimulation intensity reflects the recruitment of motor units. Pompe subjects, therefore, appear to have fewer available motor units in the tibialis anterior and recruit them slower than controls. Furthermore, the M-wave increase was positively associated with power from 100-200 Hz, which is considered to be related to the shape of the motor unit action potential. Lower power within this band would reflect fewer numbers of motor unit action potentials recorded, which was our finding for the Pompe subjects relative to the controls (Figure 2). We recognized that magnetic stimulation might not elicit a maximal compound muscle action potential compared to electrical stimulation. However, our data suggest that all subjects reached a plateau at 100% magnetic stimulation output. Additionally, we found that electrical stimulation produced a higher level of discomfort compared to magnetic stimulation.
We used young adults as the control group and recognize that we did not exactly match for gender and age. However, we are unaware of any evidence that this will add any bias in the interpretation of the results.
These findings, therefore, support our hypothesis that decreased strength in Pompe disease is not associated with muscle pathology in isolation. Altered activation of the tibialis anterior muscle during maximal contractions provides evidence that there is neural involvement in Pompe disease. Nonetheless, the our findings cannot distinguish whether altered activation of muscle reflects impairments related to voluntary command, the neuromuscular junction, or a compensatory change in drive resulting from reduced size of the MN pool. Future studies are underway to distinguish these additional mechanisms.
Clinical relevance
These observations raise important considerations for the management of Pompe disease. The current approach to treatment is to replace GAA activity in muscle by ERT, which consists of bi-weekly infusion of human GAA (Myozyme®) and was approved by the FDA in 2006. However, ERT does not effectively target GAA deficiency and glycogen accumulation in the nervous system, since it does not cross the brain-blood barrier. These findings underline the unmet need of alternative therapeutic approaches that efficiently target the neural component of Pompe disease.
In summary, our findings provide evidence that Pompe disease patients have altered activation of the tibialis anterior muscle during maximal contractions compared with controls. This finding is critical for understanding the complete pathophysiology in Pompe disease, since it provides evidence that muscle weakness is not related solely to muscle pathology but also to altered neural activation. Future studies will help to distinguish whether altered activation of muscle reflects impairments related to voluntary command, the neuromuscular junction, or a compensatory change in drive resulting from reduced size of the MN pool.
Acknowledgments
This study was supported by grants from the National Institute of Health NHLBI P01 HL59412 [B.J.B], NICHDK12HD055929-02 [B.K.S.].
National Institute on Aging Grant R01 AG-031769 [E.A. C].
Sanofi-aventis Genzyme I.D. 43569 [M.C].
Abbreviations
- TA
tibialis anterior
- LOPD
late-onset pompe disease
- MVC
maximal voluntary contraction
- GAA
acid alpha-glucosidase
- AGLU
acid 1-4 a glucosidase
- 6MWT
six-minute walk test
- ERT
enzyme replacement therapy
- EMG
electromyography
- FDA
food and drug administration
Footnotes
Conflict of interests: The authors report no conflicts of interest related to this work.
References
- 1.van der Ploeg AT, Clemens PR, Corzo D, Escolar DM, Florence J, Groeneveld GJ, et al. A randomized study of alglucosidase alfa in late-onset Pompe's disease. N Engl J Med. 2010;362(15):1396–1406. doi: 10.1056/NEJMoa0909859. [DOI] [PubMed] [Google Scholar]
- 2.Leslie N, Tinkle BT. In: Glycogen Storage Disease Type II (Pompe Disease) Pagon RA, Adam MP, Bird TD, Dolan CR, Fong CT, Stephens K, editors. GeneReviews; Seattle (WA): 1993. [Google Scholar]
- 3.Laforet P, Laloui K, Granger B, Hamroun D, Taouagh N, Hogrel JY, et al. The French Pompe registry. Baseline characteristics of a cohort of 126 patients with adult Pompe disease. Rev Neurol (Paris) 2013;169(8-9):595–602. doi: 10.1016/j.neurol.2013.07.002. [DOI] [PubMed] [Google Scholar]
- 4.Hesselink RP, Gorselink M, Schaart G, Wagenmakers AJ, Kamphoven J, Reuser AJ, et al. Impaired performance of skeletal muscle in alpha-glucosidase knockout mice. Muscle Nerve. 2002;25(6):873–883. doi: 10.1002/mus.10125. [DOI] [PubMed] [Google Scholar]
- 5.Hesselink RP, Schaart G, Wagenmakers AJ, Drost MR, van der Vusse GJ. Age-related morphological changes in skeletal muscle cells of acid alpha-glucosidase knockout mice. Muscle Nerve. 2006;33(4):505–513. doi: 10.1002/mus.20482. [DOI] [PubMed] [Google Scholar]
- 6.Hesselink RP, Van Kranenburg G, Wagenmakers AJ, Van der Vusse GJ, Drost MR. Age-related decline in muscle strength and power output in acid 1-4 alpha-glucosidase knockout mice. Muscle Nerve. 2005;31(3):374–381. doi: 10.1002/mus.20270. [DOI] [PubMed] [Google Scholar]
- 7.Hobson-Webb LD, Dearmey S, Kishnani PS. The clinical and electrodiagnostic characteristics of Pompe disease with post-enzyme replacement therapy findings. Clin Neurophysiol. 2011;122(11):2312–2317. doi: 10.1016/j.clinph.2011.04.016. [DOI] [PubMed] [Google Scholar]
- 8.Schoser BG, Muller-Hocker J, Horvath R, Gempel K, Pongratz D, Lochmuller H, et al. Adult-onset glycogen storage disease type 2: clinico-pathological phenotype revisited. Neuropathol Appl Neurobiol. 2007;33(5):544–559. doi: 10.1111/j.1365-2990.2007.00839.x. [DOI] [PubMed] [Google Scholar]
- 9.Gehlen W, Stefan H. EMG-findings in typ-II-glycogenosis (Pompe's disease, acid maltase deficiency) (author's transl) EEG EMG Z Elektroenzephalogr Elektromyogr Verwandte Geb. 1978;9(1):24–29. [PubMed] [Google Scholar]
- 10.Colomer J, Roig M, Campistol J, Rullan G, Fernandez-Alvarez E. Late infantile form of Pompe's disease. Deficiency of alpha-1,4-glucosidase (acid maltase) An Esp Pediatr. 1984;21(3):250–259. [PubMed] [Google Scholar]
- 11.Horstmann S, Meier C, Mumenthaler M, Gitzelmann R. Myopathy in the adult form of glycogenosis II. Two case reports and review of the literature. Fortschr Neurol Psychiatr. 1990;58(9):343–350. doi: 10.1055/s-2007-1001198. [DOI] [PubMed] [Google Scholar]
- 12.Mills KR. The basics of electromyography. J Neurol Neurosurg Psychiatry. 2005;76(Suppl 2):ii32–35. doi: 10.1136/jnnp.2005.069211. [DOI] [PMC free article] [PubMed] [Google Scholar]
- 13.DeRuisseau LR, Fuller DD, Qiu K, DeRuisseau KC, Donnelly WH, Jr, Mah C, et al. Neural deficits contribute to respiratory insufficiency in Pompe disease. Proc Natl Acad Sci U S A. 2009;106(23):9419–9424. doi: 10.1073/pnas.0902534106. [DOI] [PMC free article] [PubMed] [Google Scholar]
- 14.Gambetti P, DiMauro S, Baker L. Nervous system in Pompe's disease. Ultrastructure and biochemistry. J Neuropathol Exp Neurol. 1971;30(3):412–430. doi: 10.1097/00005072-197107000-00008. [DOI] [PubMed] [Google Scholar]
- 15.Mancall EL, Aponte GE, Berry RG. Pompe's Disease (Diffuse Glycogenosis) with Neuronal Storage. J Neuropathol Exp Neurol. 1965;24:85–96. doi: 10.1097/00005072-196501000-00008. [DOI] [PubMed] [Google Scholar]
- 16.Martin JJ, de Barsy T, van Hoof F, Palladini G. Pompe's disease: an inborn lysosomal disorder with storage of glycogen. A study of brain and striated muscle. Acta Neuropathol. 1973;23(3):229–244. doi: 10.1007/BF00687878. [DOI] [PubMed] [Google Scholar]
- 17.Martini C, Ciana G, Benettoni A, Katouzian F, Severini GM, Bussani R, et al. Intractable fever and cortical neuronal glycogen storage in glycogenosis type 2. Neurology. 2001;57(5):906–908. doi: 10.1212/wnl.57.5.906. [DOI] [PubMed] [Google Scholar]
- 18.Teng YT, Su WJ, Hou JW, Huang SF. Infantile-onset glycogen storage disease type II (Pompe disease): report of a case with genetic diagnosis and pathological findings. Chang Gung Med J. 2004;27(5):379–384. [PubMed] [Google Scholar]
- 19.Vilchez D, Ros S, Cifuentes D, Pujadas L, Valles J, Garcia-Fojeda B, et al. Mechanism suppressing glycogen synthesis in neurons and its demise in progressive myoclonus epilepsy. Nat Neurosci. 2007;10(11):1407–1413. doi: 10.1038/nn1998. [DOI] [PubMed] [Google Scholar]
- 20.Fuller DD, Elmallah MK, Smith BK, Corti M, Lawson LA, Falk DJ, et al. The respiratory neuromuscular system in Pompe disease. Respir Physiol Neurobiol. 2013 doi: 10.1016/j.resp.2013.06.007. [DOI] [PMC free article] [PubMed] [Google Scholar]
- 21.Hermens HJ, F B, M R, Hgg G, Stegeman D, Blok J, Rau G, Disselhorst-Klug C. SENIAM 8: European recommendations for surface electromyography. Roessingh Research and Devepoment; The Netherlands: 1999. [Google Scholar]
- 22.Christou EA, Shinohara M, Enoka RM. Fluctuations in acceleration during voluntary contractions lead to greater impairment of movement accuracy in old adults. J Appl Physiol (1985) 2003;95(1):373–384. doi: 10.1152/japplphysiol.00060.2003. [DOI] [PubMed] [Google Scholar]
- 23.Neto OP, Baweja HS, Christou EA. Increased voluntary drive is associated with changes in common oscillations from 13 to 60 Hz of interference but not rectified electromyography. Muscle Nerve. 2010;42(3):348–354. doi: 10.1002/mus.21687. [DOI] [PMC free article] [PubMed] [Google Scholar]
- 24.Myers LJ, Erim Z, Lowery MM. Time and frequency domain methods for quantifying common modulation of motor unit firing patterns. J Neuroeng Rehabil. 2004;1(1):2. doi: 10.1186/1743-0003-1-2. [DOI] [PMC free article] [PubMed] [Google Scholar]
- 25.Myers LJ, Lowery M, O'Malley M, Vaughan CL, Heneghan C, St Clair Gibson A, et al. Rectification and non-linear pre-processing of EMG signals for cortico-muscular analysis. J Neurosci Methods. 2003;124(2):157–165. doi: 10.1016/s0165-0270(03)00004-9. [DOI] [PubMed] [Google Scholar]
- 26.Rodriguez-Falces J, Izquierdo M, Gonzalez-Izal M, Place N. Comparison of the power spectral changes of the voluntary surface electromyogram and M wave during intermittent maximal voluntary contractions. Eur J Appl Physiol. 2014 doi: 10.1007/s00421-014-2924-8. [DOI] [PubMed] [Google Scholar]
- 27.Li X, Shin H, Zhou P, Niu X, Liu J, Rymer WZ. Power spectral analysis of surface electromyography (EMG) at matched contraction levels of the first dorsal interosseous muscle in stroke survivors. Clin Neurophysiol. 2014;125(5):988–994. doi: 10.1016/j.clinph.2013.09.044. [DOI] [PubMed] [Google Scholar]
- 28.Yaar I, Mitz AR, Pottala EW. Fatigue trends in and the diagnosis of myasthenia gravis by frequency analysis of EMG interference patterns. Muscle Nerve. 1985;8(4):328–335. doi: 10.1002/mus.880080410. [DOI] [PubMed] [Google Scholar]
- 29.Heckman CJ, Enoka RM. Motor unit. Compr Physiol. 2012;2(4):2629–2682. doi: 10.1002/cphy.c100087. [DOI] [PubMed] [Google Scholar]
- 30.Perreault EJ, Day SJ, Hulliger M, Heckman CJ, Sandercock TG. Summation of forces from multiple motor units in the cat soleus muscle. J Neurophysiol. 2003;89(2):738–744. doi: 10.1152/jn.00168.2002. [DOI] [PubMed] [Google Scholar]