

Abstract
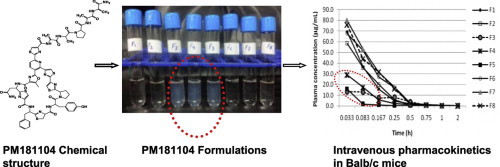
Thiazolyl cyclic peptide antibiotics are known for their poor aqueous solubility and unfavorable pharmacokinetics (PK) and hence pose challenging tasks in developing these antibiotics as clinical candidates. In the current paper, we report a possible way to address these challenges with exemplification of our antibiotic PM181104. The approach was to prepare formulations with known excipients, Polysorbate 80 (Tween 80, T-80) and PEG 400 through their varied stiochiometric combination in appropriate ratio to achieve acceptable osmolarity, pH and particle size of the formulation. Two different sets of formulations were prepared with two distinct average particle diameters ranging from 32.8 to 465.4 nm. First, semi-transparent solutions with a particle size of >100 nm were achieved by keeping concentration of PEG 400 constant at 8% (w/v) and decreasing the amounts of T-80. Second, clear colorless solutions with a particle size of <100 nm were achieved by keeping concentration of T-80 constant at 8% (w/v) and decreasing the amounts of PEG 400. In PK studies, intravenous administration of formulation with particle size <100 nm to mice resulted in a two-fold increase in area under the plasma concentration-time curve (AUClast) and concentration at time zero (C0), there by facilitating the selection of suitable formulation for further efficacy studies.
Keywords: PM181104, Tween 80, PEG 400, Antisolvent precipitation, Nanoparticle size, Pharmacokinetics
Graphical abstract
1. Introduction
The increasing number of infections caused by methicillin-resistant Staphylococcus aureus (MRSA) and vancomycin-resistant enterococci (VRE) is a cause of great concern in antibiotic therapy and predominantly, emerging mechanisms of new resistance, making the next generation of antibiotics largely ineffective. Hence, there exists a need for the development of novel class of antibiotics with novel modes of action to overcome existing resistance mechanisms and to effectively combat these serious pathogens. Lately, thiazolyl cyclic-peptide antibiotics have been emerging as an alternative class of antibiotics. They are known for their potent in vitro antibacterial activity against a wide spectrum of pathogens with their unique mode of action. However, in spite of their potent in vitro antibacterial activity, till date these compounds have not been developed for use in humans due to low aqueous solubility and unfavorable pharmacokinetics [1–4].
We recently have reported a novel thiazolyl cyclic-peptide antibiotic, PM181104 (Fig. 1) from marine microbial source [5,6]. The compound exhibits potent in vitro antibacterial activity against a broad range of Gram-positive bacteria. The minimum inhibitory concentration (MIC) values evaluated for the compound were in nano-molar range. In in vivo studies of PM181104 in a BALB/c murine septicemia model, the compound displayed 100% effective dose (ED100) value of 2.5 mg kg−1 of body weight against MRSA and 10.0 mg kg−1 against VRE, and in tissue or organ-specific infection models showed reduction in bacterial titer comparable to standard antibiotics [5,7]. In the current studies, suitable intravenous (i.v) formulation development approaches have been explored. We consider that the i.v. route of administration facilitates complete bioavailability and rapid action to treat the systemic infections associated with the Gram-positive pathogens. True to the behavior of naturally occurring thiazolyl peptide antibiotics, PM181104 too exhibited poor aqueous solubility. To overcome such difficulty, we made an effort to develop an i.v. formulation using a non-ionic surfactant with co-solvent combination approach [8]. The advantage of this approach is that the combination of surfactant and polymer may provide better protection against solvent-mediated transformation than the surfactant or polymer alone [9]. However, in order to avoid the possible side effects such as anaphylactic response and vascular irritability which may be caused by surfactants, it is far safe to reduce the types and stoichiometric concentration of the stabilizers used [10,11]. Indeed, there is a set-in guideline by the FDA for choosing an inactive ingredient [36]. Therefore, the major focus of our studies was to formulate a dosage form that exhibits in vivo efficacy with a scope to minimize the excipient composition to an acceptable extent. Initial attempts to achieve maximum drug exposure levels, also inherently delivered a proportionately higher concentration of excipients. Hence, there was a scope to bring down the excipient levels in the defined dosage delivery. Towards this effort, we embarked upon studies involving the stoichiometric alteration of two of the excipients namely, T-80 and PEG 400 which fall under generally recognized as safe (GRAS) category, and comparing their associated pharmacokinetics outcomes. We also evaluated the effect of stiochiometric variations in these excipients on the osmolarity, pH as well as particle size of the drug and its implications on in vivo situation. These efforts resulted in the identification of an in vivo efficacious formulation suitable for parenteral administration.
Fig. 1.
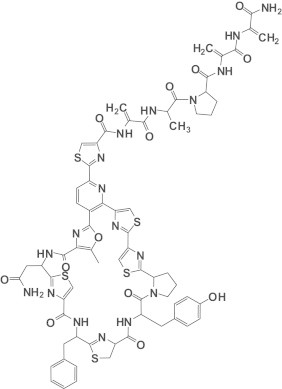
Chemical structure of PM181104.
The current paper describes the detailed studies of the development of an in vivo efficacious formulation using T-80 and PEG 400 and effect of stiochiometric variation of these excipients on osmolarity, pH, particle size of the drug and the associated effect on pharmacokinetics outcomes.
2. Materials and methods
2.1. Materials
PM181104 was isolated and characterized in-house [5]. T-80 and PEG 400 were purchased from Croda Inc., USA. Sterile Water for Injection was supplied by Nirma Ltd., India. Methanol and acetonitrile solvents were of HPLC grade and were procured from Merck.
2.2. HPLC analysis
The reverse phase HPLC method was chosen for the quantitative determination of the PM181104 in the formulations. Standard and formulation samples were diluted with acetonitrile: methanol (1:1; v/v) to obtain a final concentration of 0.1 mg mL−1 and then injected a 10 µL injection volume directly to HPLC system. Agilent 1200 HPLC system (Agilent, USA) with a Kromasil 100 C18 analytical column (150×4.6 mm2, particle size 3.5 µm) was used for the studies. The mobile phase was acetonitrile–water mixture (50:50, v/v). The flow rate was 1.0 mL min−1 and the detection wavelength was set to 309 nm. Percentage assay calculated with respective to the chromatograms of standard and sample area.
2.3. Preparation of PM181104 formulation
PM181104 nanoparticles were prepared by anti-solvent precipitation technique, using water for injection (WFI) as the anti-solvent [12]. By using this method nanoparticles can be manufactured in the absence of mechanical forces which can have influence on peptide stability [13]. For this, the specified amount of T-80 was thoroughly mixed with the specified amount of PEG 400 under vortex followed by sonication, to form the excipient mixture. The prepared excipient mixture was used to dissolve the required amount of PM181104 using sonication carried out with intermittent cooling (to maintain the temperature below 40 °C) until a turbid free solution clear of any undissolved particulate matter was obtained. The resultant clear, colorless and viscous drug excipient mixture was then injected slowly and continuously through drop wise addition using a buret to the anti-solvent under rapid mixing (1000 rpm, magnetic stirrer). Precipitation of the solid drug particles were occurred immediately upon contact with the anti-solvent. The resulting formulation suspension was sterilized by filtering through 0.2 µm filter assembly connected to vacuum. A total of eight formulations were made, and divided into two sets based on their excipient composition. The first set consisted of formulations, made with a reduced concentration of T-80. The second set consisted of reduced concentration of PEG 400. The optimization of the excipient composition in the first set of formulations (F1−F5) was carried out using ternary compositions containing water for injection (WFI), PEG 400 8% (w/v) and a decreasing amounts of T-80 (8–0.05%) while maintaining the final concentration of PM181104 at 0.25 mg mL−1. In the second set, another three formulations (F6–F8) were prepared using ternary compositions containing WFI, T-80 8% (w/v) and a decreasing amounts of PEG 400 (6–0.5%) while retaining the final concentration of the PM181104 at 0.5 mg mL−1. The concentration of the drug in the described formulation was reconfirmed using HPLC analysis.
2.4. Determination of the particle size and polydispersity index
Particle size and polydispersity index (PDI) of the prepared nanoparticles of PM181104 were measured immediately after formulation filtration process by dynamic laser light scattering using particle size analyzer (Delsa Nano C, Nano-Zetasizer, Beckman Coulter, Miami, FL, USA) at back scattering measurement angle of 165°. Samples were not diluted and measured at 25 °C. The measurement was done in triplicate and size d90 was reported.
2.5. Osmolarity, zetapotential and pH measurements
The osmolarity, zetapotential and pH of the prepared formulations of PM181104 were measured using an osmometer (Osmomat 030-3P, Gonotec, Germany), a Delsa Nano HC, Zeta Potential Particle Analyzer (Beckman Coulter Inc., USA) and pH meter (pH Tutor, Eutech Instruments Pte Ltd., Singapore), respectively. Each measurement was performed in triplicate at 25 °C.
2.6. Morphology
The particle morphology of formulation F5 and F6 were evaluated by transmission electron microscopy (TEM) (Model-CM200, Make-PHILIPS). The formulation drops were added to a 300 mesh copper grid, then dried using IR light and then examined by TEM.
2.7. Animals
Male Balb/c mice (18–25 g) bred in-house at Piramal Enterprises Limited, Goregaon, Mumbai, India were used. Mice were maintained in a temperature of (22±2 °C) and humidity (55±5%) controlled room with a 12 h light/dark cycle and free access to standard diet and water. All mice used in this study were not subjected to any form of treatment/medication. Guidelines of Committee for the Purpose of Control and Supervision on Experts on Animals (CPCSEA), Government of India, were followed and the In-house Animal Ethics Committee approved all experimental procedures. Animals were provided food and water ad libitum.
2.8. Pharmacokinetic studies
Mice were randomly and equally divided into eight groups containing 24 mice each. Animals in Groups 1–5 were administered with formulations F1–F5 intravenously at the dose of 2.5 mg kg−1. Animals in Groups 6–8 were administered with formulations F6–F8 intravenously at the dose of 5.0 mg kg−1. The administration was done via tail vein using a 1.0 mL tuberculin syringe equipped with 27 G needle after dilation with ethanol solution (70%). Blood samples (0.5 mL) were collected on ice from three animals at each time point viz. 0.033, 0.083, 0.17, 0.25, 0.50, 0.75, 1 and 2 h post-dose using sodium citrate (10% v/v) as anticoagulant. Plasma was separated by centrifugation of blood samples at 10,000 rpm for 5 min at 4 °C and plasma samples were stored at approximately −70 °C until bioanalysis by LC-MS/MS method.
2.9. Plasma analysis
One hundred micro-liters of mouse plasma sample was extracted with 2.5 mL ethyl acetate on a vortex mixer for 5 min followed by centrifugation for 5 min at 10,000 rpm at 20 °C. The organic layer was transferred into another test tube and was evaporated to dryness under a stream of nitrogen at 35 °C. The samples were reconstituted in 200 µL solution of formic acid (0.7%) in (acetonitrile: methanol: 1:1 v/v) and were vortexed, then transferred into polypropylene vials. From this vial, 10 µL of the sample was injected into the LC-MS/MS system for further analysis.
The samples were analyzed on Instrument Bruker Esquire 4000 LC−MS/MS system. HPLC analysis system conditions were set as follows: Kromasil 100 C18 analytical column (150×4.6 mm2, particle size 3.5 µm) mobile phase: acetonitrile:methanol:water:acetic acid (60:30:10:1 v/v); flow rate of the mobile phase: 0.4 mL min−1; measured wavelength: 309 nm.
2.10. Data analysis
Plasma concentrations were calculated using the Hystar software, version 3.0, Build No. 129.0, Instrument Bruker Esquire 4000. Pharmacokinetic parameters were determined by non-compartmental analysis using WinNonlin Professional version 6.1 (Pharsight Corporation, USA).
3. Results and discussion
3.1. Optimizing the concentration of excipients using particle size screening
In development of suitable formulations for hydrophobic drug candidates, the type of excipients used and their stoichiometric concentrations play a major role in defining the delivery of that drug candidate. The excipient composition influences the particle size of the drug. Since particle size impacts in-vivo efficacy, in our studies we have focused on addressing the excipients used and their stoichiometric optimization for delivery of our in-house antibiotic candidate PM181104. The excipients used in prepared formulations were as per regulatory limits. Yet, our objective was to accomplish reduced concentrations of these excipients in formulations to be at suitable level as excipients are known to be proportionally related to their toxicity [14]. Prior to this, PM181104 was formulated using Cremophor EL. But knowing the toxicity associated with cremophor [15] and its subsequent replacement, in our present work, we selected the two key excipients, identified to be the best excipient combination among all of the hit combinations and their excipient compositions were tested in solubilizing the compound paclitaxel [16] i.e. non-ionic surfactant T-80 along with the non-toxic solvent PEG 400 [17,18]. There were reports, where Cremophor EL was not selected for the formulation due to the adverse effects associated with its parenteral use. Although, it exhibited highest potential to solubilize drug among the non-ionic surfactants T-80 and Solutol HS 15 tested [19]. The pharmacokinetics obtained with T-80 formulations was very different than that with cremophor EL. In fact, due to much more rapid breakdown by esterases, T-80 is a much more favorable component for formulation/solubilization of poorly water soluble agents than Cremophor EL [20]. In the current studies initially we embarked on an effort to decrease T-80 concentration while retaining the PEG 400 concentration at a constant level. In the second effort, we fixed the concentration of T-80 at 8% (w/v) and tried to reduce PEG 400. With reference to former, to determine the effect of decreased concentration of T-80, a set of 5 formulations containing fixed 8% (w/v) PEG 400 and incrementally decreased concentrations of T-80 viz., 8%, 6%, 2%, 1%, 0.05% (w/v) were prepared and labeled as F1–F5. From the results of photon correlation spectroscopic studies of these formulations, it was observed that formulations F1 and F2 were exhibited significant smaller particle size (around 50 nm) and also reduced values of polydispersity index (PDI) (Table 1). The two formulations F1 and F2 with their respective PEG 400: T-80 ratios 8/8% and 8/6% (w/v), respectively, had the proficiency of yielding smaller particle size or nanoparticles of the drug. This may have occurred due to the possible arrest of growth of nucleating crystals by the mentioned surfactant T-80 or polymer PEG 400 through steric or electrostatic mechanism [21]. On the other hand, formulations F3, F4 and F5 with respective PEG 400: T-80 ratios 8/2%, 8/1%, 8/0.05% (w/v) showed significantly higher particle size along with increased PDI (Table 1). The transmission electron microscopic morphological observation obtained for the formulation F5 revealed the higher particle size of the drug in formulation (Fig. 3b). The aggregation seen in formulations (F3 to F5) as a function of decreased concentration of T-80 resulted in the increased particle size and PDI which implies that maintenance of T-80 at 6% (w/v) is the minimum necessary requirement [16], to maintain its steric inhibitory effect on the formation of larger particles (Fig. 2). Other possible mechanism that can be proposed in this context is the existence of PM181104 as a non-ionized solute having better solubility behavior in non-ionic surfactant. As per our observation the effect of non-ionic surfactant concentration on the particle size of the drug and subsequent solubility is in contrast with the experimental observations made by [11].
Table 1.
Formulation characteristics and pharmacokinetic parameters obtained with formulations F1–F5 having fixed concentration of PEG 400 8% (w/v) following intravenous administration to mice at the dose of 2.5 mg kg−1.
| Formulation | T-80 conc. % (w/v) | Particle size D90 (nm)a | Polydispersity index (PDI)a | Zeta potential (mv)b | AUClast (µg h mL−1) | C0 (μg mL−1) | t1/2 (min) |
|---|---|---|---|---|---|---|---|
| F1 | 8 | 37.9±17.2 | 0.028±0.166 | 0.64 | 9.7034 | 106.1201 | 10.032 |
| F2 | 6 | 50.2±7.2 | 0.066±0.100 | −3.18 | 9.0627 | 81.2492 | 11.700 |
| F3 | 2 | 205.7±74.1 | 0.185±0.047 | −6.02 | 4.9812 | 13.7540 | 13.458 |
| F4 | 1 | 291.3±83.2 | 0.156±0.055 | −1.30 | 4.6235 | 41.0294 | 29.472 |
| F5 | 0.05 | 465.4±117.7 | 0.216±0.026 | −4.34 | 2.4780 | 66.5410 | 20.940 |
Values are mean±S.D., n = 3.
Values are average, n = 3.
Fig. 3.
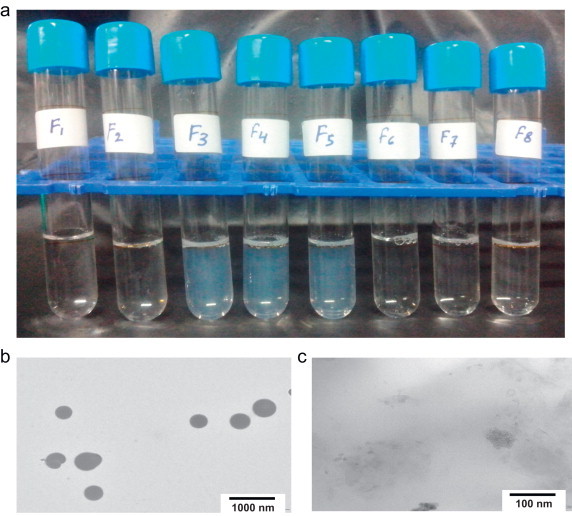
Characterizations of PM181104 formulations (a) the physical appearance of PM181104 in formulations F1–F8; (b) and (c) TEM morphology of formulation F5 (highest particle size) and F6 (lowest particle size).
Fig. 2.
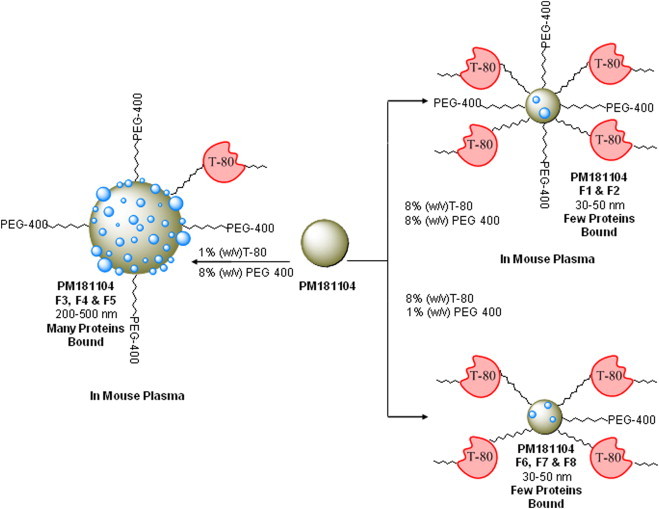
The schematic representation demonstrates the steric hindrance of Tween-80 (T-80) and its influence on (a) particle size generation and (b) the fate of nanoparticles after i.v administration to mouse with varying number of proteins bound (shown as blue spheres on the nanoparticles).
In parallel studies, with reference to determining the effect of reduced concentration of PEG 400, a set of three formulations F6, F7 and F8 with their stiochiometric ratios of T-80: PEG 400 at 8/6,8/1,8/0.5% (w/v) were prepared to check for particle size and solubility of the drug. Surprisingly, the particle size and PDI for all these formulations were significantly small (around 50 nm) and they were almost comparable to the values obtained for F1 and F2 (Table 2). The absence of any precipitation or aggregation even at decreased concentration of PEG 400 indicates that the PEG 400 concentration has no effect what so ever on the particle size and solubility of the drug. This implies that T-80 has an influencing effect on nanoparticle generation due to its high molecular mass (1310 g mol−1), almost equivalent to that of PM181104 (1514 g mol−1). Where as PEG 400 is a low molecular mass (380–420 g mol−1) molecule (Fig. 2). This difference in the molecular mass appears to be having a steric effect on the nanoparticle size and solubility as they have differential effect of adsorption rate on the particle surface which may be a controlling factor in the formulation of nanoparticles [22].
Table 2.
Formulation characteristics and pharmacokinetic parameters obtained with formulations F6–F8 having fixed concentration of T-80 8% (w/v) following intravenous administration to mice at the dose of 5.0 mg kg−1.
| Formulation | PEG 400 conc. % (w/v) | Particle size D90 (nm)a | Polydispersity index (PDI)a | Zeta potential (mv)b | AUClast (µg h mL−1) | C0 (µg mL−1) | t1/2 (min) |
|---|---|---|---|---|---|---|---|
| F6 | 6 | 32.8±21.7 | 0.021±0.133 | −5.49 | 13.351 | 80.825 | 15.06 |
| F7 | 1 | 49.4±29.3 | 0.085±0.028 | −6.18 | 15.369 | 104.919 | 24.168 |
| F8 | 0.5 | 51.5±15.8 | 0.066±0.069 | −4.87 | 14.221 | 108.703 | 19.50 |
Values are mean±S.D., n = 3.
Values are average, n = 3.
3.2. Size measurement and morphology
Physical appearances of the formulated solutions are shown in Fig. 3a. The solutions in the first two glass vials are clear and colorless formulations followed by semi-transparent formulations and then a set of clear and colorless stock of formulations. The particle sizes of the formulations are tabulated in Tables 1 and 2. As it can be seen from the data, clear solutions F1 and F2 show particle size 50 or less than 50 nm.Whereas formulations F3, F4 and F5 with semi-transparent appearance show the particle size of more than 200 nm. The TEM image taken for the formulations F5 and F6 are shown in Fig. 3b and c, respectively. As can be seen from Fig. 3b, the size of the nanoparticles formed in F5 are larger than 400 nm, where as for F6 the particle size observed was around 50 nm or below (Fig. 3c). TEM scans for F5 and F6 are shown in the figure as they represented higher and lower particle size range morphology.
In Table 2, particle size of formulations F6, F7 and F8 (where fixed concentration of T-80 (8% w/v) is maintained with decreased concentration of PEG 400), is approximately below 50 nm. These observations suggest the required concentration of T-80 to get a clear turbid free formulation. Any efforts to reduce its concentration below 6% w/v in the stoichiometry of T-80 and PEG 400 could lead to a turbid formulation and subsequent higher nanoparticle size.
3.3. Osmolarity, zetapotential and pH value
It is essential to maintain isotonicity for the intravenous application of formulations. Non-ionic substances such as glycerol or carbohydrate are recommended for use to maintain isotonicity in formulations. However, addition of salts such as sodium chloride or potassium chloride would result in compression of the diffused layer resulting in a reduction of the zeta potential and consequently electrostatic destabilization [23]. In our experiments we achieved this objective with non-ionic substances such as T-80 and PEG 400. Osmomat with freezing point depression technique was used to measure the osmolarity of the formulations F1 to F8. Formulations F1 and F2 showed higher osmolarity values 0.453 and 0.521 osmol kg−1 respectively (Table 3). Where as F3 to F5 formulations were ranging from 0.325 to 0.412 osmol kg−1 (Table 3). These formulations had osmolarity physiologically similar to mouse blood and tissue ranging from 0.310–0.340 osmol kg−1[24] . No significant change in the osmolarity value was observed with decreasing concentrations of the T-80. On the other hand, formulations F6 to F8 showed osmolarity ranging from 0.270 to 0.107 osmol kg−1 (Table 3). Among these, F6 formulation was closer to the osmolarity value of the mouse blood and tissue, where as, other two formulations F7 and F8 were very much below the required physiological isotonicity value. This indicates that osmolarity increased proportionally with incremental rise in concentrations of PEG 400 and, it is the vital constituent responsible for the osmolarity to the formulations.
Table 3.
Osmolarity and pH values obtained with formulations F1–F8.
| Formulation | T-80 conc.% (w/v) | PEG 400 conc.% (w/v) | Osmolarity (Osmol/kg)a | pH valuea |
|---|---|---|---|---|
| F1 | 8 | 8 | 0.521±0.004 | 5.49±0.29 |
| F2 | 6 | 8 | 0.453±0.005 | 5.03±0.18 |
| F3 | 2 | 8 | 0.336±0.004 | 3.88±0.08 |
| F4 | 1 | 8 | 0.325±0.002 | 3.72±0.10 |
| F5 | 0.05 | 8 | 0.412±0.007 | 3.45±0.06 |
| F6 | 8 | 6 | 0.270±0.003 | 5.42±0.20 |
| F7 | 8 | 1 | 0.156±0.001 | 6.16±0.07 |
| F8 | 8 | 0.5 | 0.107±0.002 | 6.45±0.09 |
Values are mean±S.D., n = 3.
The zeta potential is one of the important parameter that underlines the aggregation behavior of the formulations. Accordingly, formulations F1–F8 were subjected to zeta potential studies to evaluate their aggregation behavior. The data obtained from the studies are shown in Tables 1 and 2. The detailed analysis of the zeta potential values indicates that the formulations F6–F8 carry a reasonably good surface stability. And this observation is in good agreement with other parameters measured for the same series.
The pH value of PM181104 formulations F1 to F8 was in the pH range of 3.40–6.32 (Table 3). It was observed that the pH value was decreased in proportion to the decreased concentrations of T-80. However, these observations were in reverse with the decreasing concentrations of PEG 400. Knowing that the extreme pH (both alkaline and acidic) could be susceptible for peripheral vein rupture, the pH of the infusion solution is generally expected to be between 5 and 9 [25]. Interestingly, here in our studies, all the efficacious formulations fulfilled the pH criteria required for intravenous administration.
3.4. Pharmacokinetic parameters
The plot of plasma concentration vs. time for PM181104 after intravenous administration of formulations F1 to F8 in mice are shown in Fig. 4. Formulations F1 and F2 showed higher plasma exposure of the drug (AUClast averaged above 9.0 µg h mL−1 and C0 averaged above 80 µg h mL−1) are shown in Fig. 5a and b and the corresponding pharmacokinetic parameter values in Table 1. An important component of in vivo performance of nanoparticulate systems is the opsonization and clearance of particles by the mononuclear phagocytic system or the reticuloendothelial system (RES). Opsonization is the process by which a particle becomes covered with the so-called opsonin proteins [26]. The improved behavior of these formulations (F1 and F2) could be due to the stealth associated with smaller particle size of the drug (below 100 nm) that might help to escape the process of opsonization and phagocytosis by reticuloendothelial system (RES) during blood circulation, resulting in higher plasma concentration of the drug (Fig. 2). Moreover, the size of the particle and its surface modification are able to strongly influence the proteins adsorbed on the nanoparticle surface. Lower protein adsorption is seen with smaller nanoparticles (70 nm) than with the larger nanoparticles (≥200 nm) [27,28]. Studies have shown that smaller particle size of the drug have an advantage as is evident from the fact that colloidal drug delivery systems (CDDS) have a tendency to be removed slowly from the blood circulation then the larger particles [10,29]. In vivo efficacy of PM181104 with the formulation F1 in tissue or organ specific infection models (against MRSA and VRE) showed a reduction in the bacterial titer when compared to standard antibiotics (Linezolid and Vancomycin) [5].
Fig. 4.
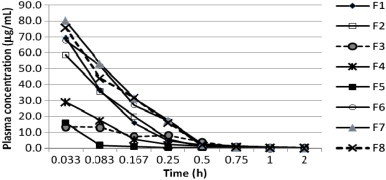
Plasma concentration-time profile of PM181104 following intravenous administration of formulations F1, F2, F3, F4 and F5 (2.5 mg kg−1) and F6, F7 and F8 (5.0 mg kg−1) to BALB/c mice. Data are mean±S.D., n = 3 mice.
Fig. 5.
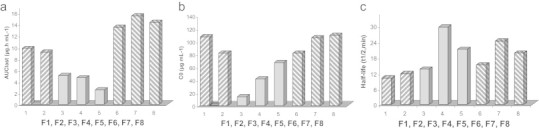
The influence of excipients of formulations F1–F8 (a) area under the plasma concentration-time curve (AUClast) (b) concentration at time zero (C0) (c) plasma half-lives (t1/2).
However unlike the F1 and F2, the situation in case of formulations F3–F5 was different. These formulations showed lower plasma exposure compared to F1 and F2 (AUClast averaged below 5.0 µg h mL−1 and C0 averaged below 70 µg h mL−1) are shown in Fig. 5a and b and the corresponding pharmacokinetic parameter values in Table 1. Knowing that these formulations are semitransparent or relatively turbid and with bigger nanoparticle size (above 200 nm), they might be quickly recognized and phagocytosed by RES in blood circulation (Fig. 2). Pratten and Llyod [30] have described that for a particle size of 30 nm, uptake would occur through pinocytosis where as in case of drug particles more than 100 nm, the process occurs through phagocytosis. Moreover, particle size greater than 300 nm and beyond stealth properties are minimal even in case of appropriate coating of drug [31]. Accordingly, formulations F3–F5 failed to show good efficacy in the systemic infectious models (data not shown) even though, these formulations exhibiting required feature like osmolarity, which is more physiological to mouse blood and tissue. From these observations without any ambiguity it is clear that T-80 has a concentration dependent influence leading to changes in pharmacokinetics of the drug candidate [32,33].
Formulations F6–F8 demonstrated higher plasma exposure values (AUClast averaged above 13.0 µg h mL−1 and C0 averaged above 80 µg h mL−1) are shown in Fig. 5a and b and the corresponding pharmacokinetic parameter values in Table 2. They also exhibited very effective in vivo efficacy against MRSA and VRE. In the BALB/c murine septicemia model one of these formulations (F6) shown osmolarity value close to the mouse blood, displayed an ED100 value of 2.5 mg kg−1 against MRSA and 10.0 mg kg−1 against VRE [5]. It was reported that, to avoid the rapid clearance of nanoparticles from the blood, it is important to block the initial process of opsonization. PEGylation is one of the widely used strategies to prepare stealth particles that minimize or avoid opsonization. PEGylation refers to adsorption, grafting, or covalent attachment of hydrophilic PEG chains on the nanoparticle surface. Covalent attachment or grafting is more effective than simple adsorption of PEG to the particle surface for preventing opsonization [26]. Generally, neutral and hydrophilic particles undergo much lower opsonization than do charged and hydrophobic particles [34]. While PEG is hydrophilic and has a neutral charge, it prevents hydrophobic and electrostatic interactions with the plasma proteins, thus avoiding opsonization. At the same time it also indicates the minimal or negligible role of PEG 400 because of its lack of capability to provide stealth to high molecular weight of PM181104. For the effective stabilization of CDDS, most of the studies showed that the protein adsorption decreased with an increase of polymer molecular weight (MW). Usually, the PEG with an MW of 2 kDa or higher provides better steric hindrance in avoiding opsonization [26] and most of authors supported an efficient MW in the range of 1500–3500 Da [29]. The nanoparticles formed in our studies could be due to simple adsorption of PEG 400 rather than covalent attachment or grafting, unless PEGylation, PEG 400 acts here as a solubilizer rather than stabilizer and have insignificant role in particle size, as well as in pharmacokinetic and dynamic studies. However, there is no or little scope of minimizing the concentration of the PEG 400 due to its significant contribution to the osmolarity in the formulations.
The plasma half life values obtained for PM181104 after intravenous injection of formulations of F1–F8 in mice are shown in Fig. 5c and the corresponding values in Tables 1 and 2. As seen from the data formulations F3 to F5 showed higher half life values. This is in contrast to the observation made with respect to AUC and Co, where these formulations shown lower values for these parameters. Formulations F6–F8 showed proportionately higher plasma half life values, comparable to formulations F1 and F2. On the other hand, the observed higher half life values of F3–F5 could possibly be explained as the nanoparticles taken up by RES might dissolve slowly in the phagocytic cells followed by a slow release of PM181104 into the blood circulation resulting in the higher half life values [35]. However, this observed higher half life values did not translate to higher AUC and Co in these semitransparent formulations. AUC and Co are the important pharmacokinetic parameters that are taken in to consideration for in vivo efficacy of antibiotics than the half life. In case of formulations F3–F5, having seen higher half life one could expect better efficacy, but the observed poor efficacy could be explained to the point that the available PM181104 concentration could be at sub-therapeutic level i.e. below minimum effective concentration (MEC) as much of the drug is slowly released by the phagocytic cells. Although the observed plasma concentrations were lower in case of formulation F6 when compared to formulations F7 and F8, osmolarity is equivalent to the physiological osmolarity of blood. Moreover the pH of the formulation is in the required range for the intravenous administration [25]. The observed transparency or clarity in the formulation F6, and the smaller particle size were additional features that were seen. Accordingly formulation F6 was considered as the best among the series and hence was selected for further in vivo studies.
In summary, using excipients as a tool to modulate the interaction of peptide molecules and physical appearance, photon correlation spectroscopy and transmission electron microscope as means to monitor the intensity of aggregation, we observed that the rate of aggregation of peptides increases significantly under low concentrations of non-ionic surfactant (T-80). These results are in coherence with observed pharmacokinetics, demonstrating that the association of the peptide molecules is a critical event in the plasma exposure levels.
4. Conclusion
Thiazolyl cyclic peptides have been receiving immense interest in alternative antibiotic therapy. They display potent in vitro antibacterial activity against wide spectrum of Gram-positive pathogens (MRSA, VRE etc.) and they are known for their unique mode of action. Yet development of these antibiotics as clinical candidates is limited due to their inherent drawbacks like poor aqueous solubility and unfavorable pharmacokinetics. In the current work, efforts have been put to address these issues associated with one of our in-house thiazolyl peptide antibiotic PM181104. The approach was to develop acceptable formulation for complete efficacy using known and appropriate excipients classified under GRAS category. T-80 and PEG 400 were chosen to develop suitable i.v. formulation with optimized excipient concentrations. Through varying stiochiometric ratio of these excipients, an acceptable i.v. formulation was achieved with improved pharmacokinetics. In development of these acceptable formulations for thiazolyl peptide antibiotic three important and vital parameters are to be considered in to account (i) transparency or clarity of the formulation; (ii) smaller particle size of the formulation and (iii) minimum plasma concentration levels of the formulated antibiotic. Accordingly, findings from the current preclinical studies will play a significant role in developing effective formulation to achieve the desired therapeutic effects in humans in future.
Acknowledgments
We thank Dr. Somesh Sharma, Managing Director, Piramal Life Sciences for his support and encouragement that we received during the course of this work.
References
- 1.Just-Baringo X.J., Albericio F., Álvarez M. Thiopeptide antibiotics: retrospective and recent advances. Mar Drugs. 2014;12:317–351. doi: 10.3390/md12010317. 24445304 [DOI] [PMC free article] [PubMed] [Google Scholar]
- 2.Martín J., da S Sousa T., Crespo G., Palomo S., González I., Tormo J.R., de la Cruz M., Anderson M., Hill R.T., Vicente F., Genilloud O., Reyes F. Kocurin, the true structure of PM181104, an anti-methicillin-resistant Staphylococcus aureus (MRSA) thiazolyl peptide from the marine-derived bacterium Kocuria palustris. Mar Drugs. 2013;11:387–398. doi: 10.3390/md11020387. 23380989 [DOI] [PMC free article] [PubMed] [Google Scholar]
- 3.Pucci M.J., Bronson J.J., Barrett J.F., DenBleyker K.L., Discotto L.F., Fung-Tomc J.C., Ueda Y. Antimicrobial evaluation of nocathiacins, a thiazole peptide class of antibiotics. Antimicrob Agents Chemother. 2004;48:3697–3701. doi: 10.1128/AAC.48.10.3697-3701.2004. 15388422 [DOI] [PMC free article] [PubMed] [Google Scholar]
- 4.Young T.S., Walsh C.T. Identification of the thiazolyl peptide GE37468 gene cluster from Streptomyces ATCC 55365 and heterologous expression in Streptomyces lividans. Proc Natl Acad Sci USA. 2011;108:13053–13058. doi: 10.1073/pnas.1110435108. 21788474 [DOI] [PMC free article] [PubMed] [Google Scholar]
- 5.Mahajan G., Thomas B., Parab R., Patel Z.E., Kuldharan S., Yemparala V., Mishra P.D., Ranadive P., D’Souza L., Pari K., Sivaramkrishnan H. In vitro and in vivo activities of antibiotic PM181104. Antimicrob Agents Chemother. 2013;57:5315–5319. doi: 10.1128/AAC.01059-13. 23939903 [DOI] [PMC free article] [PubMed] [Google Scholar]
- 6.Mahajan G.B., George S.D., Ranadive P.V., Mishra P.D.S., Eyyammadichiyil S.S., Panshikar R.M., Sawant S.N., Krishna S., Sivakumar M., Pari K., Thomas B.M., Patel Z.E., Vishwakarma R., Naik C.G., D’Souza L., Prabha D. Novel Antibact Compds. 2009. [Google Scholar]; US Patent 2009/0076094 A1
- 7.Just-Baringo X., Bruno P., Ottesen L.K., Cañedo L.M., Albericio F., Álvarez M. Total synthesis and stereochemical assignment of baringolin. Angew Chem (Int Ed. Engl) 2013;52(30):7818–7821. doi: 10.1002/anie.201302372. 23780649 [DOI] [PubMed] [Google Scholar]
- 8.Strickley R.G. Solubilizing excipients in oral and injectable formulations. Pharm Res. 2004;21:201–230. doi: 10.1023/b:pham.0000016235.32639.23. 15032302 [DOI] [PubMed] [Google Scholar]
- 9.Chari K., Antalek B., Kowalczyk J., Eachus R.S., Chen T. Polymer−surfactant interaction and stability of amorphous colloidal particles. J Phys Chem B. 1999;103:9867–9872. [Google Scholar]
- 10.Hao L., Wang X., Zhang D., Xu Q., Song S., Wang F., Li C., Guo H., Liu Y., Zheng D., Zhang Q. Studies on the preparation, characterization and pharmacokinetics of Amoitone B nanocrystals. Int J Pharm. 2012;433:157–164. doi: 10.1016/j.ijpharm.2012.05.002. 22579996 [DOI] [PubMed] [Google Scholar]
- 11.Kovács K., Antal I., Stampf G., Klebovich I., Ludányi K. Composition optimization and stability testing of a parenteral antifungal solution based on a ternary solvent system. AAPS PharmSciTech. 2010;11:285–293. doi: 10.1208/s12249-009-9368-1. 20182828 [DOI] [PMC free article] [PubMed] [Google Scholar]
- 12.Dong Y., Ng W.K., Shen S., Kim S., Tan R.B.H. Preparation and characterization of spironolactone nanoparticles by antisolvent precipitation. Int J Pharm. 2009;375:84–88. doi: 10.1016/j.ijpharm.2009.03.013. 19481693 [DOI] [PubMed] [Google Scholar]
- 13.Wacker M. Nanocarriers for intravenous injection—the long hard road to the market. Int J Pharm. 2013;457:50–62. doi: 10.1016/j.ijpharm.2013.08.079. 24036012 [DOI] [PubMed] [Google Scholar]
- 14.Yalkowsky S.H., Krzyzaniak J.F., Ward G.H. Formulation-related problems associated with intravenous drug delivery. J Pharm Sci. 1998;87:787–796. doi: 10.1021/js980051i. 9649344 [DOI] [PubMed] [Google Scholar]
- 15.Gelderblom H., Verweij J., Nooter K., Sparreboom A. Cremophor EL: the drawbacks and advantages of vehicle selection for drug formulation. Eur J Cancer. 2001;37:1590–1598. doi: 10.1016/s0959-8049(01)00171-x. 11527683 [DOI] [PubMed] [Google Scholar]
- 16.Chen H., Zhang Z., McNulty C., Olbert C., Yoon H.J., Lee J.W., Kim S.C., Seo M.H., Oh H.S., Lemmo A.V., Ellis S.J., Heimlich K. A high-throughput combinatorial approach for the discovery of a cremophor EL-free paclitaxel formulation. Pharm Res. 2003;20:1302–1308. doi: 10.1023/a:1025021603288. 12948029 [DOI] [PubMed] [Google Scholar]
- 17.Ali M.E., Lamprecht A. Polyethylene glycol as an alternative polymer solvent for nanoparticle preparation. Int J Pharm. 2013;456:135–142. doi: 10.1016/j.ijpharm.2013.07.077. 23958752 [DOI] [PubMed] [Google Scholar]
- 18.Webster R., Elliott V., Park B.K., Walker D., Hankin M., Taupin P. PEG and PEG conjugates toxicity: Towards an understanding of the toxicity of PEG and its relevance to pegylated BioLogicals. In: Veronese F.M., editor. Pegylated protein drugs: Basic science and clinical applications. Birkhauser; Basel, Switzerland: 2009. pp. 127–146. [Google Scholar]
- 19.Joshi M., Pathak S., Sharma S., Patravale V. Design and in vivo pharmacodynamic evaluation of nanostructured lipid carriers for parenteral delivery of artemether: nanoject. Int J Pharm. 2008;364:119–126. doi: 10.1016/j.ijpharm.2008.07.032. 18765274 [DOI] [PubMed] [Google Scholar]
- 20.van Tellingen O., Beijnen J.H., Verweij J., Scherrenburg E.J., Nooijen W.J., Sparreboom A. Rapid esterase-sensitive breakdown of polysorbate 80 and its impact on the plasma pharmacokinetics of docetaxel and metabolites in mice. Clin Cancer Res. 1999;5:2918–2924. 10537361 [PubMed] [Google Scholar]
- 21.Matteucci M.E., Hotze M.A., Johnston K.P., Williams R.O., III Drug nanoparticles by antisolvent precipitation: mixing energy versus surfactant stabilization. Langmuir. 2006;22:8951–8959. doi: 10.1021/la061122t. 17014140 [DOI] [PubMed] [Google Scholar]
- 22.Tang X.J., Fu Y.H., Meng Q.H., Li L.M., Ying X.Y., Han M., He Q.J., Yang B., Zeng S., Hu Y.Z., Sheng X.X., Gao J.Q. Evaluation of pluronic nanosuspensions loading a novel insoluble anticancer drug both in vitro and in vivo. Int J Pharm. 2013;456:243–250. doi: 10.1016/j.ijpharm.2013.07.058. 23928148 [DOI] [PubMed] [Google Scholar]
- 23.Pardeike J., Weber S., Haber T., Wagner J., Zarfl H.P., Plank H., Zimmer A. Development of an itraconazole-loaded nanostructured lipid carrier (NLC) formulation for pulmonary application. Int J Pharm. 2011;419:329–338. doi: 10.1016/j.ijpharm.2011.07.040. 21839157 [DOI] [PubMed] [Google Scholar]
- 24.Patel M.R., Linna T.J. Enrichment of mouse splenic natural killer cells using discontinuous polyvinylpyrrolidone silica (Percoll) gradients. Immunology. 1984;53:721–729. 6094339 [PMC free article] [PubMed] [Google Scholar]
- 25.Doellman D., Hadaway L., Bowe-Geddes L.A., Franklin M., LeDonne J., Papke-O’Donnell L., Pettit J., Schulmeister L., Stranz M. Infiltration and extravasation: update on prevention and management. J Infus Nurs. 2009;32:203–211. doi: 10.1097/NAN.0b013e3181aac042. 19605999 [DOI] [PubMed] [Google Scholar]
- 26.Owens D.E., Peppas N.A. Opsonization, biodistribution, and pharmacokinetics of polymeric nanoparticles. Int J Pharm. 2006;307:93–102. doi: 10.1016/j.ijpharm.2005.10.010. 16303268 [DOI] [PubMed] [Google Scholar]
- 27.Cedervall T., Lynch I., Lindman S., Berggård T., Thulin E., Nilsson H., Dawson K.A., Linse S. Understanding the nanoparticle-protein corona using methods to quantify exchange rates and affinities of proteins for nanoparticles. Proc Natl Acad Sci USA. 2007;104:2050–2055. doi: 10.1073/pnas.0608582104. 17267609 [DOI] [PMC free article] [PubMed] [Google Scholar]
- 28.Lundqvist M., Stigler J., Elia G., Lynch I., Cedervall T., Dawson K.A. Nanoparticle size and surface properties determine the protein corona with possible implications for biological impacts. Proc Natl Acad Sci USA. 2008;105:14265–14270. doi: 10.1073/pnas.0805135105. 18809927 [DOI] [PMC free article] [PubMed] [Google Scholar]
- 29.Vonarbourg A., Passirani C., Saulnier P., Benoit J.P. Parameters influencing the stealthiness of colloidal drug delivery systems. Biomaterials. 2006;27:4356–4373. doi: 10.1016/j.biomaterials.2006.03.039. 16650890 [DOI] [PubMed] [Google Scholar]
- 30.Pratten M.K., Lloyd J.B. Pinocytosis and phagocytosis: the effect of size of a particulate substrate on its mode of capture by rat peritoneal macrophages cultured in vitro. Biochim Biophys Acta. 1986;881:307–313. doi: 10.1016/0304-4165(86)90020-6. 3008849 [DOI] [PubMed] [Google Scholar]
- 31.Wong J., Brugger A., Khare A., Chaubal M., Papadopoulos P., Rabinow B., Kipp J., Ning J. Suspensions for intravenous (IV) injection: a review of development, preclinical and clinical aspects. Adv Drug Deliv Rev. 2008;60:939–954. doi: 10.1016/j.addr.2007.11.008. [DOI] [PubMed] [Google Scholar]
- 32.Araujo L., Löbenberg R., Kreuter J. Influence of the surfactant concentration on the body distribution of nanoparticles. J Drug Target. 1999;6:373–385. doi: 10.3109/10611869908996844. 10342385 [DOI] [PubMed] [Google Scholar]
- 33.Loos W.J., Baker S.D., Verweij J., Boonstra J.G., Sparreboom A. Clinical pharmacokinetics of unbound docetaxel: Role of polysorbate 80 and serum proteins. Clin Pharmacol Ther. 2003;74:364–371. doi: 10.1016/S0009-9236(03)00222-4. 14534523 [DOI] [PubMed] [Google Scholar]
- 34.Dobrovolskaia M.A., McNeil S.E. Immunological properties of engineered nanomaterials. Nat Nanotechnol. 2007;2:469–478. doi: 10.1038/nnano.2007.223. 18654343 [DOI] [PubMed] [Google Scholar]
- 35.Gao L., Zhang D., Chen M., Duan C., Dai W., Jia L., Zhao W. Studies on pharmacokinetics and tissue distribution of oridonin nanosuspensions. Int J Pharm. 2008;355:321–327. doi: 10.1016/j.ijpharm.2007.12.016. 18242896 [DOI] [PubMed] [Google Scholar]
- 36.FDA/Center for Drug Evaluation and Research, Office of Generic Drugs. Inactive Ingredient Search for Approved Drug Products; October 24, 2013. [Available from: http://www.accessdata.fda.gov/scripts/cder/iig/index.cfm].