

Abstract
Purpose
Optimal early detection and prevention for breast cancer depend on accurate identification of women at increased risk. We present a risk prediction model that incorporates histologic features of biopsy tissues from women with benign breast disease (BBD) and compare its performance to the Breast Cancer Risk Assessment Tool (BCRAT).
Methods
We estimated the age-specific incidence of breast cancer and death from the Mayo BBD cohort and then combined these estimates with a relative risk model derived from 377 patient cases with breast cancer and 734 matched controls sampled from the Mayo BBD cohort to develop the BBD–to–breast cancer (BBD-BC) risk assessment tool. We validated the model using an independent set of 378 patient cases with breast cancer and 728 matched controls from the Mayo BBD cohort and compared the risk predictions from our model with those from the BCRAT.
Results
The BBD-BC model predicts the probability of breast cancer in women with BBD using tissue-based and other risk factors. The concordance statistic from the BBD-BC model was 0.665 in the model development series and 0.629 in the validation series; these values were higher than those from the BCRAT (0.567 and 0.472, respectively). The BCRAT significantly underpredicted breast cancer risk after benign biopsy (P = .004), whereas the BBD-BC predictions were appropriately calibrated to observed cancers (P = .247).
Conclusion
We developed a model using both demographic and histologic features to predict breast cancer risk in women with BBD. Our model more accurately classifies a woman's breast cancer risk after a benign biopsy than the BCRAT.
INTRODUCTION
Breast cancer is the most commonly diagnosed cancer among women in the United States, with more than 230,000 invasive breast cancers and an additional 65,000 noninvasive breast cancers expected in 2013.1 Ideally, women at increased risk for breast cancer should be identified so that appropriate surveillance and prevention strategies can be offered. Unfortunately, currently available risk prediction models do not provide accurate estimates of risk at the individual level. The Breast Cancer Risk Assessment Tool (BCRAT) was designed to identify groups of women at increased risk for entry onto chemoprevention trials.2,3 However, it is commonly used clinically today to predict risk for individual women, where it has limited accuracy.4 Other risk prediction models include the International Breast Cancer Intervention Study (IBIS) and Breast Cancer Surveillance Consortium models. The IBIS model focuses primarily on familial breast cancer, and the Breast Cancer Surveillance Consortium model does not incorporate specific histologic findings from benign biopsies.
Annually, one to two million women in the United States undergo breast biopsy to investigate a palpable or mammographic abnormality and have benign findings.5 These women with so-called benign breast disease (BBD) have an increased risk of breast cancer, stratified by the degree of epithelial abnormality.6–8 In addition, other histologic features, such as the degree of lobular involution,9,10 are strongly associated with breast cancer risk. These observations are consistent with other cancers, where examining the histologic features of the tissue at risk greatly improves risk assessment. To our knowledge, no model for breast cancer risk prediction has incorporated substantial tissue-based information, such as that available from a benign breast biopsy. The BCRAT incorporates number of prior breast biopsies and the presence of atypical hyperplasia. The IBIS model also includes these features and the presence of lobular carcinoma in situ.11 Using the Mayo BBD cohort, we tested both of these models in women with atypical hyperplasia, a high-risk benign lesion, and found that neither predicted breast cancer risk better than chance alone.12,13 This underscores the need for improved models for the prediction of breast cancer risk in women with BBD.
Here we present a model that predicts the absolute risk of developing breast cancer at the time of benign biopsy. It uses histologic features assessed from the biopsy, together with other demographic and clinical features. We also compare the performance of this model to that of the BCRAT, the most commonly used tool in women with BBD.
METHODS
Study Population
The Mayo BBD cohort has been previously described.7,10 This study set comprises 9,854 women age 18 to 85 who had excisional benign breast biopsies between 1967 and 1991 at the Mayo Clinic (Rochester, MN). Demographic descriptors and risk factors were identified from medical records and questionnaires.7,10 Archived hematoxylin and eosin slides of the benign biopsies were reviewed systematically by our breast pathologist (D.W.V.). Over a median of 18.9 years of follow-up, 924 women were diagnosed with breast cancer. The study protocol, including patient contact and follow-up methods, was approved by the Mayo Clinic Institutional Review Board with methods previously described.7
From the cohort, we selected two case-control sets, one for the development of a risk prediction model and a second for model validation. For the model development set, we randomly sampled 377 women who developed breast cancer (patient cases). We individually matched 734 controls, up to two per patient case, by age at biopsy and year of biopsy. Similarly, we identified an independent validation set of 378 patient cases and 728 matched controls.
Statistical Approach
To create a tool that predicts the absolute risk of breast cancer at the time of BBD, as a function of age at BBD and time since BBD, we followed the case-registry paradigm used to develop the BCRAT. This required the combination of age-specific hazards of breast cancer (invasive or in situ), age-specific hazards of the competing risk of death, and a relative risk model for individualized risk assessment.3,14
We estimated age-dependent hazards of breast cancer and the competing risk of death from our full BBD cohort with more than 180,000 person-years of follow-up. We used incidence density approaches to estimate the baseline risks of death and breast cancer in 5-year age categories by dividing the number of events observed in the age category by the person-years in that category.15
The variables considered for inclusion in the relative risk model were clinical characteristics and demographics, including age at menarche, a combined categorization of age at first live birth and number of children, breastfeeding history, menopausal status, height, body mass index, number of biopsies, family history, and indication for biopsy; and histologic variables, including overall impression (proliferative v nonproliferative), number of foci of atypical hyperplasia (if any), lobular involution (none, partial, or complete) as previously defined,10 radial scars, and the presence of fibroadenoma, calcifications, intraductal papilloma, and sclerosing adenosis/columnar alterations. We modeled the effect of age through the baseline hazard rather than the relative risk model.
We used a multiple-imputation approach to fill in missing values before analysis16,17 and created five independently imputed data sets. We used a forward stepwise selection approach in conditional logistic regression models to identify candidate features from each of the five data sets. Variables that met a threshold for inclusion of P < .20 in any of the five sets were examined in a combined data set, and variables with P > .05 were removed in a backward stepwise manner. Each pair of remaining variables was examined in the combined data set for evidence of interaction. Interactions with multivariable P < .05 were included in an initial relative risk regression model derived from the discovery case-control set.
We used the case-registry approach to combine the estimates of baseline risk of breast cancer and death with this initial relative risk model3,14 and incorporated the results into a SAS macro (SAS Institute, Cary, NC) that computes the probability of breast cancer risk at a specified time after BBD. We used this macro to predict breast cancer risk at 5 and 10 years after BBD on both the model development and validation data sets. Similarly, we used the SAS macro available for the BCRAT3,18 to calculate absolute breast cancer risks. From these projected risk probabilities, we computed concordance statistics (c-statistics) for the model development and model validation series separately.
After validating this initial model, we updated the relative risk estimates by combining data from both our case-control series (both model development and validation) and re-estimated the regression coefficients in the regression model defined from the discovery set alone. This provided updated coefficient estimates for the relative risk model to enhance precision. We combined this updated relative risk model with the age-specific risks of breast cancer and death to devise the final BBD model. This updated relative risk model was combined with estimates of the age-specific hazards of breast cancer and death in an SAS macro that computes the absolute risk of breast cancer after BBD. This updated macro represents our final BBD–to–breast cancer (BBD-BC) risk assessment tool.
To assess calibration, we obtained 10-year absolute risk predictions for all women in the combined case-control series using the final BBD-BC model and the BCRAT and applied the approach of Mealiffe et al.19 This method uses a Hosmer-Lemeshow lack of fit test20 to assess agreement between observed and model-predicted proportions of breast cancer events within groups defined by strata of the absolute risks.19,21 We next examined the extent to which the BBD-BC reclassified individuals into risk groups used by others for 5-year risk predictions (< 1%, 1% to 1.66%, 1.67% to 2.5%, 2.51% to 4%, and > 4%).22 We computed components of the net reclassification improvement23 to compare the improvement offered by the BBD-BC over the BCRAT. The first components of the net reclassification improvement reflect the proportions of patient cases receiving a higher versus lower risk categorization. The second set of components reflects the proportions of controls receiving a lower versus higher risk categorization.24,25
To apply the BBD-BC model clinically, we defined a points-based system that calculates an overall risk score for an individual woman by adding together the regression coefficients from the model, after multiplication by a constant, for the specific characteristics of the woman. We then computed the values of this risk score for all possible age and risk factor combinations, binned these values into 20 risk groups per age decade, and computed the 25th to 75th percentile range for 10-year and lifetime breast cancer risks for each age-specific bin. All analyses were carried out using SAS software (version 9.2; SAS Institute).
RESULTS
The Mayo BBD cohort includes 9,854 women age 18 to 85 years who had a benign biopsy from 1967 to 1991 with a median follow-up of 18.9 years and 187,899 person-years of follow-up. Among questionnaire respondents, 82% reported regular mammographic screening after benign biopsy. Nine hundred twenty-four women developed breast cancer, and 3,012 women are deceased. Appendix Figure 1 (online only) illustrates the age-dependent cumulative incidence of breast cancer (invasive or ductal carcinoma in situ) and death in this cohort.
Fig 1.
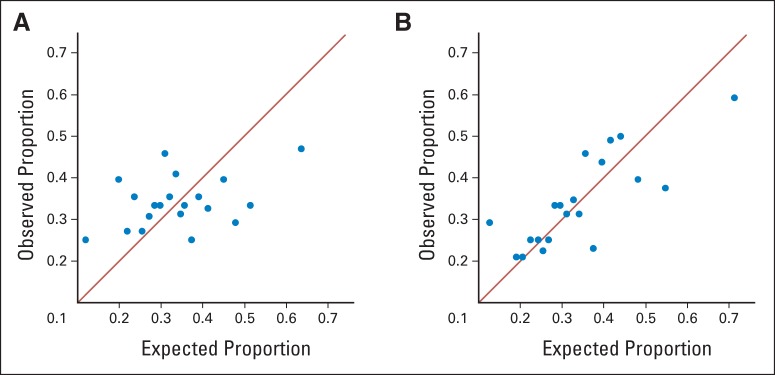
Plots summarizing the calibration of 10-year risk predictions by comparing observed proportion of women with breast cancer to the proportion expected within deciles of predicted risk. If a model is well calibrated, the points should lie along the diagonal line to indicate that the observed proportion of patients in each risk group agrees closely with the proportions predicted from the model. (A) Calibration of the Breast Cancer Risk Assessment Tool. (B) Calibration of the benign breast disease–to–breast cancer model.
Variable Selection
Our model development set comprised 377 patient cases and 734 controls matched on age and year of BBD. Of the initial variables considered (see Methods), eight were ultimately included in the initial relative risk model and are listed by case-control status in Table 1. Features individually associated with breast cancer risk included overall histologic impression, number of foci of atypical hyperplasia (if present), radial scars, sclerosing adenosis/columnar alterations, family history of breast cancer, extent of lobular involution, and a combined categorization of age at first live birth and number of children. After evaluation of potential interaction effects among these features, the following three pairwise interactions were added to the relative risk prediction model: histologic impression and the combined age at first live birth and number of children measure, lobular involution and the combined age at first live birth and number of children measure, and lobular involution and sclerosing adenosis/columnar alterations.
Table 1.
Clinical Characteristics of the Women Later Diagnosed With Breast Cancer (patient cases) and Unaffected Women Matched to Those With Breast Cancer (controls) by Model Development and Validation Subgroups
| Clinical Characteristic | Model Development |
Validation |
||||||||
|---|---|---|---|---|---|---|---|---|---|---|
| Patient Cases (n = 377) |
Controls (n = 734) |
P | Patient Cases (n = 378) |
Controls (n = 728) |
P | |||||
| No. | % | No. | % | No. | % | No. | % | |||
| Follow-up, years | < .001 | < .001 | ||||||||
| Median | 11.6 | 21.8 | 10.7 | 22.2 | ||||||
| 25th percentile | 6.0 | 16.1 | 5.5 | 15.9 | ||||||
| 75th percentile | 17.1 | 29.3 | 15.6 | 29.8 | ||||||
| Age at benign biopsy, years | .8978 | .8678 | ||||||||
| Median | 51.0 | 51.0 | 52.0 | 52.0 | ||||||
| 25th percentile | 44.0 | 44.0 | 45.0 | 46.0 | ||||||
| 75th percentile | 60.0 | 60.0 | 61.0 | 61.0 | ||||||
| Histologic impression | < .001 | < .001 | ||||||||
| Nonproliferative | 202 | 53.6 | 494 | 67.3 | 196 | 51.9 | 458 | 62.9 | ||
| Proliferative | 175 | 46.4 | 240 | 32.7 | 182 | 48.1 | 270 | 37.1 | ||
| No. of atypical foci | < .001 | < .001 | ||||||||
| 0 | 341 | 90.5 | 707 | 96.3 | 348 | 92.1 | 703 | 96.6 | ||
| 1 | 12 | 3.2 | 15 | 2.0 | 12 | 3.2 | 20 | 2.7 | ||
| 2 | 12 | 3.2 | 10 | 1.4 | 10 | 2.6 | 3 | 0.4 | ||
| ≥ 3 | 12 | 3.2 | 2 | 0.3 | 8 | 2.1 | 2 | 0.3 | ||
| Extent of lobular involution | .0232 | < .001 | ||||||||
| Missing | 28 | 33 | 33 | 43 | ||||||
| None | 72 | 20.6 | 117 | 16.7 | 78 | 22.6 | 108 | 15.8 | ||
| Partial | 218 | 62.5 | 417 | 59.5 | 220 | 63.8 | 421 | 61.5 | ||
| Complete | 59 | 16.9 | 167 | 23.8 | 47 | 13.6 | 156 | 22.8 | ||
| Radial scars | .0099 | .6352 | ||||||||
| Missing | 1 | 0 | ||||||||
| Absent | 342 | 91.0 | 697 | 95.0 | 359 | 95.0 | 696 | 95.6 | ||
| Present | 34 | 9.0 | 37 | 5.0 | 19 | 5.0 | 32 | 4.4 | ||
| Columnar cell alterations/sclerosing adenosis | .0015 | < .001 | ||||||||
| Missing | 2 | 0 | 0 | 4 | ||||||
| No | 206 | 54.9 | 475 | 64.7 | 198 | 52.4 | 456 | 63.0 | ||
| Yes | 169 | 45.1 | 259 | 35.3 | 180 | 47.6 | 268 | 37.0 | ||
| Family history of breast cancer | .001 | .0093 | ||||||||
| Missing | 1 | 3 | 1 | 4 | ||||||
| None | 195 | 51.9 | 454 | 62.1 | 214 | 56.8 | 469 | 64.8 | ||
| Any | 181 | 48.1 | 277 | 37.9 | 163 | 43.2 | 255 | 35.2 | ||
| Age at first live birth, years/No. of children | .0875 | .0091 | ||||||||
| Missing | 37 | 69 | 22 | 53 | ||||||
| ≤ 20/1+ | 55 | 16.2 | 143 | 21.5 | 69 | 19.4 | 141 | 20.9 | ||
| ≥ 21/3+ | 102 | 30.0 | 215 | 32.3 | 105 | 29.5 | 251 | 37.2 | ||
| ≥ 21/1-2 | 120 | 35.3 | 195 | 29.3 | 105 | 29.5 | 185 | 27.4 | ||
| No children | 63 | 18.5 | 112 | 16.8 | 77 | 21.6 | 98 | 14.5 | ||
Model Assessment and Finalization
Using the findings from the model development set, we formed an initial risk prediction tool and computed 5-year, 10-year, and lifetime (age 90 years) risk predictions from the tool and the BCRAT. The c-statistic for the 10-year risk prediction from our model was 0.665 (95% CI, 0.61 to 0.72), which is higher than the c-statistic of 0.567 (95% CI, 0.51 to 0.62) for the BCRAT. We tested this initial model in the independent validation set (Table 1). These 10-year risk predictions resulted in a c-statistic of 0.629 (95% CI, 0.58 to 0.68) from our initial model versus 0.472 (95% CI, 0.42 to 0.53) from the BCRAT.
After validation, we pooled all patient cases and controls in the model development and validation sets and re-estimated the regression coefficients of the variables. These regression coefficients were used to develop our BBD-BC risk prediction tool (Table 2). We obtained 5-year, 10-year, and lifetime risk predictions from this model and from the BCRAT (Table 3). We also assessed calibration of the 10-year risk predictions while accounting for the case-control design. Figure 1 shows plots comparing the observed versus the predicted proportions of patient cases within 20 risk-based strata for the BCRAT and BBD-BC models. With perfect calibration, the observed and expected numbers would agree, and the points would display a correlation of 1.0 by lying exactly on the diagonal line.
Table 2.
Regression Coefficients of the Final BBD-BC Model From the Pooled Model Development and Validation Case-Control Series
| Variable | Odds Ratio | 95% CI |
|---|---|---|
| Histologic impression | ||
| Nonproliferative | 1.00 | Reference |
| Proliferative | 1.62 | 0.97 to 2.71 |
| No. of atypical foci | ||
| Ordinal variable | 1.80 | 1.42 to 2.28 |
| Extent of lobular involution | ||
| Complete | 1.00 | Reference |
| Partial | 1.41 | 0.94 to 2.12 |
| None | 1.99 | 1.33 to 2.99 |
| Radial scar | ||
| No | 1.00 | Reference |
| Yes | 1.17 | 0.77 to 1.78 |
| Sclerosing adenosis/columnar cell alterations | ||
| No | 1.00 | Reference |
| Yes | 0.89 | 0.57 to 1.38 |
| Family history | ||
| No | 1.00 | Reference |
| Yes | 1.56 | 1.28 to 1.89 |
| Age at first live birth, years/No. of children | ||
| Nulliparous | 1.00 | Reference |
| ≤ 20/1+ | 0.66 | 0.35 to 1.24 |
| ≥ 21/3+ | 0.68 | 0.38 to 1.19 |
| ≥ 21/1-2 | 0.75 | 0.43 to 1.30 |
| Age at first live birth, years/No. of children modified by histologic impression | ||
| Proliferative and nulliparous | 1.00 | Reference |
| Proliferative and ≤ 20/1+ | 0.88 | 0.47 to 1.67 |
| Proliferative and ≥ 21/3+ | 1.00 | 0.56 to 1.81 |
| Proliferative and ≥ 21/1-2 | 0.63 | 0.35 to 1.15 |
| Age at first live birth, years/No. of children modified by extent of lobular involution | ||
| Per involution category and nulliparous | 1.00 | Reference |
| Per involution category and ≤ 20/1+ | 0.94 | 0.56 to 1.58 |
| Per involution category and ≥ 21/3+ | 0.82 | 0.51 to 1.31 |
| Per involution category and ≥ 21/1-2 | 1.27 | 0.79 to 2.06 |
| Extent of involution modified by sclerosing adenosis and/or columnar cell alterations | ||
| Per involution category and no | 1.0 | Reference |
| Per involution category and yes | 1.25 | 0.89 to 1.77 |
Abbreviation: BBD-BC, benign breast disease–to–breast cancer model.
Table 3.
Concordance Statistics Measuring the Ability of the Risk Models to Discriminate Risk on an Individual Level for Risk Predictions Made at 5 and 10 Years After BBD and at Age 90 Years (lifetime risk)
| Prediction Model | 5-Year Predictions |
10-Year Predictions |
Age 90 Predictions |
|||||||||
|---|---|---|---|---|---|---|---|---|---|---|---|---|
| No. of Patient Cases | No. of Controls | Concordance Statistic | 95% CI | No. of Patient Cases | No. of Controls | Concordance Statistic | 95% CI | No. of Patient Cases | No. of Controls | Concordance Statistic | 95% CI | |
| Model development | ||||||||||||
| BBD-BC | 77 | 149 | 0.692 | 0.62 to 0.77 | 149 | 290 | 0.665 | 0.61 to 0.72 | 377 | 734 | 0.636 | 0.60 to 0.67 |
| BCRAT | 77 | 149 | 0.609 | 0.53 to 0.69 | 149 | 290 | 0.567 | 0.51 to 0.62 | 377 | 734 | 0.556 | 0.52 to 0.59 |
| Validation | ||||||||||||
| BBD-BC | 84 | 163 | 0.644 | 0.57 to 0.72 | 179 | 346 | 0.629 | 0.58 to 0.68 | 378 | 728 | 0.650 | 0.62 to 0.68 |
| BCRAT | 84 | 163 | 0.479 | 0.40 to 0.56 | 179 | 346 | 0.472 | 0.42 to 0.53 | 378 | 728 | 0.521 | 0.48 to 0.56 |
| Combined | ||||||||||||
| BBD-BC | 161 | 312 | 0.667 | 0.61 to 0.72 | 328 | 636 | 0.645 | 0.61 to 0.68 | 755 | 1,462 | 0.643 | 0.62 to 0.67 |
| BCRAT | 161 | 312 | 0.541 | 0.49 to 0.60 | 328 | 636 | 0.515 | 0.48 to 0.55 | 755 | 1,462 | 0.538 | 0.51 to 0.56 |
Abbreviations: BBD, benign breast disease; BBD-BC, benign breast disease–to–breast cancer model; BCRAT, Breast Cancer Risk Assessment Tool.
For the BCRAT (Fig 1A), there is significant lack of fit by the Hosmer-Lemeshow test (P = .004), and the correlation between observed and predicted breast cancer proportions across the 20 risk strata is weak (r = 0.283; P = .046). In contrast, the BBD-BC model (Fig 1B) displays stronger correlation between observed and predicted breast cancer proportions (r = 0.608; P < .001), indicating that the BBD-BC predictions were appropriately calibrated to observed cancers (P = .247). The BCRAT predictions tended to be lower than those from the BBD-BC (Appendix Table A1, online only, lists the cutoff values for the 20 risk strata). For 5-year risk predictions, the BBD-BC placed 46.6% more patient cases into higher and 14.8% more patient cases into lower 5-year risk groups than the BCRAT. It placed 23.1% more controls into lower and 34.7% more controls into higher 5-year risk groups than the BCRAT. Importantly, of the 350 patient cases with less than 1.67% 5-year risk via the BCRAT, 49.4% were predicted to have greater than 1.67% 5-year risk via the BBD-BC. For the 405 patient cases with 5-year risk greater than 1.67% via the BCRAT, 13.3% received 5-year predictions less than 1.67% by the BBD-BC (Appendix Table A2, online only).
Given that the BCRAT predicts risk of invasive breast cancer, we excluded patient cases with ductal carcinoma in situ and repeated the analyses on the invasive subgroup only. The 10-year c-statistic for the BBD-BC was 0.642 (95% CI, 0.60 to 0.69), whereas the 10-year c-statistic for the BCRAT was 0.502 (95% CI, 0.46 to 0.55). Calibration for the BCRAT and the BBD-BC models in the invasive subgroup was similar to that described for all women in our primary analyses.
Individualized Risk Prediction
We generated a table-based method for individualized risk assessment using the BBD-BC model. Points for each risk feature (Table 4) are summed to derive a risk score that can be used to obtain individualized 10-year and lifetime breast cancer risks (Table 5). Examples of this model applied to three representative patients are listed in Appendix Table A3 (online only).
Table 4.
Model Characteristics and Corresponding Risk Points Assigned
| Characteristic | No. of Points |
|---|---|
| Main effect characteristics | |
| Histologic impression | |
| NP | 0 |
| PD | 20.5 |
| No. of atypical foci | |
| 0 | 0 |
| 1 | 24.4 |
| 2 | 48.8 |
| ≥ 3 | 73.2 |
| Extent of lobular involution | |
| Complete | 0 |
| Partial | 14.1 |
| None | 28.3 |
| Presence of radial scar | |
| No | 0 |
| Yes | 6.0 |
| Presence of SA and/or CCA | |
| Neither | 0 |
| SA or CCA or both | −4.7 |
| Family history of breast cancer | |
| No | 0 |
| Yes | 18.2 |
| Age at first live birth, years, and No. of children | |
| Nulliparous | 0 |
| ≤ 20, ≥ 1 | −16.5 |
| ≥ 21, ≥ 3 | −14.7 |
| ≥ 21, 1-2 | −11.6 |
| Effect-modifying characteristics | |
| Age at first live birth, years, and No. of children modified by histologic impression | |
| Nulliparous or NP* | 0 |
| ≤ 20, ≥ 1 and PD† | −6.4 |
| ≥ 21, ≥ 3 and PD† | −1.0 |
| ≥ 21, 1-2 and PD† | −19.8 |
| Age at first live birth, years, and No. of children modified by extent of lobular involution | |
| Nulliparous or complete involution* | 0 |
| ≤ 20, ≥ 1 and partial involution† | −2.8 |
| ≤ 20, ≥ 1 and no involution† | −5.7 |
| ≥ 21, ≥ 3 and partial involution† | −9.6 |
| ≥ 21, ≥ 3 and no involution† | −19.2 |
| ≥ 21, 1-2 and partial involution† | 9.6 |
| ≥ 21, 1-2 and no involution† | 19.3 |
| Extent of involution modified by SA and/or CCA | |
| Complete involution or (no SA and no CCA)* | 0 |
| Partial involution and either SA or CCA† | 9.2 |
| No involution and either SA or CCA† | 18.4 |
NOTE. For a given individual, sum the assigned points for each of the 10 main effect and effect-modifying characteristics to obtain an overall risk score, and see Table 5 for translation into risk estimates.
Abbreviations: CCA, columnar cell alteration; NP, nonproliferative disease; PD, proliferative disease; SA, sclerosing adenosis.
Use this category if the individual has one or both of the two characteristics.
Use this category only if the individual has both of the two characteristics.
Table 5.
Translation of BBD-BC Model–Assigned Risk Points (from Table 4) to Average Breast Cancer Risk Estimates
| Sum of Risk Points | Age at Initial Biopsy |
|||||||||||||
|---|---|---|---|---|---|---|---|---|---|---|---|---|---|---|
| < 30 Years |
30-39 Years |
40-49 Years |
50-59 Years |
60-69 Years |
70-79 Years |
≥ 80 Years |
||||||||
| 10-Year Risk (%) | Lifetime Risk (%) | 10-Year Risk (%) | Lifetime Risk (%) | 10-Year Risk (%) | Lifetime Risk (%) | 10-Year Risk (%) | Lifetime Risk (%) | 10-Year Risk (%) | Lifetime Risk (%) | 10-Year Risk (%) | Lifetime Risk (%) | 10-Year Risk (%) | Lifetime Risk (%) | |
| ≤ 0 | 0.3 | 11.2 | 1.0 | 11.0 | 1.9 | 10.3 | 2.6 | 8.8 | 3.5 | 6.7 | 3.0 | 3.8 | 1.9 | 1.6 |
| 0.1-12.6 | 0.4 | 15.5 | 1.4 | 15.4 | 2.8 | 14.5 | 3.8 | 12.4 | 4.9 | 9.5 | 4.3 | 5.5 | 2.7 | 2.3 |
| 12.7-18.6 | 0.5 | 18.7 | 1.7 | 18.5 | 3.4 | 17.5 | 4.6 | 15.0 | 6.0 | 11.6 | 5.2 | 6.7 | 3.3 | 2.8 |
| 18.7-26.9 | 0.6 | 21.7 | 2.0 | 21.6 | 4.1 | 20.5 | 5.5 | 17.6 | 7.1 | 13.6 | 6.2 | 7.9 | 3.9 | 3.3 |
| 27.0-33.7 | 0.7 | 26.0 | 2.4 | 25.8 | 5.0 | 24.5 | 6.7 | 21.2 | 8.7 | 16.4 | 7.6 | 9.6 | 4.7 | 4.0 |
| 33.8-38.2 | 0.8 | 29.0 | 2.8 | 28.9 | 5.7 | 27.5 | 7.6 | 23.8 | 9.9 | 18.6 | 8.6 | 10.9 | 5.4 | 4.6 |
| 38.3-44.2 | 0.8 | 31.6 | 3.1 | 31.5 | 6.3 | 30.0 | 8.4 | 26.1 | 11.0 | 20.4 | 9.5 | 12.0 | 6.0 | 5.1 |
| 44.3-51.3 | 1.0 | 35.7 | 3.6 | 35.5 | 7.3 | 33.9 | 9.8 | 29.6 | 12.6 | 23.3 | 11.0 | 13.8 | 6.9 | 5.9 |
| 51.4-57.4 | 1.3 | 40.8 | 4.3 | 40.6 | 8.6 | 38.8 | 11.5 | 34.0 | 14.9 | 27.0 | 13.0 | 16.2 | 8.2 | 7.0 |
| 57.5-62.1 | 1.3 | 44.6 | 4.8 | 44.5 | 9.7 | 42.6 | 13.0 | 37.5 | 16.7 | 30.0 | 14.5 | 18.1 | 9.2 | 7.9 |
| 62.2-66.1 | 1.5 | 48.1 | 5.4 | 47.8 | 10.7 | 45.9 | 14.3 | 40.6 | 18.4 | 32.6 | 16.0 | 19.9 | 10.2 | 8.7 |
| 66.2-71.7 | 1.7 | 52.1 | 6.0 | 51.9 | 12.0 | 49.9 | 16.0 | 44.4 | 20.5 | 35.9 | 17.9 | 22.1 | 11.4 | 9.8 |
| 71.8-79.2 | 2.0 | 57.4 | 7.1 | 57.3 | 14.0 | 55.3 | 18.5 | 49.6 | 23.6 | 40.6 | 20.7 | 25.4 | 13.3 | 11.4 |
| 79.3-84.2 | 2.3 | 62.7 | 8.2 | 62.6 | 16.1 | 60.6 | 21.2 | 54.8 | 26.9 | 45.3 | 23.6 | 28.8 | 15.3 | 13.1 |
| 84.3-88.7 | 2.6 | 66.8 | 9.2 | 66.7 | 18.0 | 64.8 | 23.6 | 58.9 | 29.8 | 49.2 | 26.2 | 31.8 | 17.0 | 14.6 |
| 88.8-94.5 | 2.8 | 70.6 | 10.3 | 70.7 | 20.1 | 68.9 | 26.2 | 63.1 | 32.9 | 53.2 | 29.0 | 34.9 | 19.0 | 16.3 |
| 94.6-104.2 | 3.5 | 76.1 | 12.2 | 76.3 | 23.6 | 74.7 | 30.6 | 69.2 | 38.0 | 59.4 | 33.6 | 40.1 | 22.2 | 19.2 |
| 104.3-111.3 | 4.2 | 81.6 | 14.7 | 81.8 | 28.0 | 80.6 | 36.0 | 75.6 | 44.2 | 66.2 | 39.3 | 46.2 | 26.3 | 22.9 |
| 111.4-123.5 | 5.0 | 86.1 | 17.9 | 86.6 | 33.4 | 85.7 | 42.5 | 81.5 | 51.3 | 73.1 | 45.9 | 53.0 | 31.3 | 27.4 |
| ≥ 123.6 | 7.9 | 92.6 | 27.6 | 93.2 | 48.2 | 93.1 | 58.9 | 90.7 | 68.0 | 85.3 | 61.9 | 68.4 | 44.7 | 39.9 |
Abbreviation: BBD-BC, benign breast disease–to–breast cancer model.
DISCUSSION
Using a unique, large cohort of women with BBD, we developed a model that predicts the absolute risk of breast cancer (both invasive and in situ) at 10 years and for lifetime after benign biopsy. To our knowledge, this BBD-BC model is the first breast cancer risk prediction tool that focuses specifically on the sizable pool of women with BBD. Importantly, it incorporates information assessed directly from the breast biopsy, in addition to clinical risk factors. We compared the performance of the BCRAT to that of the BBD-BC and demonstrated that the BBD-BC model has better discrimination and calibration in women with BBD.
Discrimination measures the ability of a model to correctly predict patient cases to be at higher risk than controls and is reflected in the c-statistic, where values near 1.0 represent perfect discrimination and values near 0.5 represent no discrimination. In the validation set, the BBD-BC model 10-year c-statistic was 0.63, which is significantly higher than 0.47, the value for the BCRAT. The improved discrimination was also seen at the 5-year and age 90 (lifetime) risk predictions. Importantly, although both models incorporate age-dependent breast cancer risks, the c-statistics in this study likely underestimate the actual discrimination of both models because we are studying age-matched patient cases and controls. Nevertheless, the c-statistic of the BBD-BC model is 0.63, which compares favorably to estimates reported for the BCRAT in studies not based on age-matched patient cases and controls.4
The second measure of model performance, calibration, assesses how accurately a model predicts the level of risk. This is a critical component of an absolute risk prediction model; if a model is not well calibrated, its estimates provide a biased reflection of risk. In calibration, our model offers a real benefit over the BCRAT. The BCRAT demonstrated significant lack of calibration in the Mayo BBD cohort, whereas the BBD-BC predictions were appropriately calibrated to observed cancers in this population. The BCRAT significantly underpredicts breast cancer risk after benign breast biopsy. Therefore, even though the added discrimination provided by our model is modest, the absolute risk estimates from the BBD-BC were better calibrated to observed breast cancer incidence after benign biopsy (Fig 1). Thus, this new BBD-BC model provides improved risk prediction for women with BBD, not only in its discriminatory accuracy, but also in its calibration to observed breast cancer risk after BBD. The lack of calibration of the BCRAT made it difficult to assess the improvement in risk categorization provided by the BBD-BC, because the average risks estimated by the BBD-BC were higher than those of the BCRAT. The BBD-BC model classified a net of 32% of women who developed breast cancer as being in higher risk categories, although BCRAT correctly classified a net of 12% of controls as being in lower risk categories. Although this comparison is most appropriate when made between well-calibrated models, the BBD-BC model was able to correctly change risk categories for a net of 20% of women with BBD when compared with the BCRAT.
To our knowledge, this is also the first report of the performance of the BCRAT in an unselected set of women with BBD who developed breast cancer and matched controls. In this set, the BCRAT displayed poor performance, with low c-statistics and evidence of significant lack of calibration. This suggests that the use of a model developed specifically for women with BBD, such as the BBD-BC model reported here, may provide improved ability to identify women who truly are at increased risk of breast cancer after a benign biopsy.
The BBD-BC model put forward here has a number of strengths. First, it was developed exclusively for women with BBD, an important and large group of women who are understandably concerned about their breast cancer risk. Clinicians routinely use the BCRAT, or the IBIS model, in women with BBD when neither of these models has been expressly validated in this setting. Second, we showed consistent performance in an independent validation set. Finally, the features included in the model are commonly available from the patient's history or from the hematoxylin and eosin slide used for the diagnosis. The only pathologic feature we have incorporated that is not currently reported is the extent of age-related involution of normal breast lobules. For this, we have used a simple three-level measure of no involution versus moderate versus complete involution that could be assessed by a breast pathologist.
We also acknowledge limitations to this work. First, the model is based on data from a cohort of women with BBD at the Mayo Clinic, a largely white population. Unfortunately, the major BBD resources studied to date have all included primarily white women.7,26,27 Second, we have not yet validated the performance of the model in women with BBD from other study sites. Finally, although better than what has been observed with other models, the discrimination of the model remains suboptimal.
In summary, this new BBD-BC model represents an important step toward individualized breast cancer risk prediction for women with BBD. Our BBD-BC model uses information gained from assessment of the breast tissue at risk, and it improves risk prediction for women with BBD compared with the current standards. More accurate risk prediction sets the stage for more appropriate tailoring of surveillance and risk reduction strategies. We anticipate future work with more sophisticated approaches using molecular markers and genomic assessments to further improve model performance and risk prediction for women with BBD.
Acknowledgment
We thank T. Allers, J. Johnson, M. Campion, M. Kasner, A. Harris, and the Mayo Survey Research Center for data collection; A. Farrell for reference librarian services; P. Haugen for her perspective as a patient advocate; and V. Shea for secretarial assistance.
Glossary Terms
- calibration:
agreement of predicted risks with observed outcomes, for example, mortality rates.
Appendix
Table A1.
Ten-Year Risk Prediction Cutoffs for the 20 Risk Strata Used to Assess Model Calibration
| Stratum | BCRAT 10-Year Risk Range (%) | BBD-BC 10-Year Risk Range (%) |
|---|---|---|
| 1 | < 1.720 | < 2.052 |
| 2 | 1.721-2.124 | 2.052-2.334 |
| 3 | 2.125-2.297 | 2.335-2.541 |
| 4 | 2.298-2.586 | 2.542-2.809 |
| 5 | 2.587-2.798 | 2.810-3.086 |
| 6 | 2.799-3.055 | 3.087-3.328 |
| 7 | 3.056-3.222 | 3.329-3.501 |
| 8 | 3.223-3.414 | 3.502-3.759 |
| 9 | 3.415-3.585 | 3.760-4.019 |
| 10 | 3.586-3.817 | 4.020-4.323 |
| 11 | 3.818-4.027 | 4.324-4.609 |
| 12 | 4.028-4.234 | 4.610-4.866 |
| 13 | 4.235-4.406 | 4.867-5.317 |
| 14 | 4.407-4.724 | 5.318-5.721 |
| 15 | 4.725-5.143 | 5.722-6.146 |
| 16 | 5.144-5.782 | 6.147-6.624 |
| 17 | 5.783-6.499 | 6.625-7.609 |
| 18 | 6.500-7.292 | 7.610-9.156 |
| 19 | 7.293-8.820 | 9.157-11.967 |
| 20 | ≥ 8.821 | ≥ 11.968 |
Abbreviations: BBD-BC, benign breast disease–to–breast cancer model; BCRAT, Breast Cancer Risk Assessment Tool.
Table A2.
Reclassification of the BCRAT With the BBD-BC Model in Categories of 5-Year Breast Cancer Risk
| 5-Year Risk: BCRAT | 5-Year Risk: BBD-BC |
Correctly Reclassified (%) | Incorrectly Reclassified (%) | ||||
|---|---|---|---|---|---|---|---|
| 0% to < 1% | 1% to 1.66% | 1.67% to 2.5% | 2.5% to 4% | > 4% | |||
| Patient Cases | |||||||
| 0% to < 1% | 67 | 33 | 12 | 9 | 2 | 45.5% | 0% |
| 1% to 1.66% | 7 | 70 | 83 | 51 | 16 | 66.1% | 3.1% |
| 1.67% to 2.5% | 3 | 41 | 69 | 74 | 32 | 48.4% | 20.1% |
| 2.5% to 4% | 0 | 9 | 23 | 46 | 40 | 33.9 | 27.1% |
| > 4% | 0 | 1 | 13 | 15 | 39 | 0% | 42.6% |
| Controls | |||||||
| 0% to < 1% | 159 | 75 | 27 | 9 | 0 | 0% | 41.1% |
| 1% to 1.66% | 46 | 195 | 152 | 68 | 15 | 9.7% | 49.4% |
| 1.67% to 2.5% | 7 | 115 | 159 | 103 | 19 | 30.3% | 30.3% |
| 2.5% to 4% | 0 | 31 | 78 | 65 | 40 | 50.9% | 18.7% |
| > 4% | 0 | 8 | 20 | 32 | 39 | 60.6% | 0% |
Abbreviations: BBD-BC, benign breast disease–to–breast cancer model; BCRAT, Breast Cancer Risk Assessment Tool.
Table A3.
Calculation of Risk Scores and Corresponding Translation Into Risk Estimates for Three Hypothetical Women
| Risk Calculation and Translation | Example 1 |
Example 2 |
Example 3 |
|||
|---|---|---|---|---|---|---|
| Value | Points | Value | Points | Value | Points | |
| Part 1: calculation of risk score (see Table 4) | ||||||
| Main effect characteristic | ||||||
| (1) Histologic impression | NP | 0 | PD | 20.5 | PD | 20.5 |
| (2) No. of atypical foci | 0 | 0 | 0 | 0 | 1 | 24.4 |
| (3) Extent of lobular involution | Complete | 0 | Partial | 14.1 | Partial | 14.1 |
| (4) Presence of radial scar | No | 0 | No | 0 | Yes | 6.0 |
| (5) Presence of SA and/or CCA | Neither | 0 | SA or CCA | −4.7 | Neither | 0 |
| (6) Family History of Breast Cancer | No | 0 | Yes | 18.2 | Yes | 18.2 |
| (7) Age at first live birth and No. of children | ≥ 21 years, 1-2 children | −11.6 | ≤ 20 years, ≥ 1 child | −16.5 | Nulliparous | 0 |
| Effect-modifying characteristic | ||||||
| (8) Age at first live birth and No. of children, modified by histologic impression | Nullip or NP | 0 | ≤ 20 years, ≥ 1 child, and PD | −6.4 | Nullip or NP | 0 |
| (9) Age at first live birth and No. of children, modified by extent of lobular involution | Nullip or complete | 0 | ≤ 20 years, ≥ 1 child, and partial | −2.8 | Nullip or complete | 0 |
| (10) Extent of Involution, modified by SA and/or CCA | Complete or (neither SA nor CCA) | 0 | Partial and (either SA or CCA) | 9.2 | Complete or (neither SA nor CCA) | 0 |
| Risk score (sum of individuals points) | −11.6 | 31.6 | 83.2 | |||
| Part 2: translation into risk estimate (see Table 5) | ||||||
| Age at initial biopsy, years | 72 | 65 | 53 | |||
| 10-year risk, % | 3.0 | 8.7 | 21.2 | |||
| Lifetime risk, % | 3.8 | 16.4 | 54.8 | |||
NOTE. Example 1 represents a woman with characteristics reflecting low breast cancer risk. Example 2 represents a woman with characteristics of a moderate risk of breast cancer. Example 3 represents a woman with characteristics reflecting high breast cancer risk. Example 1 (low-risk woman): 72 years of age at initial biopsy, nonproliferative disease (and thus no atypical foci), complete involution, no radial scar, no SA, no CCA, negative family history of breast cancer, two children, and 25 years old at first birth. Example 2 (moderate-risk woman): 65 years of age at first biopsy, proliferative disease, no typical foci, partial involution, no radial scars, no SA, presence of CCA, positive family history of breast cancer, three children, and 19 years old at first birth. Example 3 (high-risk woman): 53 years of age at first biopsy, proliferative disease, one focus of atypia, partial involution, radial scars present, no SA, no CCA, positive family history of breast cancer, and nulliparous.
Abbreviations: CCA, columnar cell alteration; NP, nonproliferative disease; nullip, nulliparous; PD, proliferative disease; SA, sclerosing adenosis.
Fig A1.
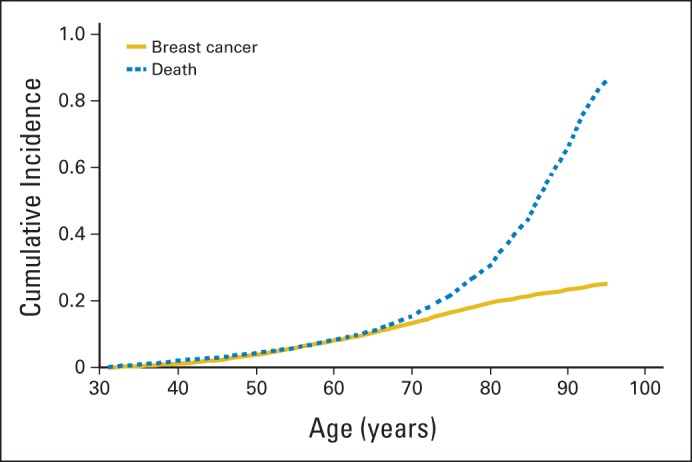
Cumulative incidence of breast cancer and of death among women with benign breast disease (BBD), estimated from the women enrolled onto the Mayo BBD cohort from 1967 to 1991.
Footnotes
Listen to the podcast by Dr Chlebowski at www.jco.org/podcasts
Supported by Mayo Clinic Breast Specialized Programs of Research Excellence Grant No. CA116201 (V.S.P., D.W.V., D.C.R., and L.C.H.) from the National Cancer Institute (NCI), “Risk Prediction for Breast Cancer: A Tissue-Based Strategy” Grant No. CA132879 (V.S.P. and L.C.H.) from the NCI, and the Jimmy V Foundation (D.C.R. and L.C.H.).
Terms in blue are defined in the glossary, found at the end of this article and online at www.jco.org.
Authors' disclosures of potential conflicts of interest are found in the article online at www.jco.org. Author contributions are found at the end of this article.
AUTHORS' DISCLOSURES OF POTENTIAL CONFLICTS OF INTEREST
Disclosures provided by the authors are available with this article at www.jco.org.
AUTHOR CONTRIBUTIONS
Conception and design: V. Shane Pankratz, Amy C. Degnim, Marlene H. Frost, Daniel W. Visscher, Robert A. Vierkant, Karthik Ghosh, Celine M. Vachon, Derek C. Radisky, Lynn C. Hartmann
Financial support: V. Shane Pankratz, Derek C. Rakisky, Lynn C. Hartmann
Administrative support: Marlene H. Frost, Lynn C. Hartmann
Provision of study materials or patients: Amy C. Degnim, Karthik Ghosh, Lynn C. Hartmann
Collection and assembly of data: Marlene H. Frost, Daniel W. Visscher, Yaman Tarabishy
Data analysis and interpretation: V. Shane Pankratz, Amy C. Degnim, Ryan D. Frank, Marlene H. Frost, Daniel W. Visscher, Robert A. Vierkant, Tina J. Hieken, Karthik Ghosh, Celine M. Vachon, Derek C. Radisky, Lynn C. Hartmann
Manuscript writing: All authors
Final approval of manuscript: All authors
AUTHORS' DISCLOSURES OF POTENTIAL CONFLICTS OF INTEREST
Model for Individualized Prediction of Breast Cancer Risk After a Benign Breast Biopsy
The following represents disclosure information provided by authors of this manuscript. All relationships are considered compensated. Relationships are self-held unlesnoted. I = Immediate Family Member, Inst = My Institution. Relationships may not relate to the subject matter of this manuscript. For more information about ASCO's conflict of interest policy, please refer to www.asco.org/rwc or jco.ascopubs.org/site/ifc.
V. Shane Pankratz
No relationship to disclose
Amy C. Degnim
No relationship to disclose
Ryan D. Frank
No relationship to disclose
Marlene H. Frost
No relationship to disclose
Daniel W. Visscher
No relationship to disclose
Robert A. Vierkant
No relationship to disclose
Tina J. Hieken
No relationship to disclose
Karthik Ghosh
No relationship to disclose
Yaman Tarabishy
No relationship to disclose
Celine M. Vachon
No relationship to disclose
Derek C. Radisky
No relationship to disclose
Lynn C. Hartmann
No relationship to disclose
REFERENCES
- 1.American Cancer Society. How many women get breast cancer? http://www.cancer.org/cancer/breastcancer/overviewguide/breast-cancer-overview-key-statistics.
- 2.Costantino JP, Gail MH, Pee D, et al. Validation studies for models projecting the risk of invasive and total breast cancer incidence. J Natl Cancer Inst. 1999;91:1541–1548. doi: 10.1093/jnci/91.18.1541. [DOI] [PubMed] [Google Scholar]
- 3.Gail MH, Brinton LA, Byar DP, et al. Projecting individualized probabilities of developing breast cancer for white females who are being examined annually. J Natl Cancer Inst. 1989;81:1879–1886. doi: 10.1093/jnci/81.24.1879. [DOI] [PubMed] [Google Scholar]
- 4.Rockhill B, Spiegelman D, Byrne C, et al. Validation of the Gail et al. model of breast cancer risk prediction and implications for chemoprevention. J Natl Cancer Inst. 2001;93:358–366. doi: 10.1093/jnci/93.5.358. [DOI] [PubMed] [Google Scholar]
- 5.Gutwein LG, Ang DN, Liu H, et al. Utilization of minimally invasive breast biopsy for the evaluation of suspicious breast lesions. Am J Surg. 2011;202:127–132. doi: 10.1016/j.amjsurg.2010.09.005. [DOI] [PubMed] [Google Scholar]
- 6.Dupont WD, Parl FF, Hartmann WH, et al. Breast cancer risk associated with proliferative breast disease and atypical hyperplasia. Cancer. 1993;71:1258–1265. doi: 10.1002/1097-0142(19930215)71:4<1258::aid-cncr2820710415>3.0.co;2-i. [DOI] [PubMed] [Google Scholar]
- 7.Hartmann LC, Sellers TA, Frost MH, et al. Benign breast disease and the risk of breast cancer. N Engl J Med. 2005;353:229–237. doi: 10.1056/NEJMoa044383. [DOI] [PubMed] [Google Scholar]
- 8.McDivitt RW, Stevens JA, Lee NC, et al. Histologic types of benign breast disease and the risk for breast cancer: The Cancer and Steroid Hormone Study Group. Cancer. 1992;69:1408–1414. doi: 10.1002/1097-0142(19920315)69:6<1408::aid-cncr2820690617>3.0.co;2-c. [DOI] [PubMed] [Google Scholar]
- 9.McKian KP, Reynolds CA, Visscher DW, et al. Novel breast tissue feature strongly associated with risk of breast cancer. J Clin Oncol. 2009;27:5893–5898. doi: 10.1200/JCO.2008.21.5079. [DOI] [PMC free article] [PubMed] [Google Scholar]
- 10.Milanese TR, Hartmann LC, Sellers TA, et al. Age-related lobular involution and risk of breast cancer. J Natl Cancer Inst. 2006;98:1600–1607. doi: 10.1093/jnci/djj439. [DOI] [PubMed] [Google Scholar]
- 11.Tyrer J, Duffy SW, Cuzick J. A breast cancer prediction model incorporating familial and personal risk factors. Stat Med. 2004;23:1111–1130. doi: 10.1002/sim.1668. [DOI] [PubMed] [Google Scholar]
- 12.Pankratz VS, Hartmann LC, Degnim AC, et al. Assessment of the accuracy of the Gail model in women with atypical hyperplasia. J Clin Oncol. 2008;26:5374–5379. doi: 10.1200/JCO.2007.14.8833. [DOI] [PMC free article] [PubMed] [Google Scholar]
- 13.Boughey JC, Hartmann LC, Anderson SS, et al. Evaluation of the Tyrer-Cuzick (International Breast Cancer Intervention Study) model for breast cancer risk prediction in women with atypical hyperplasia. J Clin Oncol. 2010;28:3591–3596. doi: 10.1200/JCO.2010.28.0784. [DOI] [PMC free article] [PubMed] [Google Scholar]
- 14.Benichou J, Gail MH. Estimates of absolute cause-specific risk in cohort studies. Biometrics. 1990;46:813–826. [PubMed] [Google Scholar]
- 15.Rosner B. Fundamentals of Biostatistics. ed 5. Pacific Grove, CA: Duxbury Press; 2000. [Google Scholar]
- 16.Rubin DB. Multiple imputation after 18+ years. J Am Stat Assoc. 1996;91:473–489. [Google Scholar]
- 17.Schafer JL. Multiple imputation: A primer. Stat Methods Med Res. 1999;8:3–15. doi: 10.1177/096228029900800102. [DOI] [PubMed] [Google Scholar]
- 18.Gail MH, Pee D. Breast Cancer Risk Assessment macro. http://dceg.cancer.gov/tools/risk-assessment/bcrasasmacro.
- 19.Mealiffe ME, Stokowski RP, Rhees BK, et al. Assessment of clinical validity of a breast cancer risk model combining genetic and clinical information. J Natl Cancer Inst. 2010;102:1618–1627. doi: 10.1093/jnci/djq388. [DOI] [PMC free article] [PubMed] [Google Scholar]
- 20.Hosmer DW, Lemeshow S. Applied Logistic Regression. New York, NY: Wiley; 1989. [Google Scholar]
- 21.Prentice RL, Pyke R. Logistic disease incidence models and case control studies. Biometrika. 1979;66:403–411. [Google Scholar]
- 22.Tice JA, Cummings SR, Smith-Bindman R, et al. Using clinical factors and mammographic breast density to estimate breast cancer risk: Development and validation of a new predictive model. Ann Intern Med. 2008;148:3037–3047. doi: 10.7326/0003-4819-148-5-200803040-00004. [DOI] [PMC free article] [PubMed] [Google Scholar]
- 23.Pencina MJ, D'Agostino RB, Sr, D'Agostino RB, Jr, et al. Evaluating the added predictive ability of a new marker: From area under the ROC curve to reclassification and beyond. Stat Med. 2008;27:157–172. doi: 10.1002/sim.2929. [DOI] [PubMed] [Google Scholar]
- 24.Kerr KF, Wang Z, Janes H, et al. Net reclassification indices for evaluating risk-prediction instruments: A critical review. Epidemiology. 2014;25:114–121. doi: 10.1097/EDE.0000000000000018. [DOI] [PMC free article] [PubMed] [Google Scholar]
- 25.Pepe MS, Kerr KF, Longton G, et al. Testing for improvement in prediction model performance. Stat Med. 2013;32:1467–1482. doi: 10.1002/sim.5727. [DOI] [PMC free article] [PubMed] [Google Scholar]
- 26.Dupont WD, Page DL. Risk factors for breast cancer in women with proliferative breast disease. N Engl J Med. 1985;312:146–151. doi: 10.1056/NEJM198501173120303. [DOI] [PubMed] [Google Scholar]
- 27.London SJ, Connolly JL, Schnitt SJ, et al. A prospective study of benign breast disease and the risk of breast cancer. JAMA. 1992;267:941–944. [PubMed] [Google Scholar]