

Abstract
Purpose
To examine the effects of disease burden, complex surgery, and residual disease (RD) status on progression-free (PFS) and overall survival (OS) in patients with advanced epithelial ovarian cancer (EOC) or primary peritoneal cancer (PPC) and complete surgical resection (R0) or < 1 cm of RD (MR) after surgical cytoreduction.
Patients and Methods
Demographic, pathologic, surgical, and outcome data were collected from 2,655 patients with EOC or PPC enrolled onto the Gynecologic Oncology Group 182 study. The effects of disease distribution (disease score [DS]) and complexity of surgery (complexity score [CS]) on PFS and OS were assessed using the Kaplan-Meier method and multivariable regression analysis.
Results
Consistent with existing literature, patients with MR had worse prognosis than R0 patients (PFS, 15 v 29 months; P < .01; OS, 41 v 77 months; P < .01). Patients with the highest preoperative disease burden (DS high) had shorter PFS (15 v 23 or 34 months; P < .01) and OS (40 v 71 or 86 months; P < .01) compared with those with DS moderate or low, respectively. This relationship was maintained in the subset of R0 patients with PFS (18.3 v 33.2 months; DS moderate or low: P < .001) and OS (50.1 v 82.8 months; DS moderate or low: P < .001). After controlling for DS, RD, an interaction term for DS/CS, performance status, age, and cell type, CS was not an independent predictor of either PFS or OS.
Conclusion
In this large multi-institutional sample, initial disease burden remained a significant prognostic indicator despite R0. Complex surgery does not seem to affect survival when accounting for other confounding influences, particularly RD.
INTRODUCTION
Epithelial ovarian cancer (EOC) is the most lethal gynecologic malignancy, with an estimated 21,980 cases leading to 14,720 deaths in 2014.1 Approximately 70% of patients are diagnosed at an advanced stage, with a median age at diagnosis of 63 years.2 Primary treatment includes aggressive surgical cytoreduction followed by adjuvant platinum and taxane-based chemotherapy. Several studies have shown a survival benefit from optimal (< 1 cm) residual disease (MR), particularly microscopic residual, at the time of primary debulking surgery (PDS) in EOC.3–11 A large meta-analysis showed that each 10% increase in the amount of cytoreduction was associated with a 5.5% increase in median survival time.6
Surgeons must decide whether to perform aggressive procedures at PDS based on their own surgical abilities, perceived risk of complications, and benefits of varying degrees of cytoreduction. As such, preoperative risk stratification and modeling have been developed.10 To date, the relative survival impact of preoperative extent of disease and surgical aggressiveness is unclear in patients with EOC. Preoperative extent of disease alone may affect patient survival, regardless of the amount of residual disease (RD) after primary surgery. Several studies have suggested that patients with extensive disease before cytoreductive surgery will have a worse prognosis despite optimal debulking to < 1 cm or microscopic disease.12–15 The degree to which aggressive surgical cytoreduction can overcome the negative impact of initial disease burden is controversial, and because of the lack of randomized controlled trials, it is still unclear whether surgical aggressiveness can overcome the impact of preoperative disease burden and extend survival. Our objective was to examine the effects of preoperative disease burden and complex surgery on RD, progression-free survival (PFS), and overall survival (OS) in optimally resected patients with advanced EOC or primary peritoneal cancer (PPC).
PATIENTS AND METHODS
All patient data for this study were abstracted from GOG (Gynecologic Oncology Group) –182 case report forms.16 Patients enrolled onto GOG-182 were diagnosed with International Federation of Gynecology and Obstetrics (FIGO) stage III or IV histologically confirmed EOC or PPC. All patients underwent primary cytoreductive surgery before being randomly assigned to one of five platinum and paclitaxel–based chemotherapy regimens. No statistically significant treatment effects on PFS or OS were found among the treatment regimens. Additional details of eligibility criteria and results from the original study have been published.16 All participants provided written informed consent in accordance with GOG, local institutional, and federal guidelines. PFS was defined as the number of months from date of random assignment in GOG-182 to documentation of disease progression or death, whichever came first. OS was defined as the number of months between date of entry in GOG-182 and death resulting from any cause. Patients who were still alive or alive and progression free were censored for OS and PFS, respectively, at the date of last follow-up.
Patient demographic and tumor characteristics, including age, race, performance status, tumor grade, and histology, were extracted from the GOG database. Information describing surgical procedures and preoperative extent of disease for 56 anatomic locations was abstracted from GOG surgical reporting forms, as well as from operative and pathology reports. Our study included patients with FIGO stage III or IV EOC or PPC and complete surgical resection (R0) or MR after primary cytoreductive surgery. These patients were further classified based on initial site of disease and complexity of the procedures used during PDS. Initial site of disease was used to develop the preoperative disease score (DS). The DS classes were defined as: DS low, with pelvic and retroperitoneal spread; DS moderate, with additional spread to the abdomen but sparing the upper abdomen; or DS high, with the presence of upper abdominal disease affecting the diaphragm, spleen, liver, or pancreas. Surgical complexity was based on a complexity score (CS), calculated using a published scoring system.10 Each procedure was assigned a weighted score ranging from 1 to 3, and the composite surgical complement was calculated by summing the weights for each patient (Appendix Table A1, online only). Patients were classified into groups based on total CS, as follows: CS low (score 1 to 3), CS moderate (score 4 to 7), or CS high (score ≥ 8). Patient outcomes were analyzed based on DS group, CS group, and amount of RD (MR or R0).
The simplified directed acyclic graph17 in Appendix Figure A1 (online only) describes our a priori beliefs about the relationships between DS, CS, RD status, and patient survival. Boxes represent observed factors of interest, and arrows indicate the causal ordering of each relationship. This directed acyclic graph was simplified to show only the main effects of the factors on their outcomes. Additional prognostic variables (ie, cell type, performance status, stage, age, ascites, RD volume, and so on) were included as adjustment covariates unless otherwise indicated. As appropriate, the models also included second- and third-order interactions between DS, CS, and RD.
The effect of DS classification on CS outcome was described using adjusted estimates for the odds of CS high (v CS moderate or low). These odds estimates were obtained from a multivariable multinomial regression model, adjusting for stage and presence of ascites. The effects of DS and CS on the probability of R0 (v MR) were described using odds ratio (OR) estimates obtained from a multivariable logistic regression model.
Effect size estimates were supported by 95% CIs, which described the plausible range of values for the true (unobserved) effect size in the population as supported by the data. In all cases, a two-sided P value < .05 was considered statistically significant. Univariable comparisons of demograhic, pathologic, surgical, and clinical characteristics were compared between the different DS (ie, DS high, moderate, and low) and CS groups (ie, CS high, moderate, and low) tested using the Kruskal-Wallis or Pearson χ2 test as appropriate. The Kaplan-Meier method was used for univariable description of differences in OS and PFS distributions across subgroups, augmented by log-rank test results.
Differences in the OS and PFS outcomes across the DS, CS, and RD subgroups were analyzed using multivariable proportional hazards models. The final models were obtained by a backward selection full model, using a retention threshold of P = .10 and respecting the hierarchy implied by the interaction terms. All data analyses were generated using SAS/STAT software (version 9.4; SAS Institute, Cary, NC).
RESULTS
GOG-182 assessed 4,312 women with FIGO stage III or IV EOC or PPC.16 After exclusion of 1,657 women with RD > 1 cm, this analysis included a total of 2,655 who underwent primary cytoreductive surgery to achieve R0 or MR (ie, R0 < MR < 1 cm residual; MR does not include R0 patients). There were 2,364 patients with FIGO stage III disease (89%) and 291 patients with stage IV disease. A total of 860 patients (32.4%) achieved R0, and 1,795 patients (67.6%) had MR disease. Groups stratified by DS included DS low (n = 173), DS moderat (n = 845), and DS high (n = 1,636; Appendix Fig A2, online only). Groups defined by CS included CS low (n = 456), CS moderate (n = 1,770), and CS high (n = 429). The clinical and pathologic characteristics of patients based on DS and CS are listed in Table 1.
Table 1.
Patient Clinical and Demographic Characteristics by Preoperative Disease Burden Group and Surgical CS
| Characteristic | DS |
CS |
||||||||||||
|---|---|---|---|---|---|---|---|---|---|---|---|---|---|---|
| Low (n = 173) |
Moderate (n = 845) |
High (n = 1,637) |
P | Low (n = 456) |
Moderate (n = 1,770) |
High (n = 429) |
P | |||||||
| No. | % | No. | % | No. | % | No. | % | No. | % | No. | % | |||
| Age group, years | .004 | .084 | ||||||||||||
| < 55 | 86 | 49.7 | 301 | 35.6 | 640 | 39.1 | 150 | 32.9 | 709 | 40.1 | 168 | 39.2 | ||
| 55-64 | 54 | 31.2 | 282 | 33.4 | 534 | 32.6 | 167 | 36.6 | 565 | 31.9 | 138 | 32.2 | ||
| ≥ 65 | 33 | 19.1 | 262 | 31.0 | 463 | 28.3 | 139 | 30.5 | 496 | 28.0 | 123 | 28.6 | ||
| Race | .083 | .655 | ||||||||||||
| White | 160 | 92.5 | 775 | 91.7 | 1,504 | 91.9 | 423 | 92.8 | 1,618 | 91.6 | 398 | 92.1 | ||
| Black | 2 | 1.1 | 32 | 3.8 | 65 | 4.0 | 18 | 4.0 | 66 | 3.7 | 14 | 3.5 | ||
| Other | 11 | 6.4 | 38 | 4.5 | 68 | 4.1 | 15 | 3.2 | 83 | 4.7 | 19 | 4.4 | ||
| Performance status | < .001 | .021 | ||||||||||||
| 0 | 119 | 68.8 | 478 | 56.6 | 740 | 45.2 | 247 | 54.2 | 907 | 51.2 | 183 | 42.6 | ||
| 1 | 47 | 27.2 | 322 | 38.1 | 752 | 46.0 | 175 | 38.4 | 737 | 41.6 | 209 | 48.7 | ||
| 2 | 2 | 1.1 | 23 | 2.7 | 107 | 6.5 | 26 | 5.7 | 77 | 4.4 | 29 | 6.8 | ||
| Missing | 5 | 2.9 | 22 | 2.6 | 38 | 2.3 | 8 | 1.8 | 49 | 2.8 | 8 | 1.9 | ||
| Disease site | < .001 | .107 | ||||||||||||
| EOC | 168 | 97.1 | 762 | 90.2 | 1,377 | 84.1 | 383 | 84.0 | 1,551 | 87.6 | 373 | 86.9 | ||
| Primary peritoneal | 5 | 2.9 | 83 | 9.8 | 260 | 15.9 | 73 | 16.0 | 219 | 12.4 | 56 | 13.1 | ||
| Histology | < .001 | .005 | ||||||||||||
| Serous | 101 | 58.4 | 635 | 75.1 | 1,416 | 86.5 | 364 | 79.8 | 1,411 | 79.7 | 377 | 87.9 | ||
| Endometrioid | 16 | 9.2 | 63 | 7.5 | 62 | 3.8 | 25 | 5.5 | 101 | 5.7 | 15 | 3.5 | ||
| Clear cell | 22 | 12.8 | 46 | 5.4 | 34 | 2.1 | 12 | 2.6 | 84 | 4.7 | 6 | 1.4 | ||
| Mucinous | 8 | 4.6 | 10 | 1.2 | 17 | 1.0 | 6 | 1.3 | 26 | 1.5 | 3 | 0.7 | ||
| Mixed epithelial | 17 | 9.8 | 66 | 7.8 | 73 | 4.5 | 35 | 7.7 | 108 | 6.1 | 13 | 3.0 | ||
| Other | 9 | 5.3 | 25 | 3.0 | 35 | 2.1 | 14 | 3.1 | 40 | 2.3 | 15 | 3.5 | ||
| Stage | < .001 | .002 | ||||||||||||
| III | 166 | 96.0 | 783 | 92.7 | 1,415 | 86.4 | 408 | 89.5 | 1,596 | 90.2 | 360 | 83.9 | ||
| IV | 7 | 4.0 | 62 | 7.3 | 222 | 13.6 | 48 | 10.5 | 174 | 9.8 | 69 | 16.1 | ||
| Grade | .241 | < .001 | ||||||||||||
| 1 | 9 | 6.3 | 45 | 6.5 | 57 | 4.2 | 35 | 9.3 | 62 | 4.3 | 14 | 4.0 | ||
| 2 | 32 | 22.4 | 153 | 22.1 | 293 | 21.8 | 89 | 23.7 | 327 | 22.5 | 62 | 17.7 | ||
| 3 | 102 | 71.3 | 495 | 71.4 | 993 | 74.0 | 251 | 67.0 | 1,064 | 73.2 | 275 | 78.3 | ||
| Ascites | < .001 | .001 | ||||||||||||
| Yes | 57 | 32.9 | 456 | 54.0 | 1,318 | 80.5 | 303 | 66.5 | 1,194 | 67.4 | 334 | 77.8 | ||
| No | 111 | 64.2 | 365 | 43.2 | 278 | 17.0 | 137 | 30.0 | 527 | 29.8 | 90 | 21.0 | ||
| Missing | 5 | 2.9 | 24 | 2.8 | 41 | 2.5 | 16 | 3.5 | 49 | 2.8 | 5 | 1.2 | ||
| Surgical CS | < .001 | |||||||||||||
| Low | 30 | 17.3 | 189 | 22.4 | 237 | 14.5 | — | — | — | |||||
| Moderate | 139 | 80.4 | 595 | 70.4 | 1,036 | 63.3 | — | — | — | |||||
| High | 4 | 2.3 | 61 | 7.2 | 364 | 22.2 | — | — | — | |||||
| DS | < .001 | |||||||||||||
| Low | — | — | — | 30 | 6.6 | 139 | 7.9 | 4 | 0.9 | |||||
| Moderate | — | — | — | 189 | 41.4 | 595 | 33.6 | 61 | 14.2 | |||||
| High | — | — | — | 237 | 52.0 | 1,036 | 58.5 | 364 | 84.9 | |||||
| RD | < .001 | .048 | ||||||||||||
| Microscopic | 151 | 87.3 | 510 | 60.4 | 199 | 12.2 | 155 | 34.0 | 588 | 33.2 | 117 | 27.3 | ||
| Macroscopic (< 1 cm) | 22 | 12.7 | 335 | 39.6 | 1,438 | 87.8 | 301 | 66.0 | 1,182 | 66.8 | 312 | 72.7 | ||
Abbreviations: CS, complexity score; DS, disease score; EOC, epithelial ovarian cancer; RD, residual disease.
Patients with higher DS tended to be older than those in lower disease burden groups (P = .005). Compared with other DS groups, higher proportions of DS-high patients had poor performance status (P < .001), stage IV disease (P < .001), and ascites (P < .001; Table 1). DS was not associated with type of chemotherapy received or frequency of discontinuation. Patients with more extensive disease distribution had the worst outcomes (Figs 1A and 1B), reflected in both lower PFS (median, 15.1 v 23.4 or 33.9 months; P < .01) and OS (median, 40.2 v 70.8 or 86.3 months; P < .01), respectively.
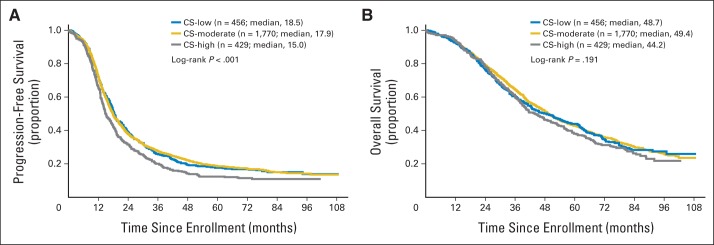
Fig 1.

(A) Progression-free and (B) overall survival, (C) stratified by preoperative disease burden and (D) further characterized by residual disease for those with high, moderate, and low disease scores. MR, < 1 cm of residual disease; R0, complete surgical resection.
Overall, patients with MR had worse prognoses than patients with R0 (PFS, 15.3 v 28.9 months; P < .01; OS, 40.6 v 76.9 months; P < .01; Figs 1C and 1D). Patients with higher CS tended to have poorer performance status (P = .011), stage IV disease (P < .001), and ascites (P < .001) compared with patients with less extensive surgery (Table 1). CS was not associated with age, adjuvant chemotherapy type, or frequency of discontinuation.
Association of DS and CS With RD
The main effect of DS and the DS/CS interaction were significant predictors of R0 (P < .01). However, the main effect of CS was not statistically significant (P = .23; Appendix Table A2, online only). We interpreted the significance of the interaction term as indicating that the DS effect on the probability of R0 was contingent on (ie, moderated by) CS status. This moderation was statistically significant within DS-high patients (P < .01 overall). Those with CS high were significantly more likely to obtain R0 than those with CS low (OR, 4.17; 95% CI, 2.30 to 7.56; P < .01) or CS moderate (OR, 2.66; 95% CI, 1.91 to 3.70; P ≤ .01). Approximately 40% of the DS-high patients who achieved R0 received CS high. Within the DS-low and DS-moderate patients, CS was not a differentiating factor for obtaining R0 (P = .76 overall; Appendix Table A3, online only).
To assess the possibility of an institutional bias in these results, the model was repeated in the subset of institutions with > 40% of patients having R0 after cytoreduction. This subset included 18 of the 78 institutions in the full sample and 425 of the 2,655 patients. The results of this subset of institutions, instead of all participating institutions, were similar. DS was an independent predictor of R0, but overall CS was not. However, CS was a significant predictor of R0 in the DS-high patients (P < .01 overall), as in the full model. The specification of the logistic regression model for RD outcome is provided in the Appendix (online only).
Association of DS, CS, and RD With Survival
Patients with microscopic RD (R0) had better outcomes than patients left with MR (Appendix Figs A3A and A3B, online only). Without any covariate adjustment, patients with more extensive DS had worse PFS (median: DS high, 15.1 v DS moderate, 23.4 v DS low, 33.9 months; P < .01) and OS (median, 40.2 v 70.8 or 86.3, respectively; P < .01; Figs 1A and 1B). Of the 1,636 patients with DS high, 199 (12%) were cytoreduced to R0. Despite achieving R0, those with an initial high disease burden still had a worse PFS (median: DS high, 18.3 v DS moderate/DS low, 33.2 months; P < .001) and OS (median: DS high, 50.1 v DS moderate/DS low, 82.8 months; P < .001) than those starting with smaller volume disease (Figs 1C and 1D). Comparing PFS for these 199 R0 patients with those with < 1 cm RD showed a modest improvement of approximately 4 months (median, 18.3 v 14.8 months; P < .001), whereas the OS differences for these two groups were more notable (median, 50.1 v 39.5 months; P < .001; Appendix Figs A4A and A4B, online only).
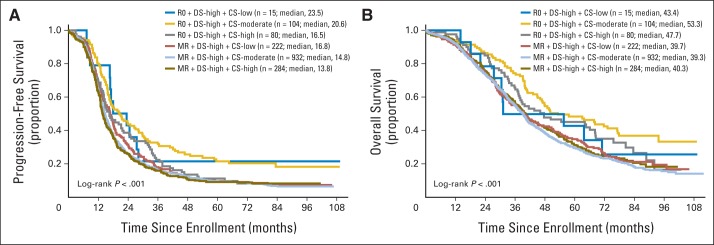
Patients who received more complex surgical procedures (CS high) had worse PFS compared with those receiving less aggressive surgery (median: CS high, 14.9 v CS moderate, 18.0 v CS low, 18.5 months; P < .001; Fig 2A); OS differences among the three groups were not significant (Fig 2B). Among DS-high patients, those with CS high were significantly more likely to obtain R0 than those with CS low or CS moderate (P < .01 for both). Compared with patients with DS high and MR, the PFS and OS for the 81 women with DS high who achieved R0 after CS high showed improvement in outcome (median, 16.5 and 46.1 v 13.6 and 40.4 months, respectively).
Fig 2.
(A) Progression-free and (B) overall survival among low, moderate, and high surgical complexity score groups.
Among patients with R0, those with DS moderate or low had better median PFS (33.2 v DS high, 18.3 months; P < .001) and OS (82.8 v DS high, 50.1 months; P < .001) than those with higher initial disease burden. In the subset of 1,636 DS-high patients, 364 (22.2%) were treated with CS high, and only 80 of those achieved R0 (21.7% success rate for CS high among DS-high patients). The OS benefit was not significantly different from that of the DS-high patients who achieved R0 by CS moderate or low (median, 47.7 v v 53.3 v 43.4 months, respectively; P = .29). PFS differences were similar (P = .11).
The final multivariable OS and PFS models included the second-order interaction and main effects for DS and RD, also controlling for age, stage, ascites, and performance score. In both models, all terms involving CS were eliminated (P > .13 for all) during backward selection, suggesting that CS was not an independent predictor of either outcome. Statistical significance of the second-order interaction in the OS model was interpreted as indicating contingent (or modifying) relationship on PFS between DS and RD. This term was retained in the PFS model for consistency. Our particular interest was in the conditional effect of DS on PFS after controlling for RD. In the PFS model, DS remained a statistically significant prognostic factor after controlling for RD status (P < .01 for both). Among R0 patients, those with DS low or moderate had better prognosis than DS-high patients. The DS low versus moderate comparison was not statistically significant (P = .31). Results for the MR patients were conflicting, in that prognosis for the DS-moderate patients was better than for the DS-high patients (P < .01) and DS-low patients (P = .03). The OS results were similar (Table 2).
Table 2.
Predictors of OS and PFS
| Variable | PFS |
OS |
||||
|---|---|---|---|---|---|---|
| HR* | 95% CI | P | HR* | 95% CI | P | |
| DS† | < .001 | < .001 | ||||
| RD† | < .001 | < .001 | ||||
| DS × RD | .003 | .56 | ||||
| Cytoreduction to R0 | ||||||
| DS low (ref, DS high) | 0.60 | 0.46 to 0.78 | < .01 | 0.66 | 0.49 to 0.91 | < .01 |
| DS moderate (ref, DS high) | 0.68 | 0.56 to 0.82 | < .01 | 0.68 | 0.54 to 0.85 | < .01 |
| Cytoreduction to ≤ 1 cm | ||||||
| DS low (ref, DS moderate) | 1.67 | 1.06 to 2.63 | .03 | 1.16 | 0.69 to 1.96 | .58 |
| DS moderate (ref, DS high) | 0.84 | 0.73 to 0.96 | < .01 | 0.75 | 0.64 to 0.88 | < .01 |
| Stage IV (ref, stage III) | 1.40 | 1.22 to 1.60 | < .001 | 1.45 | 1.26 to 1.67 | < .001 |
| No ascites (ref, yes) | 0.77 | 0.70 to 0.86 | < .001 | 0.75 | 0.66 to 0.85 | < .001 |
| Performance status (ref, asymptomatic) | .03 | .05 | ||||
| Fully ambulatory | 1.12 | 1.03 to 1.23 | .47 | 1.16 | 1.05 to 1.28 | .63 |
| In bed < 50% | 1.29 | 1.06 to 1.57 | .18 | 1.20 | 0.97 to 1.49 | .54 |
| In bed > 50% | 0.55 | 0.08 to 3.94 | .49 | 0.88 | 0.12 to 6.29 | .83 |
| Cell type other (ref, serous) | Excluded | 1.17 | 1.03 to 1.33 | .02 | ||
| Age (per 1-year increase) | 1.004 | 1.000 to 1.008 | .04 | 1.012 | 1.007 to 1.016 | < .001 |
Abbreviations: DS, disease score; HR, hazard ratio; OS, overall survival; PFS, progression-free survival; RD, residual disease; ref, reference.
HR estimates obtained from multivariable proportional hazards models.
For DS × RD interaction, group-specific HRs were determined based on fitted model and are shown instead of main effects.
DISCUSSION
The relationship between disease burden or distribution and surgical complexity to achieve optimal cytoreduction is intuitive; more surgery should be required to remove more widespread disease if the goal is microscopic RD. However, the measured effect that disease distribution and surgical procedure individually have on patient outcome is poorly understood. Many speculate that the behavior and distribution of poor-prognosis tumors may be determined by their unique molecular profile.18,19 Radical cytoreductive surgery has been proposed by many as a tool to optimize outcome in patients with widespread disease, particularly when RD can be minimized. Our investigative study assessed the contributory effects of disease distribution, complexity of surgery, and RD in determining patient outcome using the largest clinical trial of patients with ovarian cancer conducted to date, to our knowledge.
In our analysis, we explored the relationship between disease distribution and surgical complexity. We showed that both higher DS and increased RS resulted in worse outcome compared with patients with less disease distribution before and after surgery. Patients with high DS tended to have higher CS compared with patients with lower DS. However, the rate of CS high generally remained low, even in patients with the highest DS. Our findings suggest a moderating effect of CS on the association between DS and RD. Particularly in DS-high patients, CS high was more likely to result in R0. No CS effect was observed among patients with DS low or moderate. Our multivariable analyses showed that the mutually contingent effects of DS and RD were significant predictors of PFS and OS. After controlling for these effects, CS was not an independent prognostic indicator. Rather, results from the RD outcome model suggest that CS has an indirect effect on prognosis, modifying the natural disease process by reducing the tumor burden. Consistent with other published studies, our analysis showed significant OS and PFS benefits for R0 over MR. This finding suggests that more aggressive surgery may be warranted if R0 can be achieved. However, even in these ideal cases, the initial disease burden remained a significant prognostic indicator.20 These data confirm that R0 is a surgical observation, which can be associated with variations in outcome depending on DS.
The decision regarding extent of surgery also incorporates an assessment of morbidity and mortality probabilities. Approximately 20% to 25% of patients undergoing aggressive complex surgical cytoreduction will have significant postoperative morbidity, and approximately 1% to 2% of women will not survive this approach.21–23 Unfortunately, perioperative morbidity and mortality data were not collected by our group, and therefore, we cannot assess the rates of surgical complications in this patient population. The risk of adverse events should also be weighed along with resectability in selection of patients with ovarian cancer for complex surgical procedures. These findings might suggest that complex surgical procedures should be selectively used in patients with significant disease distribution and limited to those where only microscopic residual can be achieved.
The persistent effect of initial disease burden may highlight the role of neoadjuvant chemotherapy. In the randomized European Organisation for Research and Treatment of Cancer–National Cancer Institute of Canada trial of PDS versus neoadjuvant chemotherapy (NACT) reported by Vergote et al,24 the authors showed that NACT was not an inferior treatment option. However, results of that study may not be generalizable, because R0 was achieved in only 19% of patients, with one institution achieving R0 rates of 62%, whereas the other six enrolling institutions had rates of R0 < 10%. In a single-institution study, investigators at the Memorial Sloan Kettering Cancer Center compared non–randomly assigned patients undergoing PDS or NACT and found markedly improved outcome data associated with PDS.25 In their patient population, 24% of patients undergoing PDS were R0.
Is it possible that in centers where higher rates of complete cytoreduction can be achieved, the effects of CS on survival can be observed? Although this is speculative, data from Bristow et al26 suggest that outcomes are improved in those centers where surgical volume is the highest and where perhaps surgical expertise is the most advanced. Although we were investigating a subset of patients from GOG-182 (< 1 cm of RD), we found that when we restricted our multivariable analysis to only those institutions that achieved complete resection in > 40% of patients with < 1 cm RD, our conclusions were not changed. A randomized clinical trial comparing PDS versus NACT has been considered by the GOG, but this may no longer be an opportunity after restructuring of the cooperative groups. Therefore, given the size of our data set, uniformity in treatments and outcomes, and use of contemporary surgical management, our current data may provide the best GOG resource to guide therapy and understanding of DS, CS, and RD in the near future.
In conclusion, over the last decade, there has been a growing trend toward more aggressive PDS for women with EOC.22,23,25,27 Our current data show that for those with low or moderate preoperative disease, this approach remains important, because superior PFS and OS can be achieved for those patients with R0, even with increasing surgical complexity. In the absence of a prospective trial addressing these questions, the strength of this data set confirms the analysis of other groups strongly suggesting that clinically significant survival gains are achieved through R0. Likewise, there are certainly limits to what is surgically feasible or prudent, and these limits may lie with the surgeon or patient. We must continue to refine techniques to better determine preoperatively, or even at laparoscopy or initial exploration, candidates for surgical cytoreduction to R0 with acceptable morbidity. Finally, we suggest the consideration of (and additional studies should explore) a potential paradigm shift, in which, if R0 is difficult to attain at primary cytoreduction, use of neoadjuvant chemotherapy with interval debulking to allow for R0 may be superior to primary surgery after which the patient is left with gross RD.
Supplementary Material
Acknowledgment
Presented in part at the Society of Gynecologic Oncology (SGO) 2012 Annual Meeting on Women's Cancer, Austin, TX, March 27-29, 2011, and SGO 2014 Annual Meeting on Women's Cancer, Tampa, FL, March 28-April 1, 2014.
Appendix
Association of Disease and Complexity Scores With Residual Disease: Details on Modeling
The main effects and interactions of disease score (DS) and complexity score (CS) groups on the probability of microscopic residual disease (v ≤ 1 cm) were modeled using multivariable logistic regression. Several conclusions were observed.
First, given CS and the DS/CS interaction, the main effect of DS on residual disease (RD) remained statistically significant (P < .01).
Second, given DS and the DS/CS interaction, the main effect of CS on RD was not statistically significant (P = .23), suggesting that CS does not have a direct effect on RD. Rather, CS classification had an indirect effect on residual disease outcome, through its moderation of the DS effect. Among DS-high patients, those with CS high were significantly more likely to obtain microscopic RD than those with CS low or moderate (P < .01 for both). Among DS-low and DS-moderate patients, the probability of an RD outcome was not affected by CS (P = .68).
Third, the interaction of DS and CS was statistically significant (P < .01), given the other covariates. This suggests that CS indirectly affects the RD outcome by mediating the direct effect of DS. The association between DS and RD outcome depends on the CS level.
Fourth, the model was repeated for patients from institutions in which > 40% of patients with RD < 1 cm actually had complete resection with cytoreduction. This threshold was arbitrary but large enough to provide a reasonable sample size for modeling while exceeding the overall rate of 32% for all institutions combined. Our results using the subset of institutions instead of all participating institutions were similar. There did not seem to be an institutional bias in the conclusions reached in this study.
Gynecologic Oncology Group Member Institutions
The following Gynecologic Oncology Group member institutions participated in the primary treatment studies: University of Alabama at Birmingham, Oregon Health Sciences University, Duke University Medical Center, Abington Memorial Hospital, University of Rochester Medical Center, Walter Reed Army Medical Center, Wayne State University, University of Minnesota Medical School, University of Southern California at Los Angeles, University of Mississippi Medical Center, Colorado Gynecologic Oncology Group, University of California at Los Angeles, University of Washington, University of Pennsylvania Cancer Center, University of Miami School of Medicine, Milton S. Hershey Medical Center, Georgetown University Hospital, University of Cincinnati, University of North Carolina School of Medicine, University of Iowa Hospitals and Clinics, University of Texas Southwestern Medical Center at Dallas, Indiana University School of Medicine, Wake Forest University School of Medicine, Albany Medical College, University of California Medical Center at Irvine, Tufts–New England Medical Center, Rush-Presbyterian–St Luke's Medical Center, University of Kentucky, Eastern Virginia Medical School, Cleveland Clinic Foundation, Johns Hopkins Oncology Center, State University of New York at Stony Brook, Eastern Pennsylvania Gynecology/Oncology Center, Southwestern Oncology Group, Washington University School of Medicine, Memorial Sloan Kettering Cancer Center, Columbus Cancer Council, University of Massachusetts Medical School, Fox Chase Cancer Center, Medical University of South Carolina, Women's Cancer Center, University of Oklahoma, University of Virginia Health Sciences Center, University of Chicago, University of Arizona Health Science Center, Tacoma General Hospital, Eastern Collaborative Oncology Group, Thomas Jefferson University Hospital, Case Western Reserve University, and Tampa Bay Cancer Consortium.
Table A1.
Surgical CS
| Procedure | Points* |
|---|---|
| TH-BSO | 1 |
| Omentectomy | 1 |
| Pelvic lymphadenectomy | 1 |
| Paraaortic lymphadenectomy | 1 |
| Pelvic peritoneum stripping | 1 |
| Abdominal peritoneum stripping | 1 |
| Small bowel resection | 1 |
| Large bowel resection | 2 |
| Diaphragm stripping or resection | 2 |
| Splenectomy | 2 |
| Liver resection | 2 |
| Rectosigmoidectomy with reanastomosis | 3 |
Abbreviations: CS, complexity score; TH-BSO, total hysterectomy and bilateral salpingo-oophorectomy.
Surgical scoring: low, 1 to 3 points; moderate, 4 to 7 points; high, ≥ 8 points.
Table A2.
Predictors of Minimal RD
| Variable | P |
|---|---|
| Stage | .109 |
| Ascites | < .001 |
| Preoperative DS | < .001 |
| CS | .228 |
| DS × CS | < .001 |
NOTE. Multivariable logistic regression analysis controlling for variables listed.
Abbreviations: CS, complexity score; DS, disease score; RD, residual disease.
Table A3.
Predictors of Minimal RD
| DS Group and CS Comparison | Omnibus P | Adjusted OR | 95% CI | P |
|---|---|---|---|---|
| All institutions | ||||
| DS low or moderate | .76 | |||
| DS low or moderate | < .01 | |||
| CS moderate v low | 1.57 | 0.88 to 2.79 | .13 | |
| CS high v low | 4.17 | 2.30 to 7.56 | < .01 | |
| CS high v moderate | 2.66 | 1.91 to 3.70 | < .01 | |
| Institutions where R0 > 40% | ||||
| DS low or moderate | .66 | |||
| DS low or moderate | < .01 | |||
| CS moderate v low | 1.55 | 0.42 to 5.77 | .52 | |
| CS high v low | 7.15 | 1.89 to 27.12 | < .01 | |
| CS high v moderate | 4.62 | 2.23 to 9.59 | < .01 |
Adjusted OR estimates comparing RD outcome R0 (ref, MR) for CS classes in patients with DS high. In DS-low and DS-moderate patients, CS was not statistically significant predictor of RD (P = .76). In DS-high patients, R0 was significantly more likely outcome with CS high than with either CS low or moderate. Results were similar in subset of patients treated at institutions where R0 rate > 40%. Omnibus P values were obtained from full- or reduced-model likelihood ratio tests for overall CS effect within DS groups indicated.
Abbreviations: CS, complexity score; DS, disease score; MR, < 1 cm of residual disease; R0, complete surgical resection; RD, residual disease.
Fig A1.

Determinants of patient outcome; design of multivariable models.
Fig A2.
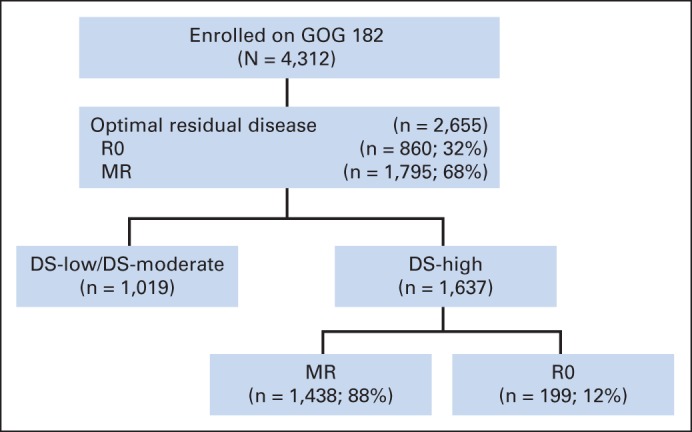
Patients enrolled onto GOG (Gynecologic Oncology Group) –182. DS, disease score; MR, < 1 cm of residual disease; R0, complete surgical resection.
Fig A3.

(A) Progression-free and (B) overall survival. MR, < 1 cm of residual disease; R0, complete surgical resection.
Fig A4.
(A) Progression-free and (B) overall survival. CS, complexity score; DS, disease score; MR, < 1 cm of residual disease; R0, complete surgical resection.
Footnotes
Listen to the podcast by Dr Coleman at www.jco.org/podcasts
Supported by National Cancer Institute Grants No. CA 27469 to the Gynecologic Oncology Group (GOG) Administrative Office and No. CA 37517 to the GOG Statistical Office.
The opinions or assertions expressed in this article represent the private views of the authors and should not be construed as reflecting the official views of the Department of the Air Force, Department of the Navy, Department of the Army, or Department of Defense.
Authors' disclosures of potential conflicts of interest are found in the article online at www.jco.org. Author contributions are found at the end of this article.
AUTHORS' DISCLOSURES OF POTENTIAL CONFLICTS OF INTEREST
Disclosures provided by the authors are available with this article at www.jco.org.
AUTHOR CONTRIBUTIONS
Conception and design: Neil S. Horowitz, Noah Rodriguez, Chad A. Hamilton, Thomas C. Krivak, G. Larry Maxwell
Financial support: Thomas C. Krivak
Provision of study materials or patients: Neil S. Horowitz, Thomas C. Krivak
Collection and assembly of data: Neil S. Horowitz, Bunja Rungruang, Scott D. Richard, Noah Rodriguez, Chad A. Hamilton, Thomas C. Krivak
Data analysis and interpretation: Neil S. Horowitz, Austin Miller, Bunja Rungruang, Michael A. Bookman, Chad A. Hamilton, Thomas C. Krivak, G. Larry Maxwell
Manuscript writing: All authors
Final approval of manuscript: All authors
AUTHORS' DISCLOSURES OF POTENTIAL CONFLICTS OF INTEREST
Does Aggressive Surgery Improve Outcomes? Interaction Between Preoperative Disease Burden and Complex Surgery in Patients With Advanced-Stage Ovarian Cancer: An Analysis of GOG 182
The following represents disclosure information provided by authors of this manuscript. All relationships are considered compensated. Relationships are self-held unless noted. I = Immediate Family Member, Inst = My Institution. Relationships may not relate to the subject matter of this manuscript. For more information about ASCO's conflict of interest policy, please refer to www.asco.org/rwc or jco.ascopubs.org/site/ifc.
Neil S. Horowitz
No relationship to disclose
Austin Miller
No relationship to disclose
Bunja Rungruang
No relationship to disclose
Scott D. Richard
No relationship to disclose
Noah Rodriguez
No relationship to disclose
Michael A. Bookman
No relationship to disclose
Chad A. Hamilton
No relationship to disclose
Thomas C. Krivak
No relationship to disclose
G. Larry Maxwell
No relationship to disclose
REFERENCES
- 1.Siegel R, Naishadham D, Jemal A. Cancer Statistics, 2013. CA Cancer J Clin. 2013;63:11–30. doi: 10.3322/caac.21166. [DOI] [PubMed] [Google Scholar]
- 2.Reis LAG, Eisner MP, Kosary CL, et al., editors. SEER Cancer Statistics Review, 1975-2001. http://www.seer.cancer.gov/csr/1975_2001/
- 3.Makar AP, Baekelandt M, Tropé CG, et al. The prognostic significance of residual disease, FIGO substage, tumor histology, and grade in patients with FIGO stage III ovarian cancer. Gynecol Oncol. 1995;56:175–180. doi: 10.1006/gyno.1995.1027. [DOI] [PubMed] [Google Scholar]
- 4.Eisenkop SM, Friedman RL, Wang H. Complete cytoreductive surgery is feasible and maximizes survival in patients with advanced epithelial ovarian cancer: A prospective study. Gynecol Oncol. 1998;69:103–106. doi: 10.1006/gyno.1998.4955. [DOI] [PubMed] [Google Scholar]
- 5.Eisenkop SM, Spirtos NM. Procedures required to accomplish complete cytoreduction of ovarian cancer: Is there a correlation with “biological aggressiveness” and survival? Gynecol Oncol. 2001;82:435–441. doi: 10.1006/gyno.2001.6313. [DOI] [PubMed] [Google Scholar]
- 6.Bristow RE, Tomacruz RS, Armstrong DK, et al. Survival effect of maximal cytoreductive surgery for advanced ovarian carcinoma during the platinum era: A meta-analysis. J Clin Oncol. 2002;20:1248–1259. doi: 10.1200/JCO.2002.20.5.1248. [DOI] [PubMed] [Google Scholar]
- 7.Eisenkop SM, Spirtos NM, Friedman RL, et al. Relative influences of tumor volume before surgery and the cytoreductive outcome on survival for patients with advanced ovarian cancer: A prospective study. Gynecol Oncol. 2003;90:390–396. doi: 10.1016/s0090-8258(03)00278-6. [DOI] [PubMed] [Google Scholar]
- 8.Chi DS, Eisenhauer EL, Lang J, et al. What is the optimal goal of primary cytoreductive surgery for bulky stage IIIC epithelial ovarian carcinoma (EOC)? Gynecol Oncol. 2006;103:559–564. doi: 10.1016/j.ygyno.2006.03.051. [DOI] [PubMed] [Google Scholar]
- 9.Winter WE, 3rd, Maxwell GL, Tian C, et al. Prognostic factors for stage III epithelial ovarian cancer: A Gynecologic Oncology Group study. J Clin Oncol. 2007;25:3621–3627. doi: 10.1200/JCO.2006.10.2517. [DOI] [PubMed] [Google Scholar]
- 10.Winter WE, 3rd, Maxwell GL, Tian C, et al. Tumor residual after surgical cytoreduction in prediction of clinical outcome in stage IV epithelial ovarian cancer: A Gynecologic Oncology Group study. J Clin Oncol. 2008;26:83–89. doi: 10.1200/JCO.2007.13.1953. [DOI] [PubMed] [Google Scholar]
- 11.Aletti GD, Dowdy SC, Podratz KC, et al. Relationship among surgical complexity, short-term morbidity, and overall survival in primary surgery for advanced ovarian cancer. Am J Obstet Gynecol. 2007;197:676.e1–676.e7. doi: 10.1016/j.ajog.2007.10.495. [DOI] [PubMed] [Google Scholar]
- 12.Chi DS, Eisenhauer EL, Zivanovic O, et al. Improved progression-free and overall survival in advanced ovarian cancer as a result of a change in surgical paradigm. Gynecol Oncol. 2009;114:26–31. doi: 10.1016/j.ygyno.2009.03.018. [DOI] [PubMed] [Google Scholar]
- 13.Hamilton CA, Miller A, Miller C, et al. The impact of disease distribution on survival in patients with stage III epithelial ovarian cancer cytoreduced to microscopic residual: A Gynecologic Oncology Group study. Gynecol Oncol. 2011;122:521–526. doi: 10.1016/j.ygyno.2011.04.041. [DOI] [PMC free article] [PubMed] [Google Scholar]
- 14.Hoskins WJ, Bundy BN, Thigpen JT, et al. The influence of cytoreductive surgery on recurrence-free interval and survival in small-volume stage III epithelial ovarian cancer: A Gynecologic Oncology Group study. Gynecol Oncol. 1992;47:159–166. doi: 10.1016/0090-8258(92)90100-w. [DOI] [PubMed] [Google Scholar]
- 15.Crawford SC, Vasey PA, Paul J, et al. Does aggressive surgery only benefit patients with less advanced ovarian cancer? Results from an international comparison within the SCOTROC-1 trial. J Clin Oncol. 2005;23:8802–8811. doi: 10.1200/JCO.2005.02.1287. [DOI] [PubMed] [Google Scholar]
- 16.Bookman MA, Brady MF, McGuire WP, et al. Evaluation of new platinum-based treatment regimens in advanced-stage ovarian cancer: A phase III trial of the Gynecologic Cancer Intergroup. J Clin Oncol. 2009;27:1419–1425. doi: 10.1200/JCO.2008.19.1684. [DOI] [PMC free article] [PubMed] [Google Scholar]
- 17.Greenland S, Pearl J, Robins JM. Causal diagrams for epidemiologic research. Epidemiology. 1999;10:37–48. [PubMed] [Google Scholar]
- 18.Berchuck A, Iversen ES, Lancaster JM, et al. Prediction of optimal versus suboptimal cytoreduction of advanced stage serous ovarian cancer with the use of microarray. Am J Obstet Gynecol. 2004;190:910–925. doi: 10.1016/j.ajog.2004.02.005. [DOI] [PubMed] [Google Scholar]
- 19.Bonome T, Levine DA, Shih J, et al. A gene signature predicting for survival in suboptimally debulked patients with ovarian cancer. Cancer Res. 2008;68:5478–5486. doi: 10.1158/0008-5472.CAN-07-6595. [DOI] [PMC free article] [PubMed] [Google Scholar]
- 20.Rodriguez N, Miller A, Richard SD, et al. Upper abdominal procedures in advanced stage ovarian or primary peritoneal carcinoma patients with minimal or no gross residual disease: An analysis of Gynecologic Oncology Group (GOG) 182. Gynecol Oncol. 2013;130:487–492. doi: 10.1016/j.ygyno.2013.06.017. [DOI] [PubMed] [Google Scholar]
- 21.Gerestein CG, Nieuwenhuyzen-de Boer GM, Eijkemans MJ, et al. Prediction of 30-day morbidity after primary cytoreductive surgery for advanced stage ovarian cancer. Eur J Cancer. 2010;46:102–109. doi: 10.1016/j.ejca.2009.10.017. [DOI] [PubMed] [Google Scholar]
- 22.Peiretti M, Zanagnolo V, Aletti GD, et al. Role of maximal primary cytoreductive surgery in patients with advanced epithelial ovarian and tubal cancer: Surgical and oncologic outcomes—Single institution experience. Gynecol Oncol. 2010;119:259–264. doi: 10.1016/j.ygyno.2010.07.032. [DOI] [PubMed] [Google Scholar]
- 23.Chi DS, Zivanovic O, Levinson KL, et al. The incidence of major complications after the performance of extensive upper abdominal surgical procedures during primary cytoreduction of advanced ovarian, tubal, and peritoneal carcinomas. Gynecol Oncol. 2010;119:38–42. doi: 10.1016/j.ygyno.2010.05.031. [DOI] [PubMed] [Google Scholar]
- 24.Vergote I, Tropé CG, Amant F, et al. Neoadjuvant chemotherapy or primary surgery in stage IIIC or IV ovarian cancer. N Engl J Med. 2010;363:943–953. doi: 10.1056/NEJMoa0908806. [DOI] [PubMed] [Google Scholar]
- 25.Chi DS, Musa F, Dao F, et al. An analysis of patients with bulky advanced stage ovarian, tubal, and peritoneal carcinoma treated with primary debulking surgery (PDS) during an identical time period as the randomized EORTC-NCIC trial of PDS vs neoadjuvant chemotherapy (NACT) Gynecol Oncol. 2012;124:10–14. doi: 10.1016/j.ygyno.2011.08.014. [DOI] [PubMed] [Google Scholar]
- 26.Bristow RE, Powell MA, Al-Hammadi N, et al. Disparities in ovarian cancer care quality and survival according to race and socioeconomic status. J Natl Cancer Inst. 2013;105:823–832. doi: 10.1093/jnci/djt065. [DOI] [PMC free article] [PubMed] [Google Scholar]
- 27.Aletti GD, Dowdy SC, Gostout BS, et al. Aggressive surgical effort and improved survival in advanced-stage ovarian cancer. Am J Obstet Gynecol. 2006;107:77–85. doi: 10.1097/01.AOG.0000192407.04428.bb. [DOI] [PubMed] [Google Scholar]
Associated Data
This section collects any data citations, data availability statements, or supplementary materials included in this article.