Abstract
Stress and high-calorie diet increase the risk of developing metabolic syndrome. Glycyrrhizic acid (GA) has been shown to improve hyperglycaemia and dyslipidaemia under various physiological conditions. This study was aimed at examining the effects of stress and GA on glucose metabolism under short- or long-term stress. Forty-eight Sprague Dawley rats were divided into two groups with constant stress induced by light (300-400 lux) for either 14 days (short-term stress) or 28 days (long-term stress). Within each group, the rats were subdivided into three treatment groups i.e. Group A (control group): high-calorie diet (HCD) only; Group B: HCD + stress (14 or 28 days) and Group C: HCD + stress (14 or 28 days) + GA (100 mg/kg). The blood glucose concentrations of the rats exposed to 14-day stress were elevated significantly and GA lowered blood glucose concentration significantly in the 14-day exposure group. The 28-day exposure group adapted to stress as shown by the lower adrenaline level and gluconeogenic enzymes activities in most of the tissues than the 14-day exposure group. With regards to adrenaline and corticosterone, GA was found to increased adrenaline significantly in the short-term exposure group while lowering corticosterone in the long-term exposure group. GA-treated short- and long-term exposure groups had significant reduction in hexose-6-phosphate dehydrogenase activities in the visceral adipose tissues and quadriceps femoris respectively. The results may indicate the role of GA in improving blood glucose concentration in individuals exposed to short-term stress who are already on a high-calorie diet via selective action on gluconeogenic enzymes in different tissues.
Keywords: Stress, metabolic syndrome, glycyrrhizic acid, gluconeogenic enzymes, phosphoenolpyruvate carboxykinase, hexose-6-phosphate dehydrogenase, glucose-6-phosphatase
Introduction
Stress is defined as a disruption of homeostasis, which can be triggered by psychological or physiological stimuli [1]. It is a common phenomenon in the modern society regardless of its origin from social interactions and/or environmental disruptions. Together with excessive consumption of high-calorie diets (high in carbohydrate and/or fat content), it is recognized as the main contributor to the development of various chronic diseases such as cardiovascular diseases and diabetes [2]. In response to stress, the stress systems i.e. hypothalamic-pituitary-adrenal (HPA) axis and locus coerulus-norepinephrine (LC/NE)/sympathetic nervous system (SNS) are activated and produce glucocorticoids (GC) and catecholamines, respectively with the aim of increasing substrates and energy mobilization. These events facilitate the maintenance of homeostasis and survival through various psychological and physiological challenges in everyday life [1]. The adverse effects of stress on humans and animals are well documented, the main consequence being the altered energy homeostatic state that contributes to obesity [3]. Animal studies have shown that stress increased the tendency to consume highly palatable foods such as fat and sugar known as ‘comfort eating’ [3]. These imply that stressed subjects usually have higher calorie intake than non-stressed individuals. The relationship between stress and the development of the metabolic syndrome (MetS) is well-documented in the Whitehall II study, a prospective study conducted on the civil servants for 14 years [4]. It was found that employees with chronic work stress had a higher tendency to develop MetS than those without work stress. Furthermore, chronic stimulation of the stress systems followed by over-production of the stress related hormones i.e. catecholamines and GCs has been associated with the development of MetS (characterized by visceral obesity, hyperglycaemia, dyslipidaemia, insulin resistance and hypertension) [5].
To stimulate stress during animal studies, various methods may be used. A commonly used method for nocturnal animals is constant light illumination [6]. Light affects the behavior and physiology of laboratory animals mainly via the regulation of circadian rhythms and breeding cycles [7]. For example, rats’ eyes are conditioned towards light between 1-40 lux and light intensity as low as 60 lux is sufficient to cause mild distress in rats [8] while constant light exposure of above 200 lux was found to exert significant stress in rats [9].
Gluconeogenesis is the process of de novo hepatic glucose synthesis from precursors such as lactate, glycerol and amino acids in various tissues [10]. In response to stress, gluconeogenesis is activated under tight regulation of stress hormones such as GCs [11] to increase fuel supply to the important organ e.g. brain. The two main gluconeogenic enzymes are phosphoenolpyruvate carboxykinase (PEPCK) and glucose-6-phosphatase (G6Pase). PEPCK is the rate-limiting enzyme of gluconeogenesis mainly found in the liver, kidney and adipose tissues. Gene regulation of PEPCK exhibits tissue-specific characteristics and is affected by both dietary factors and hormones such as insulin, glucagon and GCs. G6Pase is a membrane-bound enzyme associated with the endoplasmic reticulum (ER), which is mainly found in the two most important gluconeogenic tissues, liver and kidneys [12]. Hexose-6-phosphate dehydrogenase (H6PDH) catalyzes the conversion of glucose-6-phosphate to 6-phosphoglucuronate as the first step of pentose phosphate pathway [13]. This enzyme is of interest due to its close association with 11β-hydroxysteroid dehydrogenase (11β-HSD) (exists as isoforms 1 and 2), an enzyme that catalyzes the interconversion of active and inactive GC. H6PDH has been established as the major enzyme capable of reducing NADP+ in the ER lumen [14] and this is important because 11β-HSD1 requires NADPH for GC activation.
The triad of G6Pase/H6PDH/11β-HSD1 plays an important role in the pathophysiology of glucotoxicity, lipotoxicity and glucolipotoxicity mainly via the induction of ER stress [15]. Elevated H6PDH activity caused by excessive nutrition supports GC activation locally. The adverse effects following GC activation such as increased hepatic gluconeogenesis and triacylglycerol synthesis in the adipose tissue contribute to the development of the metabolic syndrome and type 2 diabetes mellitus (T2DM) [16].
Glycyrrhizic acid (GA), a triterpenoid compound found in the root of the licorice plant, Glycyrrhizaglabra [17] has been shown to improve glucose and lipid metabolism under different physiological conditions [18-24]. The effects of GA are manifested via non-selective inhibition of 11β-hydroxysteroid dehydrogenase [17]. Oral administration of GA for 24 hours has been shown to improve blood glucose level with concomitant increase in peroxisome proliferator-activated receptors gamma and lipoprotein lipase expressions in the adipose tissues and skeletal muscles [25]. A diet high in fats and sugar content and stress originating from daily life challenges have been related to the development of MetS. Since our previous studies have shown that GA improves glucose and lipid metabolism in high-fat and high-sucrose diet fed rats [20,21], this study was designed to investigate the effects of short- and long-term stress in combination with a high-calorie diet (HCD) on the stress hormones adrenaline and corticosterone as well as the gluconeogenic enzymes i.e. PEPCK, G6Pase and H6PDH in rats and to assess how GA plays its role in the modulation of the above parameters in the rats exposed to light-induced stress and fed on a high-calorie diet (HCD).
Materials & methods
Animals and experimental design
The practice of use and handling of animals in this study had been approved by the Monash University School of Biomedical Sciences Animal Ethics Committee (AEC Approval Number: MARP/2012/043) according to the 2004 Australian Code of Practice for the Care and Use of Animals for Scientific Purposes and Monash University Animal Welfare Committee Guidelines and Policies (Prevention of Cruelty to Animals Act 1986). Forty-eight male Sprague Dawley rats (Rattus norvegicus) with initial wei-ghts between 160 to 200 g and ages approximately 9-11 weeks old were obtained from the animal breeding facility of Monash University Malaysia. The rats were housed individually in plastic cages of approximately 35 x 25 x 20 cm which contained shredded paper for bedding.
The rats were randomly assigned equally into two major experimental groups: the 14-day exposure group and the 28-day exposure group. Each of these groups were further subdivided equally into three groups: a control group without a stressor, in which rats were fed on a high-calorie diet (Group HCD), the high- calorie diet + constant light exposure group (Group HCDS) and the high-calorie diet + constant light exposure + GA group (Group HCDST) (Figure 1). The high-calorie diet fed to all groups was composed of 30% ghee, 30% cane sugar and 40% standard rat chow (Gold Coin, Malaysia). The stressor, continuous light intensity for 14 days or 28 days, was of an intensity between 300 and 400 lux. GA meanwhile was administered orally via water at a concentration of 100 mg per kg of average body weight per day. Body weight, food and water intake were measured daily. Food and water were given ad libitum throughout the experiment.
Figure 1.
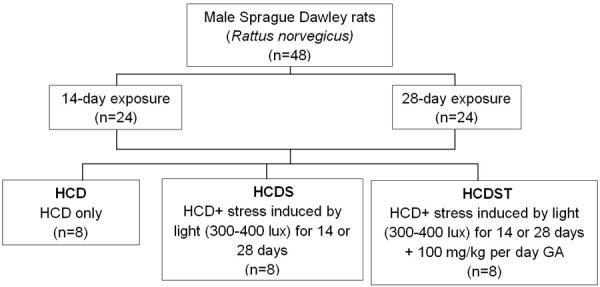
Segregation of animals into different treatment groups (HCD: rats fed on a high-calorie diet (HCD); HCDS: rats fed on a HCD and exposed to stress induced by light; HCDST: rats fed on a HCD and exposed to stress induced by light treated with glycyrrhizic acid).
Blood and tissue collection
Prior to sample collection, the rats were fasted for approximately 12 hours. Ketamine (75 mg/kg body weight) and xylazine (10 mg/kg body weight) were administered to each rat via intraperitoneal injection. Blood was drawn from the apex of the cardiac ventricle using 5 mL syringes and 22 G needles for each rat. One ml of blood from each rat was added to blood collection tubes (BD Vacutainer Blood Collection Tubes). The remaining blood was collected in sterile tubes and allowed to clot at room temperature (25°C). The blood was then centrifuged at 1500 xg for 15 minutes. The supernatant (serum) was aliquoted into microcentrifuge tubes and stored at -70°C until required for analysis. Liver, kidney, subcutaneous adipose tissue (SAT) (SAT) and visceral adipose tissue (VAT), abdominal muscle (AM) and quadriceps femoris (QF) were collected for gluconeogenic enzymes activities determination. The heart, together with the above six types of tissues were also collected into microcentrifuge tubes and flash frozen with liquid nitrogen and stored at -70°C until required for RNA extraction.
Blood and serum biochemical analysis
Blood glucose concentration was determined using Trinder’s glucose oxidase method; whereas serum insulin concentrations were determined using Rat/Mouse Insulin ELISA kit (Millipore, USA). The Homeostatic Model Assessment of Insulin Resistance (HOMA-IR) value of each sample was determined by dividing the product of its blood glucose and serum insulin concentration by 22.5 [26]. Serum adrenaline concentrations were determined using a rat epinephrine/adrenaline (EPI) ELISA kit (Cusabio, China); while the serum corticosterone concentrations were determined using a corticosterone enzyme immunoassay (EIA) kit (Cayman’s Chemical Company, USA). Blood glucose concentration, serum insulin, HOMA-IR and serum adrenaline for long-term stress (28-day exposure) group were obtained from [23] as comparison to the short-term stress group in the present study.
Gluconeogenic enzymes determination
PEPCK (phosphoenolpyruvatecarboxykinase)
PEPCK assays were done based on a protocol [27] with minor modifications. The cytosolic fractions from the liver, kidney, SAT and VAT were added into a 96-well microtiter plate containing a reaction mixture (50 mM Tris-HCl (pH 7.4), 50 mM NaHCO3, 1 mM MnCl2, 1 mM phosphoenolpyruvate, 2 U malate dehydrogenase and 0.25 mM nicotinamide adenine dinucleotide (reduced) (NADH). The plate was then incubated at 30°C for three minutes. Addition of 0.15 mM 2’-deoxyguanosine 5’-diphosphate (dGDP) initiated the reaction of PEPCK and malate dehydrogenase. The absorbance of NADH produced was measured at 340 nm at one-minute intervals for five minutes. One unit of PEPCK activity is equal to one nanomole of NADH oxidized/min per mg protein.
G6Pase (Glucose-6-phosphatase)
The G6Pase activities in the liver and kidney were investigated using the protocol [28] which is based on the amount of inorganic phosphate formed. The microsomal membranes were permeabilized by adding alamethicin from Trichodermaviridae (0.1 mg/mg protein). The permeabilized samples were added into a 96-well microtiter plate. MOPS-KCl buffer (15 μL) containing 5 mM G6P was added into the wells. The plate was then incubated at 37°C for two minutes prior to the addition of stopping reagent containing 3.4 mM ammonium molybdate in 0.5 M sulphuric acid, 0.52 M sodium dodecyl sulphate (SDS) and 0.6 M ascorbic acid in a 6:2:1 ratio. This was followed by incubation at 45°C for 20 minutes to maximize the color development, and the absorbance was measured at 820 nm at every one-minute interval for five minutes. One unit of G6Pase activity equals to one nanomole of phosphate formed/min per mg protein.
H6PDH (Hexose-6-phosphate dehydrogenase)
Determination of H6PDH activities in the liver, kidney, SAT, VAT, AM and QF was conducted according to the protocol [29]. The microsomes of all samples were permeabilized using 10% Triton X-100 and incubated at 22°C for three minutes. A total of 160 μl of the samples were loaded into a 96-microtiter plate. The reaction mixture containing 100 μM NADP+ and 10 μM glucose-6-phosphate (G6P) was then added to the wells. The plate was read at 340 nm at one-minute interval for five minutes. One unit of H6PDH activity equals to one nanomole of NADPH formed/min per mg protein.
Statistical analysis
All data were analysed using Statistical Package for the Social Sciences (SPSS) Version 20.0. Data distribution was analysed using Shapiro-Wilk test. Data with parametric distribution were analysed using one-way analysis of variance (ANOVA) while data with non-parametric distribution were analysed using Kruskal-Wallis test. Results for all analyses were considered statistically significant when the p value was equal to or less than 0.05 (P ≤ 0.05).
Results
GA decreased the elevated blood glucose concentration caused by short-term but not long-term stress
Exposure to stress induced by light for 14 days increased the blood glucose concentration significantly from 6.82 ± 0.51 mmol/L (Group HCD) to 13.14 ± 1.65 mmol/L (Group HCDS) (P < 0.05) (Figure 2). Oral administration of GA lowered the elevated blood glucose concentration caused by stress as shown by the lower blood glucose concentrations of HCDST rats (7.59 ± 0.60 mmol/L) which was 42% lower compared to HCDS rats (P < 0.05). However, the effects of stress and GA were not seen in the 28-day exposure group. The mean blood glucose concentrations in all groups with 28-day exposure did not show any significant difference with Group HCDS had the highest blood glucose concentration (8.61 ± 1.24 mmol/L) followed by Groups HCDST (7.60 ± 0.58 mmol/L) and HCD (6.29 ± 0.59 mmol/L) (P > 0.05) [23]. There was no difference for blood glucose concentration between 14- and 28-day exposure groups. For rats exposed to stress (Group HCDS), the 28-day exposure group had significantly lower mean blood glucose concentration than the 14-day exposure group (P < 0.01) whereas there was no difference for between these two groups in Group HCD and HCDST.
Figure 2.
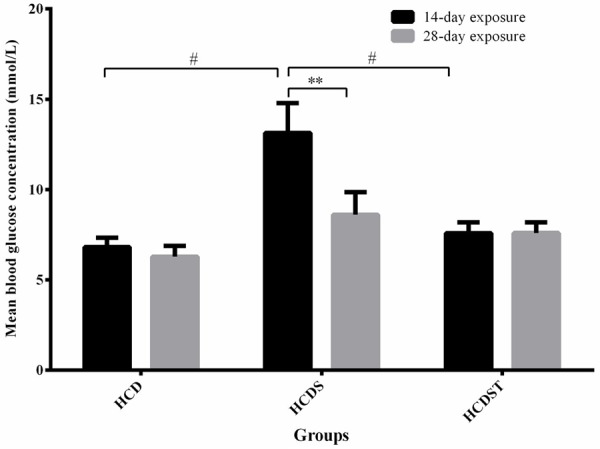
Mean blood glucose concentrations (mmol/L) of rats in Groups HCD, HCDS and HCDST (Mean ± 1 SE, n=8) (**: P < 0.01 for comparisons between groups of 14- or 28-day exposure and #: P < 0.05 for comparisons within groups of 14- or 28-day exposure) (GA - Glycyrrhizic acid; HCD - High-calorie diet; HCDS - HCD + stress; HCDST - HCD + stress + 100 mg/kg GA).
Stress and GA did not affect serum insulin level and insulin sensitivity
Prolonged exposure to stress increased the serum insulin concentrationas shown by the higher insulin concentration of the 28-day exposure group compared to the group in Groups HCDS and HCDST (Figure 3). The serum insulin concentrations of all groups within the 14- or 28-day exposure did not differ significantly (Figure 3). For the 14-day exposure group, the lowest serum insulin concentration was observed in Group HCDS (5.57 ± 0.51 μU/ml) followed by Group HCDST (5.80 ± 0.30 μU/ml) while the highest was seen in Group HCD (6.11 ± 0.67 μU/ml). As for the 28-day exposure group, the insulin concentrations of Groups HCD and HCDS were 8.00 ± 0.31 μU/ml and 8.13 ± 0.33 μU/ml respectively, whereas Group HCDST had the lowest concentration, 7.73 ± 0.25 μU/ml [23].
Figure 3.
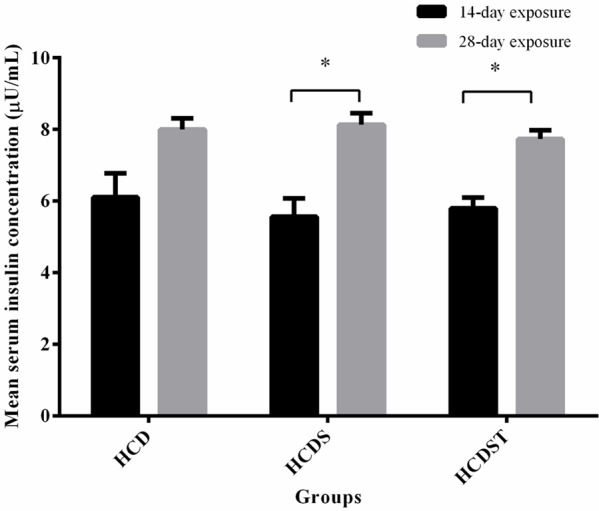
Mean serum insulin concentrations (μU/mL) of rats in Groups HCD, HCDS and HCDST (Mean ± 1 SE, n=8) (*: P < 0.05 for comparisons between groups of 14- or 28-day exposure) (GA - Glycyrrhizic acid; HCD - High-calorie diet; HCDS - HCD + stress; HCDST - HCD + stress + 100 mg/kg GA).
The insulin sensitivities across all groups within the 14- or 28-day exposure were not different from one another (Figure 4). The HOMA-IR indices from both studies showed a similar trend where Group HCD had the lowest index followed by Groups HCDST and HCDS. The HOMA-IR indices of rats within the 14-day exposure of Groups HCD, HCDS and HCDST were 1.91 ± 0.35, 2.73 ± 0.23 and 2.01 ± 0.20 respectively, while that of the rats with 28-day exposure of Groups HCD, HCDS and HCDST were 2.57 ± 0.23, 2.67 ± 0.13 and 2.60 ± 0.15 respectively [23].
Figure 4.
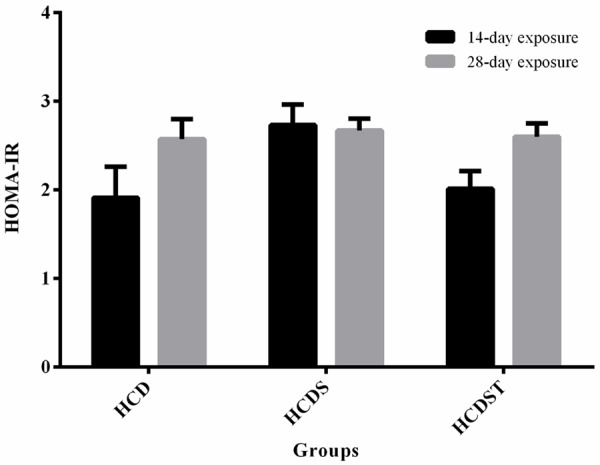
Mean HOMA-IR index of rats in Groups HCD, HCDS and HCDST (Mean ± 1 SE, n=8) (GA - Glycyrrhizic acid; HCD - High-calorie diet; HCDS - HCD + stress; HCDST - HCD + stress + 100 mg/kg GA).
GA elevated serum adrenaline in rats exposed to short-term but not long-term stress
Serum adrenaline was significantly lower across all groups with long-term light exposure compared to the short-term counterparts (P < 0.05) (Figure 5). This may indicate that the 28-day exposure group has adapted to the stress induced by light. Within 14-day exposure, stress did not increase serum adrenaline level significantly. The mean serum adrenaline concentrations from Groups HCD and HCDS were 52.37 ± 12.66 pg/mL and 54.14 ± 6.91 pg/mL respectively. GA increased the serum adrenaline concentrationof Group HCDST to 99.34 ± 12.40 pg/mL (P < 0.05). In contrast, the serum adrenaline concentrations of rats for the 28-day exposure were similar across all groups with values of 18.11 ± 4.27 pg/mL, 18.52 ± 2.40 pg/mL and 15.46 ± 1.00 pg/mL for Groups HCD, HCDS and HCDST respectively [23].
Figure 5.
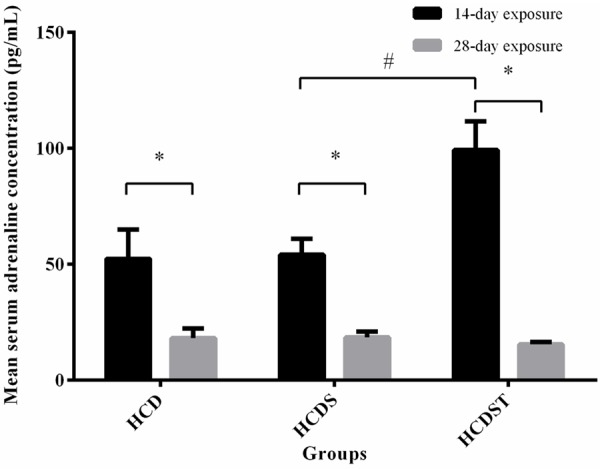
Mean serum adrenaline concentrations (pg/mL) of rats in Groups HCD, HCDS and HCDST (Mean ± 1 SE, n=8) (*: P < 0.05 for comparisons between groups of 14- or 28-day exposure; #: P < 0.05 for comparisons within groups of 14- or 28-day exposure) (GA - Glycyrrhizic acid; HCD - High-calorie diet; HCDS - HCD + stress; HCDST - HCD + stress + 100 mg/kg GA).
GA lowered serum corticosterone in rats exposed to long-term but not short-term stress
There was no difference in corticosterone concentrations between the 14- and 28-day exposure in the Groups HCD and HCDS. However, Group HCDST in the 28-day exposure had significantly lower serum corticosterone than the 14-day exposure group (P < 0.05). The corticosterone concentration was not significantly affected by both the exposure to light and GA administration for 14 days. Group HCD had the lowest corticosterone concentration (260.56 ± 20.25 ng/mL) followed by Group HCDST (262.37 ± 14.67 ng/mL) (Figure 6). Although insignificant, Group HCDS showed the highest corticosterone concentration (281.58 ± 19.81 ng/mL). For the 28-day exposure group, although stress did not elevate the serum corticosterone concentration, Group HCDST had significantly lower serum corticosterone concentration than Group HCDS with values of 152.05 ± 25.85 ng/mL and 356.94 ± 78.91 ng/mL respectively. The serum corticosterone concentration in Group HCD was 253.51 ± 52.93 ng/mL.
Figure 6.
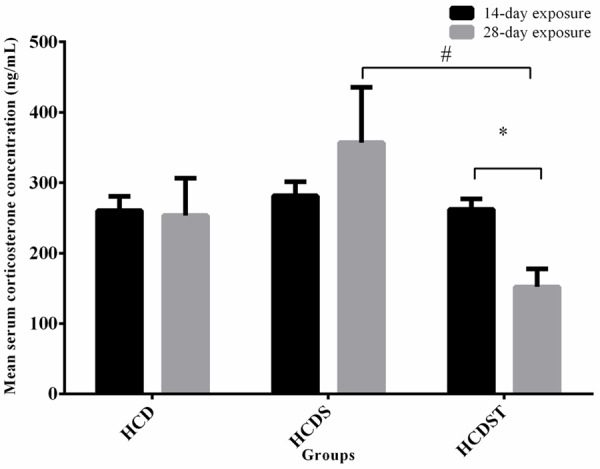
Mean serum corticosterone concentrations (pg/mL) of rats in Groups HCD, HCDS and HCDST (Mean ± 1 SE, n=8) (*: P < 0.05 for comparisons between groups of 14- or 28-day exposure; #: P < 0.05 for comparisons within groups of 14- or 28-day exposure) (GA - Glycyrrhizic acid; HCD - High-calorie diet; HCDS - HCD + stress; HCDST - HCD + stress + 100 mg/kg GA).
Short-term stress elevated PEPCK activities in the kidney and VAT but GA had no effect on PEPCK activities
The mean hepatic PEPCK activities of the 28-day exposure group was significantly lower than the 14-day exposure group across all groups (P < 0.01) (Figure 7). For the 14-day exposure group, the activities in Groups HCD, HCDS and HCDST were 4.09 ± 0.29, 4.49 ± 0.22 and 3.80 ± 0.23 units respectively while the values for the 28-day exposure group were 1.81 ± 0.18, 2.20 ± 0.03 and 2.10 ± 0.04 units respectively. However, no difference was found across all groups within the 14- and 28-day exposure groups.
Figure 7.
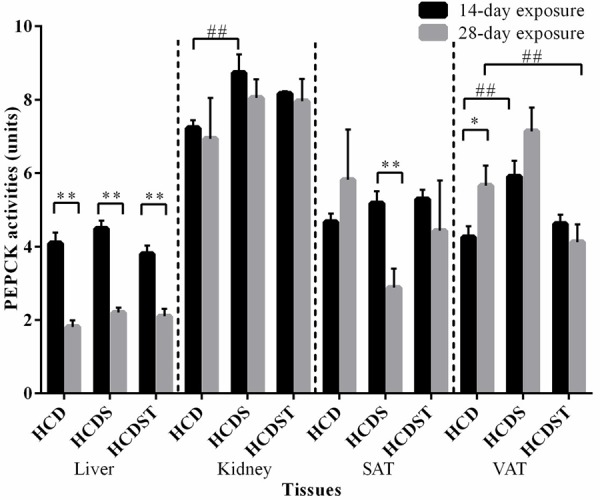
Mean PEPCK activities in the liver, kidney, SAT and VAT of rats in Groups HCD, HCDS and HCDST (Mean ± 1 SE, n=8) (* & ** indicates P < 0.05 and P < 0.01 respectively for comparisons between groups of 14- or 28-day exposure; ##: P < 0.01 for comparisons within groups of 14- or 28-day exposure) (GA - Glycyrrhizic acid; HCD - High-calorie diet; HCDS - HCD + stress; HCDST - HCD + stress + 100 mg/kg GA; SAT - subcutaneous adipose tissue, VAT - visceral adipose tissue; PEPCK - phosphoenolpyruvate carboxykinase).
With regards to the 14-day exposure group, the renal PEPCK activities for Groups HCD, HCDS and HCDST were 7.26 ± 0.19, 8.79 ± 0.45 and 8.00 ± 0.17 units respectively (Figure 7) while that for the 28-day exposure recorded values of 6.94 ± 1.11, 8.05 ± 0.09 and 7.96 ± 0.10 units respectively. For the 14-day exposure group, HCDS rats had significantly higher PEPCK activities than HCD rats (P < 0.01) while no difference was found when comparisons were made between Groups HCDS and HCDST and Groups HCD and HCDST. No difference was found in the activities across all treatment groups within the 28-day exposure group.
HCD and HCDS rats exposed to 28-day light had significantly higher PEPCK activities than the 14-day exposure group in the SAT (P < 0.01) and VAT (P < 0.05) respectively. In the SAT, the activities were 4.69 ± 0.20, 5.23 ± 0.28 and 5.74 ± 0.48 units respectively for the 14-day exposure group while that for the 28-day exposure group were 5.82 ± 1.37, 2.88 ± 0.07 and 4.43 ± 0.11 units respectively. Within the 14-day exposure group, HCDS had significantly higher PEPCK activities compared to HCD in the VAT (P < 0.05) but not in the SAT (P > 0.05). However, no difference was observed between Groups HCDS and HCDST and Groups HCD and HCDST in both SAT and VAT (P > 0.05). In the VAT, the activities for Groups HCD, HCDS and HCDST were 4.26 ± 0.29, 5.91 ± 0.42 and 4.61 ± 0.28 units respectively (for the 14-day exposure group) while that for Groups HCD, HCDS and HCDST were 5.66 ± 0.55, 7.14 ± 0.04 and 4.12 ± 0.05 units respectively (for the 28-day exposure group). Within the 14-day exposure group, the VAT of rats had significantly higher PEPCK activities than the controls (P < 0.01). While within the 28-day exposure group, the activities of HCDST were significantly lower than HCD (P < 0.01). However, no difference was observed when comparisons were made between Groups HCD and HCDS and Groups HCDS and HCDST (P > 0.05).
GA did not affect glucose-6-phosphatase (G6Pase) activities
In the liver, the mean G6Pase activities of the 28-day exposure group were significantly lower than the 14-day exposure group across all treatment groups (Figure 8) with the values of Groups HCD, HCDS and HCDST being 120.95 ± 1.21, 132.30 ± 2.66 and 126.84 ± 1.82 units respectively (for the 14-day exposure group) and 78.57 ± 9.05, 94.16 ± 12.45 and 90.27 ± 6.85 units respectively (for the 28-day exposure group) (P < 0.05) (Figure 9). Within the 14-day exposure group, Group HCDS had significantly higher activities than Group HCD (P < 0.01) while there was no difference between Groups HCDS and HCDST and Groups HCD and HCDST. No difference was seen across all groups within the 28-day light exposure.
Figure 8.
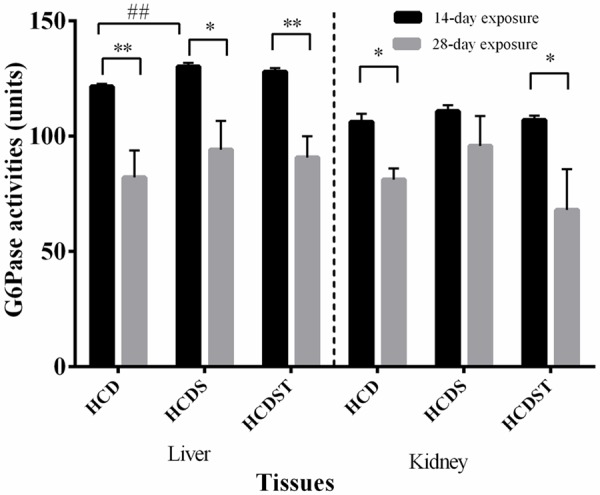
Mean G6Pase activities in the liver, and kidney of rats in Groups HCD, HCDS and HCDST (Mean ± 1 SE, n=8) (* & ** indicates P < 0.05 and P < 0.01 respectively for comparisons between groups of 14- or 28-day exposure; ##: P < 0.01 for comparisons within groups of 14- or 28-day exposure) (GA - Glycyrrhizic acid; HCD - High-calorie diet; HCDS - HCD + stress; HCDST - HCD + stress + 100 mg/kg GA; G6Pase - glucose-6-phosphatase).
Figure 9.
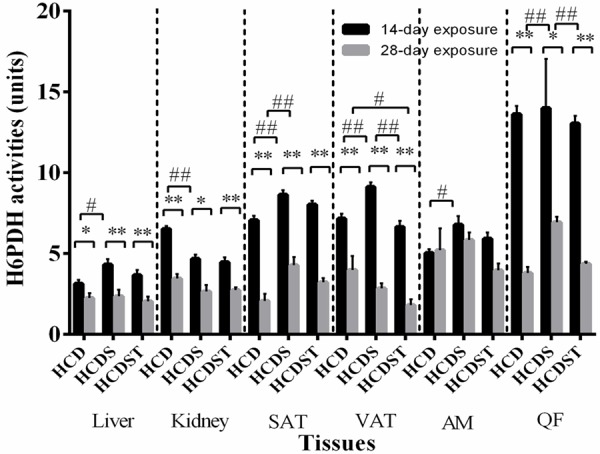
Mean H6PDH activities in the liver, kidney, SAT, VAT, AM and QF of rats in Groups HCD, HCDS and HCDST (Mean ± 1 SE, n=8) (* & ** indicate P < 0.05 and P < 0.01 respectively for comparisons between groups of 14- or 28-day exposure; # & ## indicate P < 0.05 and P < 0.01 respectively for comparisons within groups of 14- or 28-day exposure) (GA - Glycyrrhizic acid; HCD - High-calorie diet; HCDS - HCD + stress; HCDST - HCD + stress + 100 mg/kg GA; SAT - subcutaneous adipose tissue; VAT - visceral adipose tissue; AM - abdominal muscle and QF - quadriceps femoris; H6PDH - hexose-6-phosphate dehydrogenase).
In the kidneys, the mean G6Pase activities of Groups HCD, HCDS and HCDST were 106.34 ± 3.03, 112.08 ± 2.61 and 105.81 ± 2.03 units respectively (for the 14-day exposure group) while for the 28-day exposure group, Groups HCD, HCDS and HCDST had activities of 81.83 ± 11.19, 96.68 ± 9.67 and 73.68 ± 14.08 units respectively. Only Groups HCD and HCDST showed significant difference when comparisons were made between the 14- and 28-day exposure groups (P < 0.05). No difference was observed across all groups within the 14- and 28-day exposure groups (P > 0.05).
GA lowered hexose-6-phosphate dehydrogenase (H6PDH) activities in the VAT of the short-term exposure group
The mean hepatic and renal H6PDH activities of rats exposed to 28 days of light were significantly lower than the 14-day exposure group across all treatment groups (P < 0.05) (Figure 9). In the 14-day exposure group, H6PDH activities in the liver of Groups HCD, HCDS and HCDST were 3.13 ± 0.23, 4.32 ± 0.34 and 3.65 ± 0.32 units respectively while in the kidney, the values were 6.51 ± 0.19, 4.67 ± 0.25 and 4.47 ± 0.29 units respectively (Figure 9). In the 28-day exposure group, the mean hepatic H6PDH activities in Groups HCD, HCDS and HCDST were 2.20 ± 0.26, 2.95 ± 0.70 and 2.13 ± 0.28 units respectively while in the kidney, the values were 3.30 ± 0.28, 3.12 ± 0.15 and 2.72 ± 0.15 units respectively (Figure 9). The mean hepatic activities of rats exposed to 28 days of light were significantly lower than the 14-day exposure group across all treatment groups (P < 0.05). When comparisons were made between groups within the 14-day exposure, rats exposed to continuous light illumination (Group HCDS) had significantly higher hepatic and renal G6Pase activities than Group HCD (P < 0.05) while no difference was found when comparisons were made between Groups HCDS and HCDST and Groups HCD and HCDST. No difference was found between groups within the 28-day exposure group.
With regards to both the SAT and VAT, the H6PDH activities of the 28-day exposure groups were significantly lower than the 14-day exposure groups across all groups (P < 0.01). In the 14-day exposure group, SAT of Groups HCD, HCDS and HCDST had activities of 7.06 ± 0.28, 8.64 ± 0.28 and 8.02 ± 0.25 units respectively, while the activities from the 28-day exposure group were 2.65 ± 0.58, 4.07 ± 0.43 and 3.19 ± 0.20 units respectively for all three groups from the SAT. The VAT of the 14-day exposure group recorded activities of 7.16 ± 0.30, 9.12 ± 0.28 and 6.64 ± 0.38 units respectively within the group while the 28-day exposure group, the values were 3.83 ± 0.66, 3.29 ± 0.64 and 1.81 ± 0.77 units respectively. In the SAT, for both the 14- and 28-day exposure groups, rats exposed to light for 14 or 28 days (Group B) without given GA had significantly higher H6PDH activities than the controls (Group HCD) (P < 0.01) while no difference was found between Groups B and C and Groups A and C. The mean H6PDH activities in the VAT of rats exposed to 14 days light was significantly higher than the controls while the HCDST rats had significantly lower H6PDH activities than the stressed rats without given GA. However, the similar trend was not observed in the 28-day exposure group.
In the AM, no difference was observed for the mean activities between the 14- and 28-day exposure groups. The activities for Groups HCD, HCDS and HCDST were 5.03 ± 0.24, 6.79 ± 0.52 and 5.91 ± 0.38 units respectively for the 14-day exposure group while that from the 28-day exposure group recorded activities of 5.01 ± 0.86, 5.92 ± 0.38 and 4.76 ± 0.56 units respectively. No difference was found between groups within the 28-day exposure group. However, the AM of rats exposed to 14 days of light exhibited significantly higher H6PDH activities than the controls while there was no difference between Groups HCDS and HCDST and Groups HCD and HCDST. The QF of the rats from the 28-day exposure group showed significantly higher activities than the 14-day exposure group (P < 0.05). The activities for Groups HCD, HCDS and HCDST were 13.61 ± 0.51, 13.99 ± 0.54 and 13.04 ± 0.48 units respectively while that from the 28-day exposure group demonstrated activities of 4.72 ± 0.52, 7.18 ± 0.37 and 4.66 ± 0.45 units respectively (P < 0.05). No difference was found between groups within the 14-day exposure group while the QF of the rats exposed to 28-day exposure exhibited significantly higher H6PDH activities than the controls (P < 0.01) and GA was found to lower the H6PDH activities significantly (P < 0.01).
Discussion
GA has been shown to exert blood glucose lowering effects in rats fed on a high-sucrose or high-fat diet [19,21]. Individuals exposed to stress have higher tendency to develop MetS [4]. In the present study, rats were fed on a high-calorie diet (composed of 30% sucrose and 30% animal fats) and exposed to constant light illumination as the source of stress for either two or four weeks. The significantly lower serum adrenaline of the rats with long-term light exposure as compared to the short-term stressed group (Figure 5) may be related to the development of adaptive mechanisms towards stress over time. This contributed to the insignificant difference in blood glucose level of the long-term stress group compared to the short-term stressed group. This could also be related to the significantly lower gluconeogenic enzymes in most of the tissues of rats from the long-term exposure group (Figures 7, 8 and 9). Studies have shown that adaptation takes place when rats were exposed to repeated low to moderate-intensity stressors [30,31]. However, a similar trend was not observed for serum corticosterone which is another stress indicator. This may be related to adrenaline (an indicator of acute stress response) [32] with shorter half-life, t1/2=2 min compared to corticosterone (the indicator of chronic stress response) with t1/2 of 6090 min [33].
Continuous short-term light exposure was fo-und to induce the stress response and increase blood glucose level significantly in the rats. Activation of the sympatho-medullary system has been shown to inhibit insulin release [34] which explains the lower serum insulin with higher serum adrenaline level as seen in the rats with 14-day exposure as compared to those with 28-day exposure. Gradual withdrawal of stress from day 14 to 28 as indicated by the lower serum adrenaline level may contribute to an increase in serum insulin (Figure 3). The elevated insulin levels prevent further increase in blood glucose levels as seen from day 14 to 28 thus contributing to the insignificant difference in HOMA-IR.
The significantly higher blood glucose levels of HCDS than HCD in the 14-day exposure group could be related to the significantly higher gluconeogenic enzymes in the related tissues. Stress significantly increased the activities of the rate-limiting gluconeogenic enzyme, PEPCK in the kidney and VAT while G6Pase activities were increased in both the liver and kidney of the rats with 14-day exposure. GCs affect PEPCK gene expression in the kidney and VAT differently. Contrary to the GC-induced up-regulation of PEPCK activities in the kidney, GC interacts with negative regulatory elements in the adipose tissues and repress PEPCK gene transcription [35]. However, the PEPCK activities in the VAT were found to have increased. This might be due to the significantly lower GC level which was insufficient to suppress the PEPCK gene transcription and hence brought about the observed higher activities of PEPCK. [36] showed that endoplasmic reticulum (ER) stress (which normally occurs in obesity or diabetes) increased G6Pase gene expression and activities in rat hepatocytes. This event then leads to elevated hepatic glucose release and cycling. Therefore, GCs are not the sole marker for the level of gluconeogenesis.
HCD also affects glucose metabolism via the pentose phosphate pathway. Accumulation of glucose-6-phosphate (G6P) such as that from high-carbohydrate diet fuels the G6Pase/H6PDH/11b-HSD1 triad, which stimulates pre-receptorial GC activation [15]. After the 14-day exposure period, there was an increase in H6PDH activities in the liver, SAT, VAT and AM in the HCDS group. Significant increase in the blood glucose level suggested increased G6P availability for H6PDH activities. On the other hand, stress lowered H6PDH activities in the kidney.
GA was found to lower blood glucose significantly in the stressed rats from the 14-day exposure group, which could be related to the non-selective inhibitory effects of GA on 11β-HSD. This can be further supported by the reduced H6PDH activities particularly in the important organs: liver and VAT. H6PDH is an enzyme closely related to 11β-HSD1 and has been recognized as the major enzyme capable of reducing NADP+ in the endoplasmic reticulum lumen to supply NADPH, a co-factor essential for 11β-HSD1 activities. Inhibition of 11β-HSD1 reduces generation of cofactor NADP+ thus reducing the H6PDH activities [14]. Furthermore, HCDST rats had significantly lower circulating blood glucose levels which lead to decreased glucose-6-phosphate production, which is another important substrate for H6PDH. Studies from our laboratory showed significant blood-glucose lowering effects of GA in rats fed on either a high-fat or high-sucrose diet which can be related to the non-selective inhibitory effects of GA on 11β-HSD [19,21]. Inhibition of 11β-HSD1 was found to reduce blood glucose level by promoting translocation of GLUT4 to the cell membrane [37], hence increasing blood glucose uptake and facilitating removal of glucose from the circulation. The significantly reduced blood glucose in the HCDST compared to HCDS indicated that the therapeutic effect of GA was sufficient to improve blood glucose level even in the presence of both HCD and stress.
However, HCDST rats had significantly higher serum adrenaline levels relative to both the controls and the stressed rats with 14-day exposure. This may be due to the antidepressant effect of GA, which occurs by inhibiting the breakdown of monoamines such as dopamine, adrenaline and noradrenaline [38]. Furthermore, while the inhibition of 11β-HSD1 by GA represses increases in blood glucose level, inhibition of 11β-HSD2 reduces the inactivation of GC resulting in a high level of GC binding to the brain mineralocorticoids receptors [39]. Intracerebroventricular injection of GA was found to increase arterial blood pressure, heart rate and renal sympathetic nerve activity which indicate activation of the SNS [40]. In this context, GA may be able to mediate SNS activation as well as increase adrenaline secretion via the inhibition of 11β-HSD2.
Similar GA-mediated blood glucose-lowering effects were not observed in the 28-day group. No difference was observed for the blood glucose level in the HCDST. By referring to the significant difference in serum adrenaline level between the 14-day and 28-day exposure groups, the additive effects of stress and diet-induced abnormalities could have induced significant effects in the blood glucose metabolism in rats before adaptation took place. Therefore, there was insufficient time for GA to improve parameters beyond that of the controls hence causing the observed indifference in the parameters of the blood glucose metabolism at the end of the treatment period. However, GA was found to reduce corticosterone significantly in the HCDST of the 28-day exposure group and when comparing between the 14-day and 28-day exposure rats, rats from the latter group had significantly lower serum corticosterone. This could be due to the role of GA in reducing serum corticosterone. GA reduces 11β-HSD1 activities and leads to reduced activation of GC, contributing to the lower corticosterone observed in the HCDST from the 28-day exposure group. The reduced corticosterone level then further reduces the PEPCK, an important gluconeogenic enzyme found selectively in the VAT which is an important target associated with the development of MetS. This reduces glyceroneogenesis (formation of TAG from FFA) in the VAT thus preventing the enlargement of the VAT and hence the development of visceral obesity. The reduced 11β-HSD1 level also reduces the availability of NADP+ which further contributes to the lower H6PDH activities in the VAT.
GA was found to reduce H6PDH activities consistently in the VAT of both groups of rats subjected to short- or long-term stress while lowering of PEPCK activities were specifically found in the VAT of the latter group. Mutual interaction of 11β-HSD1 and H6PDH exacerbates glucose metabolism impairment due to the increased level of active GC which then enhances gluconeogenesis. Since accumulation of fats in the visceral region is the primary cause of MetS, it is beneficial that the direct inhibitory effect of GA on 11β-HSD1, which further reduces H6PDH, will improve glucose levels.
Conclusion
Our study has shown that short-term stress could induce hyperglycaemia. However, the lack of any effect of long-term stress on most of the parameters may be related to the development of adaptive mechanisms towards stress. GA increased the adrenaline level of the short-term stressed group while lowering the corticosterone level of the long-term stressed group. GA was found to lower blood glucose levels effectively in the short-term stress group via inhibition of H6PDH activties while persistent inhibition of PEPCK selectively in the visceral adipose tissues in the long-term stress group may suggest a potential role of GA in preventing the development of visceral obesity, which is the hallmark of MetS.
Acknowledgements
This work was partly funded by a grant from the Ministry of Science, Technology and Innovation (MOSTI) [02-02-10-SF0249].
Disclosure of conflict of interest
None.
References
- 1.Chrousos GP. Stress and disorders of the stress system. Endocrinology. 2009;5:374–381. doi: 10.1038/nrendo.2009.106. [DOI] [PubMed] [Google Scholar]
- 2.Reeves GM, Postolache TT, Snitker S. Childhood Obesity and Depression: Connection between these Growing Problems in Growing Children. Int J Child Health Hum Dev. 2008;1:103–114. [PMC free article] [PubMed] [Google Scholar]
- 3.Dallman M, Pecoraro N, Akana S, La Fleur S, Gomez F, Houshyar H, Bell M, bhatnagar S, Laugero K, Manalo S. Chronic stress and obesity: A new view of “comfort food”. Proc Natl Acad Sci U S A. 2003;100:11696–11701. doi: 10.1073/pnas.1934666100. [DOI] [PMC free article] [PubMed] [Google Scholar]
- 4.Chandola T, Brunner E, Marmot M. Chronic stress at work and the metabolic syndrome: prospective study. BMJ. 2006;332:521–525. doi: 10.1136/bmj.38693.435301.80. [DOI] [PMC free article] [PubMed] [Google Scholar]
- 5.Seematter G, Binnert C, Tappy L. Stress and metabolism. Metab Syndr Relat Disord. 2005;3:8–13. doi: 10.1089/met.2005.3.8. [DOI] [PubMed] [Google Scholar]
- 6.Wideman CH, Murphy HM. Constant light induces alterations in melatonin levels, food intake, feed efficiency, visceral adiposity, and circadian rhythms in rats. Nutr Neurosci. 2009;12:233–240. doi: 10.1179/147683009X423436. [DOI] [PubMed] [Google Scholar]
- 7.Castelhano-Carlos M, Baumanas V. The impact of light, noise, cage cleaning and in-house transport on welfare and stress of laboratory rats. Lab Anim. 2009;43:311–327. doi: 10.1258/la.2009.0080098. [DOI] [PubMed] [Google Scholar]
- 8.Schlingmann F, De Rijk H, Prebppm W, Rernie R. Avoidance of a behavioural parameter in the determination of distress amongst albino and pigmented rats at various light intensities. Animal Technology. 1993;44:87–96. [Google Scholar]
- 9.Matsuo M, Tsuji K. Strain difference of the light-dark preference in inbred rats. Behav Genet. 1989;19:457–466. doi: 10.1007/BF01066171. [DOI] [PubMed] [Google Scholar]
- 10.Elliot W, Elliot D. Biochemistry and Molecular Biology. New York: Oxford University Press; 2009. [Google Scholar]
- 11.Crunkhorn S, Patti M. Links between thyroid hormone action, oxidative metabolism, and diabetes risk? Thyroid. 2008;18:227–237. doi: 10.1089/thy.2007.0249. [DOI] [PubMed] [Google Scholar]
- 12.Van Schaftingen E, Gerin I. The glucose-6-phosphatase system. Biochem J. 2002;362:513–532. doi: 10.1042/0264-6021:3620513. [DOI] [PMC free article] [PubMed] [Google Scholar]
- 13.Clarke J, Mason P. Murine hexose-6-phosphatedehydrogenase: a bifunctional enzyme with broad substrate specificity and 6-phosphogluconolactonase activity. Arch Biochem Biophys. 2003;415:229–234. doi: 10.1016/s0003-9861(03)00229-7. [DOI] [PubMed] [Google Scholar]
- 14.Hewitt K, Walker E, Stewart P. Minireview: hexose-6-phosphate dehydrogenase and redox control of 11beta-hydroxysteroid dehydrogenase type 1 activity. Endocrinology. 2005:2539–2543. doi: 10.1210/en.2005-0117. [DOI] [PubMed] [Google Scholar]
- 15.Banhegyi G, Csala M, Benedetti A. Hexose-6-phosphate dehydrogenase: linking endocrinology and metabolism in the endoplasmic reticulum. J Mol Endocrinol. 2009;42:283–289. doi: 10.1677/JME-08-0156. [DOI] [PubMed] [Google Scholar]
- 16.Bujalska I, Gathercole L, Tomlinson J, Darimont C, Ermolieff J, Fanjul A, Rejto P, Stewart P. A novel selective 11beta-hydroxysteroid dehydrogenase type 1 inhibitor prevents adipogenesis. J Endocrinol. 2008;197:297–307. doi: 10.1677/JOE-08-0050. [DOI] [PMC free article] [PubMed] [Google Scholar]
- 17.Isbrucker RA, Burdock GA. Risk and safety assessment on the consumption of Licorice root (Glycyrrhiza sp. ), its extract and powder as a food ingredient, with emphasis on the pharmacology and toxicology of glycyrrhizin. Regul Toxicol Pharmacol. 2006;46:167–192. doi: 10.1016/j.yrtph.2006.06.002. [DOI] [PubMed] [Google Scholar]
- 18.Yin Y, Ton S, Kadir K. Effects of Glycyrrhizic acid on 11β-Hydroxysteroid Dehydrogenase (11βHSD1 and 2) Activities and HOMA-IR in Rats at Different Treatment Periods. Exp Clin Endocrinol Diabetes. 2009;118:617–24. doi: 10.1055/s-0029-1237703. [DOI] [PubMed] [Google Scholar]
- 19.Lim WY, Chia YY, Liong SY, Ton SH, Kadir KA, Husain SN. Lipoprotein lipase expression, serum lipid and tissue lipid deposition in orally-administered glycyrrhizic acid-treated rats. Lipids Health Dis. 2009;8:31–40. doi: 10.1186/1476-511X-8-31. [DOI] [PMC free article] [PubMed] [Google Scholar]
- 20.Eu C, WYA L, Ton S, Khalid B. Glycyrrhizic acid improved lipoprotein lipase expression, insulin sensitivity, serum lipid and lipid deposition in high-fat diet-induced obese rats. Lipids Health Dis. 2010;9:81–89. doi: 10.1186/1476-511X-9-81. [DOI] [PMC free article] [PubMed] [Google Scholar]
- 21.Chandramouli C, Yong ST, Lam YL, Ton SH, Abdul Kadir K. Glycyrrhizic Acid Improves Lipid and Glucose Metabolism in High-Sucrose-Fed Rats. Journal of Endocrinology Metabolism. 2011;1:125–141. [Google Scholar]
- 22.Ng Y, Chandramouli C, Ton S, Khalid B, Haque F, Tamotharan M. Modulation of glucose and lipid metabolism in adrenalectomised rats given glycyrrhizic acid. Journal of Molecular Pathophysiology. 2012;1:3–20. [Google Scholar]
- 23.Fernando H, Chin H, Ton S, Khalid B. Stress and Its Effects on Glucose Metabolism and 11β-HSD Activities in Rats Fed on a Combination of High-Fat and High-Sucrose Diet with Glycyrrhizic Acid. J Diabetes Res. 2013;2013:190395. doi: 10.1155/2013/190395. [DOI] [PMC free article] [PubMed] [Google Scholar]
- 24.Yaw H, Ton S, Khalid B, Tan T, Teo Y, Yohanes M. Effects of Glycyrrhetic Acid (GE) on Some Gluconeogenic Enzymes, Lipoprotein Lipase and Peroxisome Proliferator-Activated Receptors Alpha and Gamma. The Open Bioactive Compounds Journal. 2013;4:14–24. [Google Scholar]
- 25.Chia Y, Ton S, Khalid B. Effects of glycyrrhizic acid on peroxisome prolifertor-activated receptor gamma (PPARγ), lipoprotein lipase (LPL), serum lipid and HOMA-IR in rats. PPAR Research. 2010;2010:530265. doi: 10.1155/2010/530265. [DOI] [PMC free article] [PubMed] [Google Scholar]
- 26.Alberts P, Engblom L, Edling N, Forsgren M, Klingström G, Larsson C, Rönquist-Nii Y, Ohman B, Abrahmsén L. Selective inhibition of 11beta-hydroxysteroid dehydrogenase type 1 decreases blood glucose concentrations in hyperglycaemic mice. Diabetologia. 2002;45:1528–1532. doi: 10.1007/s00125-002-0959-6. [DOI] [PubMed] [Google Scholar]
- 27.Petrescu I, Bojan O, Saied M, Barzu O, Schmidt F, Kuhnle H. Determination of phosphoenolpyruvate carboxykinase activity with deoxyguanosine 5’-diphosphate as nucleotide substrate. Anal Biochem. 1979;96:279–281. doi: 10.1016/0003-2697(79)90582-7. [DOI] [PubMed] [Google Scholar]
- 28.Csala M, Margittai E, Senesi S, Gamberucci A, Banhegyi G, Mandi J, benedetti A. Inhibition of hepatic glucose-6-phosphatase system by the green tea flavanol epigallocatechin gallate. FEBS Lett. 2007;581:1693–1698. doi: 10.1016/j.febslet.2007.03.045. [DOI] [PubMed] [Google Scholar]
- 29.Banhegyi G, Banedeti A, Fulceri R, Senesi S. Cooperativity between 11β-hydroxysteroid dehydrogenase type 1 and hexose-6-phosphate dehydrogenase in the lumen of the endoplasmic reticulum. J Biol Chem. 2004;279:27017–27021. doi: 10.1074/jbc.M404159200. [DOI] [PubMed] [Google Scholar]
- 30.Ainsah O, Nabishah B, Osman C, Khalid B. Effects of naloxone, glycyrrhizic acid, dexamethasone and deoxycorticorstirone in repetitive stress. Clin Exp Pharmacol Physiol. 1999;26:433–437. doi: 10.1046/j.1440-1681.1999.03052.x. [DOI] [PubMed] [Google Scholar]
- 31.Ainsah O, Nabishah B, Osman C, Khalid B. Short- and long-term effects of glycyrrhizic acid in repetitive stress. Clin Exp Pharmacol Physiol. 1999;26:444–448. doi: 10.1046/j.1440-1681.1999.03064.x. [DOI] [PubMed] [Google Scholar]
- 32.Esler M, Jackman G, Bobik A. Determination of norepinephrine apparent release rate and clearance in humans. Life Sci. 1979;25:1461–1470. doi: 10.1016/0024-3205(79)90371-0. [DOI] [PubMed] [Google Scholar]
- 33.Venkataraman S, Munoz R, Candido C, Witchel S. The hypothalamic-pituitary-adrenal axis in critical illness. Rev Endocr Metab Disord. 2007;8:365–373. doi: 10.1007/s11154-007-9058-9. [DOI] [PubMed] [Google Scholar]
- 34.Zardooz H, Zahedi AS, Naseri M. Effect of chronic psychological stress on insulin release from rat isolated pancreatic islets. Life Sci. 2006;79:57–62. doi: 10.1016/j.lfs.2005.12.032. [DOI] [PubMed] [Google Scholar]
- 35.Olswang Y, Blum B, Cassuto H. Glucocorticoids repress transcription of phosphoenolpyruvate carboxykinase (GTP) gene in adipocytes by inhibiting its C/EBP-mediated activation. J Biol Chem. 2003;278:12929–12936. doi: 10.1074/jbc.M300263200. [DOI] [PubMed] [Google Scholar]
- 36.Wang Y, Botolin D, Xu J, Christian B, Mitchel E, Jayaprakasam B, Nair M, Peters JM, Busik J, olson LK, Jump DB. Regulation of hepatic fatty acid elongase and desaturase expression in diabetes and obesity. J Lipid Res. 2006;47:2028–2041. doi: 10.1194/jlr.M600177-JLR200. [DOI] [PMC free article] [PubMed] [Google Scholar]
- 37.Vegiopoulos A, Verzig S. Glucocorticoids, metabolism and metabolic diseases. Molecular Cellular Endocrinology. 2007;275:43–61. doi: 10.1016/j.mce.2007.05.015. [DOI] [PubMed] [Google Scholar]
- 38.Dhingra D, Sharma A. Antidepressant-like activity of Glycyrrhiza glabra L. in mouese models of immobility tests. Prog Neuropsychopharmacol Biol Psychiatry. 2006;30:449–454. doi: 10.1016/j.pnpbp.2005.11.019. [DOI] [PubMed] [Google Scholar]
- 39.Robson AC, Leckie CM, Seckl JR, Holmes MC. 11β-hydroxysteroid dehydrogenase type 2 in the postnatal and adult rat brain. Brain Res Mol Brain Res. 1998;61:1–10. doi: 10.1016/s0169-328x(98)00161-2. [DOI] [PubMed] [Google Scholar]
- 40.Zhang Z, Kang Y, Wei S, Schmidt T, Johnson A, Felder R. 11β-hydroxysteroid dehydrogenase type 2 activity in hypothalamic paraventricular nucleus modulates sympathetic excitation. Hypertension. 2006;48:127–133. doi: 10.1161/01.HYP.0000224296.96235.dd. [DOI] [PubMed] [Google Scholar]


