Low stomatal conductance and photosynthetic capacity increases Arabidopsis CO2 growth enhancement under N-limited but not N-sufficient conditions.
Abstract
The objective of this study was to determine if low stomatal conductance (g) increases growth, nitrate (NO3−) assimilation, and nitrogen (N) utilization at elevated CO2 concentration. Four Arabidopsis (Arabidopsis thaliana) near isogenic lines (NILs) differing in g were grown at ambient and elevated CO2 concentration under low and high NO3− supply as the sole source of N. Although g varied by 32% among NILs at elevated CO2, leaf intercellular CO2 concentration varied by only 4% and genotype had no effect on shoot NO3– concentration in any treatment. Low-g NILs showed the greatest CO2 growth increase under N limitation but had the lowest CO2 growth enhancement under N-sufficient conditions. NILs with the highest and lowest g had similar rates of shoot NO3– assimilation following N deprivation at elevated CO2 concentration. After 5 d of N deprivation, the lowest g NIL had 27% lower maximum carboxylation rate and 23% lower photosynthetic electron transport compared with the highest g NIL. These results suggest that increased growth of low-g NILs under N limitation most likely resulted from more conservative N investment in photosynthetic biochemistry rather than from low g.
The availability of water varies in time and space, and plants in a given environment are expected to evolve a stomatal behavior that optimizes the tradeoff of CO2 uptake for photosynthesis at the cost of transpirational water loss. The resource of CO2 also varies over time, and plant fossils indicate that stomatal characteristics have changed in response to periods of high and low atmospheric CO2 over the past 65 million years (Beerling and Chaloner, 1993; Van Der Burgh et al., 1993; Beerling, 1998; Kürschner, 2001; Royer et al., 2001). Relatively low atmospheric CO2 concentrations (less than 320 µmol mol−1) over the last 23 million years (Pearson and Palmer, 2000) are associated with increased stomatal conductance (g) to avoid CO2 starvation (Beerling and Chaloner, 1993). Atmospheric CO2 concentration has risen rapidly from 280 to 400 µmol mol−1 since 1800 and has resulted in lower stomatal density (Woodward, 1987; Woodward and Bazzaz, 1988; Lammertsma et al., 2011). At the current atmospheric CO2 concentration (400 µmol mol−1), further decreases in g reduce water loss but also restrict CO2 assimilation and, thus, limit the effectiveness of low g in water-stressed environments (Comstock and Ehleringer, 1993; Virgona and Farquhar, 1996). Elevated CO2 concentration enhances the diffusion gradient for CO2 into leaves, which allows g to decrease without severely restricting photosynthetic carbon gain (Herrick et al., 2004). Most consider such an improvement in water use efficiency in C3 plants to be the main driving force for decreased g at elevated CO2 concentration, especially in dry environments (Woodward, 1987; Beerling and Chaloner, 1993; Brodribb et al., 2009; Franks and Beerling, 2009; Katul et al., 2010).
Water is the most common factor limiting terrestrial plant productivity, but declining stomatal density has also occurred in wetland environments where water stress is uncommon (Wagner et al., 2005). Improved water use efficiency at elevated CO2 concentration may be shifting the most common factor limiting plant productivity from water to nitrogen (N). In herbarium specimens of 14 species of trees, shrubs, and herbs, leaf N decreased 31% as atmospheric CO2 increased from about 270 to 400 μmol mol−1 since 1750 (Penuelas and Matamala, 1990). Indeed, many studies have shown that N availability limits the stimulation of plant growth at elevated CO2 concentration (Luo et al., 2004; Dukes et al., 2005; Reich et al., 2006). That most plants at elevated CO2 concentration exhibit both lower g and greater N limitation suggests a relationship between these factors.
Plants primarily absorb N as nitrate (NO3–) in most temperate soils and assimilate a major portion of this NO3– in shoots (Epstein and Bloom, 2005). Elevated CO2 increases the ratio of CO2 to oxygen in the chloroplast, decreasing photorespiration and improving photosynthetic efficiency (Sharkey, 1988) but inhibiting photorespiration-dependent NO3– assimilation (Rachmilevitch et al., 2004; Bloom et al., 2010, 2012; Bloom, 2014). Greater rhizosphere NO3– availability tends to enhance root NO3– assimilation and decrease the influence of elevated CO2 concentration on plant organic N accumulation (Kruse et al., 2002, 2003; Bloom et al., 2010).
The most important factor regulating chloroplast CO2 concentration among natural accessions of Arabidopsis (Arabidopsis thaliana) is g and to a lesser extent mesophyll conductance (Easlon et al., 2014). Low g may decrease the ratio of CO2 to oxygen in the chloroplast at elevated CO2 concentration, enhancing photorespiration-dependent NO3– assimilation. Alternatively, increasing atmospheric CO2 may down-regulate the need to synthesize enzymes such as Rubisco to support photosynthesis, which conserves organic N, and g may decline as a by-product of lower photosynthetic capacity (Sage et al., 1989; Moore et al., 1998).
Here, we examined the influence of atmospheric CO2 concentration and NO3– supply on photosynthesis, leaf N, and growth in near isogenic lines (NILs) of Arabidopsis differing in g. Arabidopsis accessions differ in many traits (including g) and likewise differ in DNA sequence at a large percentage of genes across the genome (Cao et al., 2011). Use of these NILs greatly reduces the proportion of the genome that varies and minimizes the influence of variation in other traits that are frequently associated with low g and could limit growth (Arp et al., 1998). We tested the extent to which (1) low g was associated with greater CO2 growth enhancement at low and high NO3− supply; (2) low leaf intercellular CO2 concentration (Ci) increased shoot NO3– assimilation; and (3) low g at elevated CO2 concentration was associated with altered N utilization in photosynthetic biochemistry.
RESULTS
Differences in g Were Maintained at Elevated CO2 Concentration
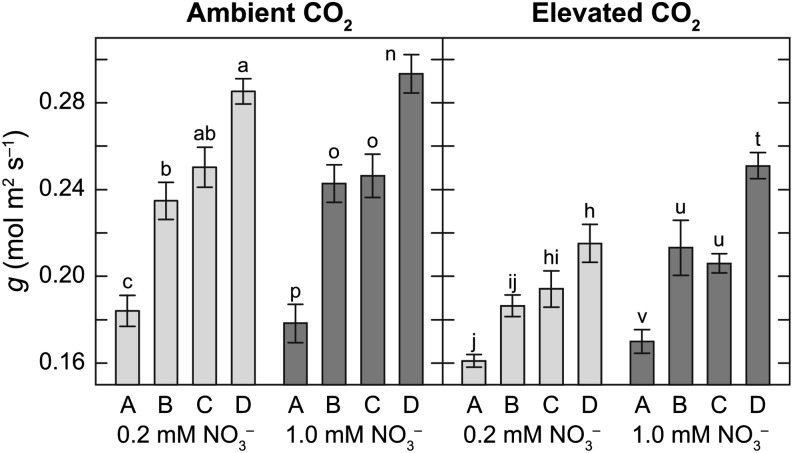
Arabidopsis NILs maintained the same relative statistical ranking independent of CO2 and NO3– treatment (Fig. 1). All the NILs had lower g at elevated than at ambient CO2, ranging from a 4.7% decrease in NIL A at 1 mm NO3– to a 24.5% decrease in NIL D at 0.2 mm NO3–. NO3– treatment had a significant effect on g at elevated CO2 concentration (P < 0.001) but not at ambient CO2 (P = 0.792). Genotype had a significant effect on g at both ambient and elevated CO2 concentrations (both P < 0.001).
Figure 1.
g of four Arabidopsis NILs grown at ambient or elevated CO2 concentration under 0.2 mm NO3– (light-gray bars) or 1 mm NO3– (dark-gray bars). Each bar represents the mean of five to six plants ± se. Means within NO3– treatment are significantly different if labeled with different letters.
Growth and Gas Exchange at Ambient and Elevated CO2 Concentrations
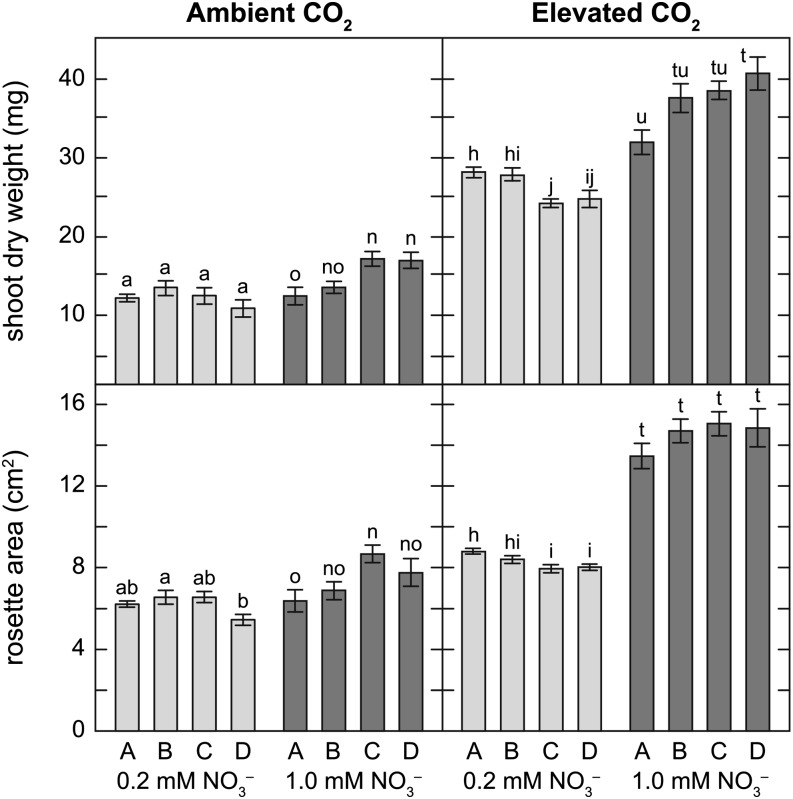
All Arabidopsis NILs at elevated CO2 concentration had 93% to 189% more shoot dry weight at harvest (26 d after planting) than those at ambient CO2 (Fig. 2). Elevated CO2 had a similar effect on rosette area (Fig. 2). NO3– treatment had a significant effect on shoot dry weight at both ambient and elevated CO2 concentrations (both P < 0.001). There was a significant interaction between NO3– and genotype on shoot dry weight at elevated CO2 concentration (P < 0.001). When grown at elevated CO2 concentration, shoot dry weight and rosette area at harvest were higher in the high-g NIL (D) than in the low-g NIL (A) under 1 mm NO3– and lower in the high-g NIL (D) than in the low-g NIL (A) under 0.2 mm NO3–.
Figure 2.
Shoot dry weight and rosette area of four Arabidopsis NILs grown at ambient or elevated CO2 concentration under 0.2 mm NO3– (light-gray bars) or 1 mm NO3– (dark-gray bars). Each bar represents the mean of five to six plants ± se. Means within NO3– treatment are significantly different if labeled with different letters.
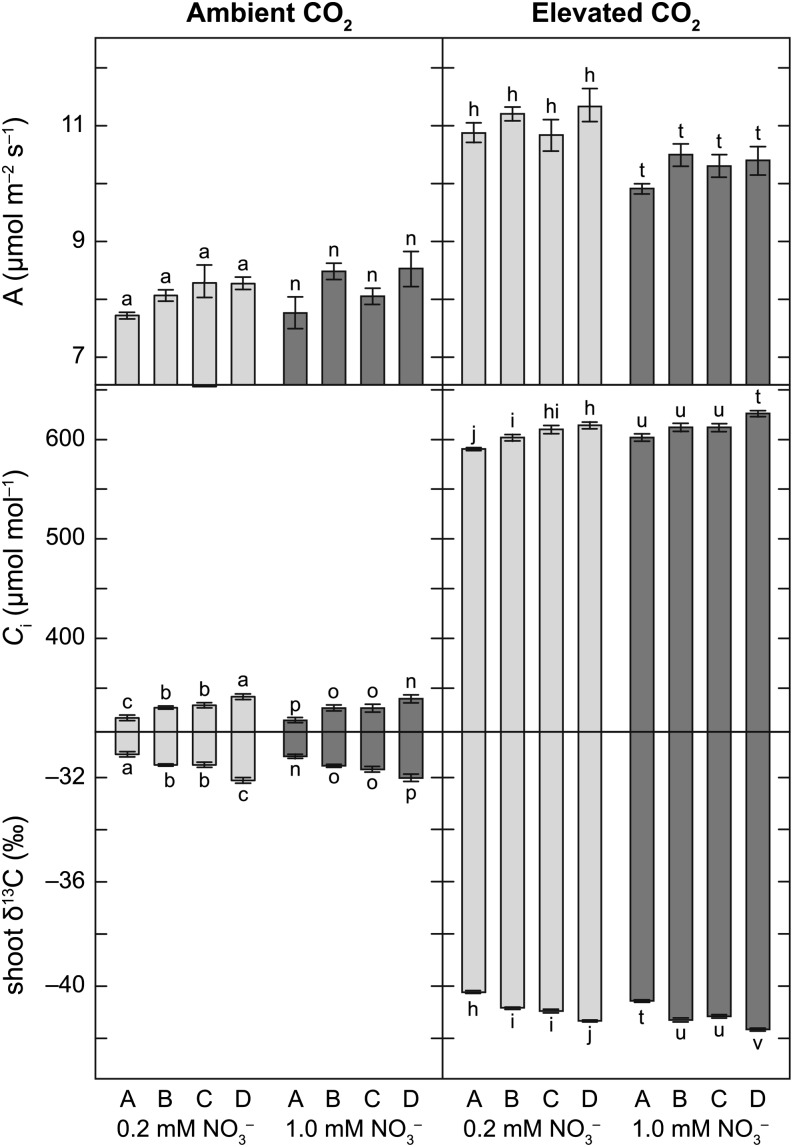
Twenty-five days after planting, rosette photosynthesis per unit of leaf area was 22% to 41% higher at elevated than at ambient CO2 concentration (Fig. 3). At elevated CO2 concentrations but not at ambient CO2 concentration, rosette photosynthesis per leaf area was faster (elevated, P < 0.001; ambient, P = 0.407), Ci was lower (P < 0.001 and P = 0.166), and leaf carbon isotope composition (δ13C) was smaller (P < 0.001 and P = 0.438) under low than high NO3–. Genotype had a significant effect on Ci and δ13C in all NO3– treatments at ambient and elevated CO2 concentrations (all P < 0.001).
Figure 3.
Photosynthesis (A), Ci, and shoot δ13C of four Arabidopsis NILs grown at ambient or elevated CO2 concentration under 0.2 mm NO3– (light-gray bars) or 1 mm NO3– (dark-gray bars). Each bar represents the mean of five to six plants ± se. Means within NO3– treatment are significantly different if labeled with different letters.
Shoot N at Ambient and Elevated CO2 Concentrations
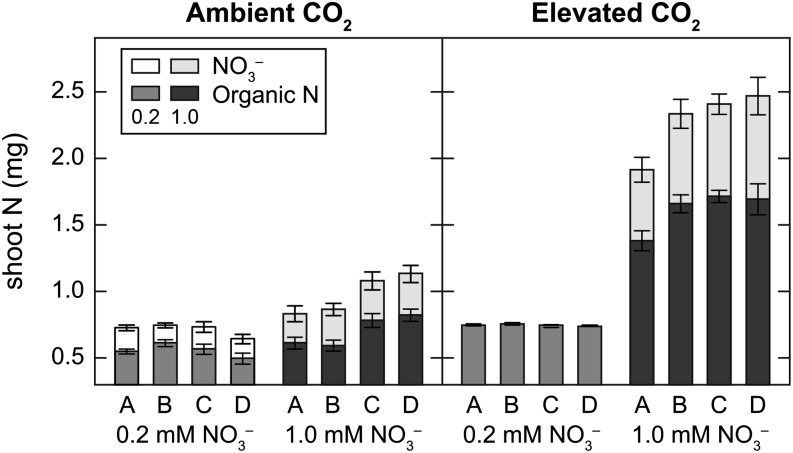
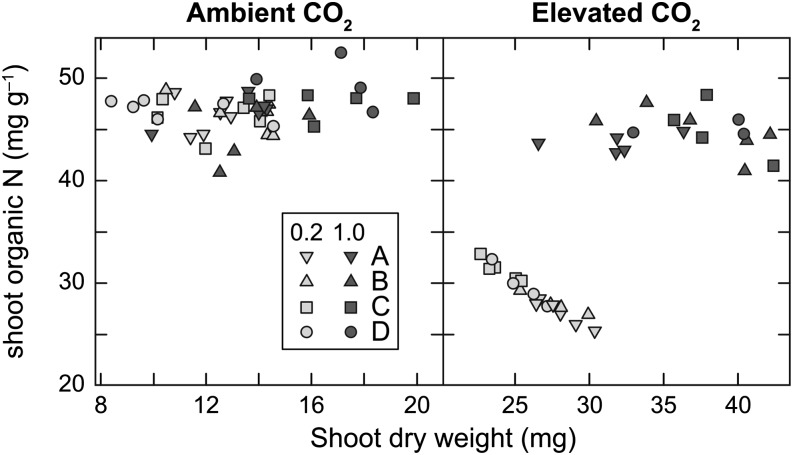
Leaves accumulated substantial NO3– in all treatments except for the low-NO3– treatment at elevated CO2 concentration (Fig. 4). Genotype had a significant effect on total organic N under 1 mm NO3– in both CO2 treatments (ambient, P = 0.006; elevated, P = 0.02). Shoot organic N concentration was 31% to 40% lower under low than high NO3– at elevated CO2 concentration but was similar in both NO3– treatments at ambient CO2 concentration (Fig. 5). The low-g NILs (A and B) did not have significantly more organic N than the high-g NILs (C and D) under 0.2 mm NO3– at either CO2 concentration (Fig. 4). Shoot organic N concentration, however, was negatively correlated with shoot dry weight at harvest (r2 = 0.931, P < 0.001) in low-NO3– plants grown at elevated CO2 concentration but not in any other treatment (Fig. 5).
Figure 4.
Total shoot NO3− and organic N in four Arabidopsis NILs grown at ambient or elevated CO2 concentration under 0.2 mm NO3– or 1 mm NO3–. Each bar represents the mean of four to six plants ± se.
Figure 5.
Relationship between shoot organic N concentration and shoot dry weight in four Arabidopsis NILs grown at ambient or elevated CO2 concentration under 0.2 mm NO3− or 1 mm NO3–. Symbols represent individual plant values.
NO3− Assimilation after N Deprivation at Elevated CO2 Concentration
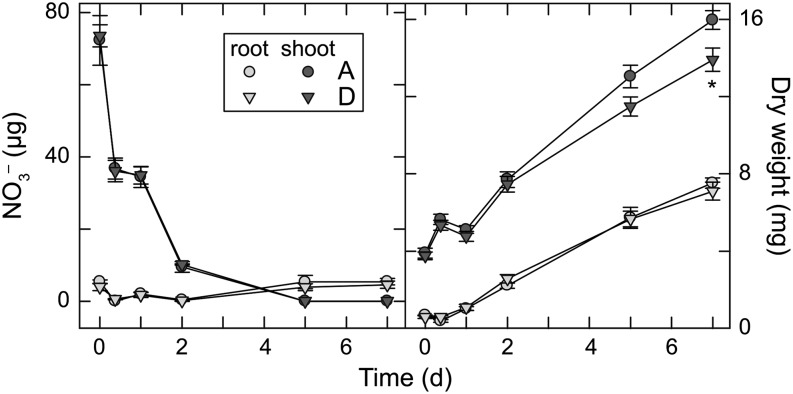
In the second experiment, multiple harvests following transfer from 1 mm NO3– to 0 mm NO3− were used to assess the rates of shoot NO3− assimilation in the lowest and highest g NILs (A and D). After transfer from 1 mm NO3− to 0 mm NO3–, total shoot NO3– declined 49% to 51% in both low- and high-g NILs during the first light period, indicating similar NO3– assimilation rates in these genotypes (Fig. 6). Root NO3– declined to undetectable levels after the first light period but recovered partially during the first night. Shoot NO3– content did not change during the first night. Both shoot and root NO3– concentrations became negligible by the second day. Shoot growth differences between NILs become apparent as shoot NO3– declined, but root growth of the NILs was similar throughout the experiment.
Figure 6.
Shoot and root NO3– and dry weight for two NILs grown at elevated CO2 concentration 0 to 7 d after N deprivation. Each symbol represents the mean of five to six plants for each NIL ± se. The asterisk indicates a statistically significant difference (P < 0.05).
N-Sufficient and N-Limited Photosynthesis at Elevated CO2 Concentration
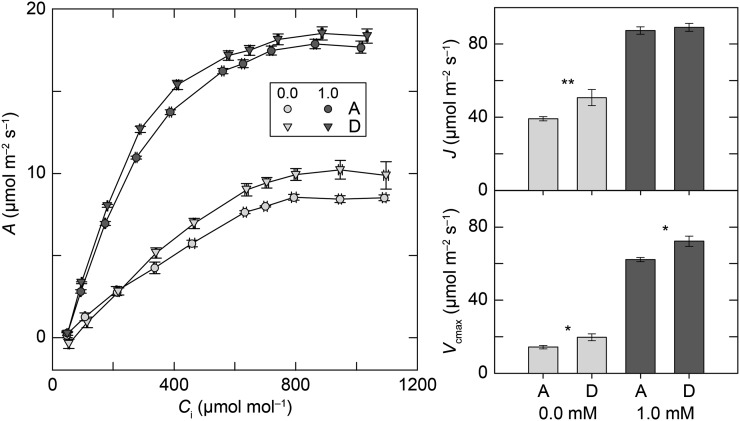
Photosynthetic CO2 response curves of the lowest and highest g NILs (A and D) were compared 5 d after transfer to 0 mm NO3– or 1 mm NO3– nutrient solution (Fig. 7). N limitation had a large effect on maximum carboxylation rate (Vcmax) and photosynthetic electron transport (J) in both NILs (both P < 0.001). At high NO3–, Vcmax was 14% lower and J was 2% lower in NIL A than in NIL D. Under N limitation, genotype differences in photosynthetic parameters became more pronounced, with Vcmax 27% lower and J 23% lower in NIL A than in NIL D.
Figure 7.
Photosynthetic response curves (A) for two NILs grown at elevated CO2 concentration 5 d after N deprivation or 1 mm NO3– control treatment. Vcmax and J were obtained from the photosynthetic CO2 response curves. Each symbol or bar represents the mean of six plants ± se. Asterisks represent levels of statistical significance within NO3− treatment (*P < 0.05 and **P < 0.01).
DISCUSSION
Our hypothesis that the low-g Arabidopsis NILs would grow faster than the high-g NILs at elevated CO2 concentration under low NO3– supply was confirmed (Figs. 2 and 6). Plant responses to elevated CO2 concentration vary with the degree to which CO2 is the primary factor limiting growth. Sustained stimulation of growth in long-term CO2 enrichment studies generally requires heavy fertilization and irrigation, so neither N nor water is a limiting resource (de Graaff et al., 2006; Newingham et al., 2013). Here, the high-g Arabidopsis NILs showed the greatest growth enhancement at elevated CO2 concentration under high NO3− supply (Fig. 2). This agrees with the common view that inherently fast-growing species have the greatest potential for growth enhancement at elevated CO2 concentration (Poorter and Navas, 2003). Conversely, low g is usually associated with nutrient- or water-limited environments that constrain growth enhancement by elevated CO2 concentration. Adaptation to nutrient- or water-limited environments results in a suite of changes in plant allocation and growth, but our use of Arabidopsis NILs minimized differences in plant performance that did not derive from genetic differences in g. Better performance in the low-g NILs under N limitation at elevated CO2 concentration (Fig. 2) indicates a coupling of low g and improved N utilization or that improved N utilization lowered g.
Effect of Low g on Ci and NO3− Assimilation at Elevated CO2 Concentration
Shoot NO3– and shoot organic N content at elevated CO2 concentration suggest that the low-g NILs did not have significantly faster shoot NO3– assimilation than the high-g NILs. At elevated CO2 concentration, Ci varied by only 24 μmol mol−1 on a background of about 610 µmol mol–1 between the highest and lowest g NILs. Likewise, δ13C, which is affected by both stomatal and mesophyll conductances (Seibt et al., 2008), indicates that chloroplast CO2 concentrations mirrored Ci estimates (Fig. 3). This relatively small change in Ci would have negligible effects on the rates of photorespiratory NO3– assimilation (Bloom et al., 2012). More pronounced decreases in g and/or mesophyll conductances would be required to lower chloroplast CO2 concentration and stimulate rates of photorespiration similar to those observed at 400 μmol mol−1 atmospheric CO2.
If elevated CO2 concentration suppressed NO3– assimilation, shoot NO3– accumulation should increase and shoot organic N concentration should decrease. Accordingly, at high NO3– supply, total shoot NO3– was higher (Fig. 4), and shoot organic N concentration was lower (Fig. 5) at elevated than at ambient CO2 concentration. Total shoot organic N increased at elevated CO2 concentration, but this may reflect that elevated CO2 concentration stimulates root NO3– assimilation (Kruse et al., 2002, 2003). Being able to distinguish between shoot and root NO3– assimilation would allow us to discern the effects of CO2 inhibition of photorespiratory NO3– assimilation on total shoot organic N content.
Under low N at elevated CO2 concentration, all four genotypes assimilated all of the available NO3–. The large decline in organic N concentration at elevated CO2 concentration under low NO3– supply resulted from an N limitation (Fig. 5). Under N limitation, the low-g NILs had higher shoot dry weight and leaf area than the high-g NILs (Fig. 2). Shoot dry weight was negatively correlated with shoot organic N concentration at elevated CO2 concentration under low NO3– supply, indicating that improved N utilization may explain the better performance of the low-g NILs under N limitation (Fig. 5). This negative correlation was not observed at ambient CO2 concentration under low NO3– supply, most likely because slower growth resulted in a delayed onset of N limitation.
NO3− Assimilation following N Deprivation at Elevated CO2 Concentration
In the second experiment, plants were transferred from high NO3– supply to a solution without N. In both the highest and lowest g NILs, shoot NO3– content declined rapidly during the first day and not at night, indicating that NO3– assimilation depended on photosynthesis and occurred at similar rates in the highest and lowest g NILs (Fig. 6). Indeed, the low- and high-g NILs did not differ much in internal Ci (Fig. 3). Photoassimilatory NO3– assimilation is relatively insensitive to small changes in Ci at elevated CO2 concentration (Bloom et al., 2012), so more pronounced differences in g and/or mesophyll conductance may be required to observe differences in the rates of shoot NO3– assimilation at elevated CO2 concentration.
N-Sufficient and N-Limited Photosynthesis at Elevated CO2 Concentration
At elevated CO2 concentrations but not ambient CO2 concentration, rosette photosynthesis per leaf area was faster under low than high NO3– (Fig. 3). Higher photosynthesis per leaf area under NO3– may result from lower specific leaf area under N limitation (Fig. 2); however, shoot organic N concentration was also lower under low than high NO3– (Fig. 5). This appears to be in opposition to the well-documented relationship between assimilation and leaf organic N concentration (Field and Mooney, 1986; Evans, 1989). In the second experiment, photosynthesis was higher under high than low NO3– (Fig. 7). Differences in photosynthesis between these two experiments may result from gradual versus sudden imposition of N limitation and growth level (350 μmol m−2 s−1) versus saturating (1,000 μmol m−2 s−1) photosynthetic photon flux density (PPFD) during gas-exchange measurements. Photosynthetic capacity may have been higher under N-sufficient growth in the first experiment, but higher respiration associated with higher leaf organic N concentration may have resulted in lower photosynthesis under nonsaturating PPFD.
In the first experiment, the high- and low-g NILs had similar rates of carbon assimilation, photosynthesis at elevated CO2 concentration (Fig. 3), but in the second experiment, the two genotypes exhibited differences in their biochemical parameters of photosynthesis. At elevated CO2 concentration, the low-g NIL experienced more of a decrease in Vcmax and J under N deprivation than the high-g NIL (Fig. 7). Lower Vcmax (the maximum rate of ribulose 1,5-bisphosphate carboxylation) indicates a lower Rubisco content or less Rubisco activation, whereas lower J indicates a lower rate of electron transport driving ribulose 1,5-bisphosphate regeneration. The low-g NIL also had greater growth (Fig. 6) and lower organic N concentration (Fig. 5) than the high-g NIL. Lower Vcmax and lower organic N concentration support the interpretation that under N limitation, the low-g NIL invested less N in Rubisco than the high-g NIL and thus was able to continue to grow with a lower leaf organic N concentration. Long-term exposure to elevated atmospheric CO2 frequently results in a decline in leaf Rubisco content (Sage et al., 1989; Moore et al., 1998). Because Rubisco can constitute as much as 30% of leaf N (Evans, 1989), reallocating N from Rubisco to other components of leaf photochemistry may improve N utilization (Sage et al., 1989; Moore et al., 1998). High rates of Rubisco inactivation at elevated CO2 concentration suggest that many C3 plants, even after photosynthetic acclimation to elevated CO2 concentration, overinvest in Rubisco (Sage et al., 1989). While high investment in photosynthetic biochemistry is beneficial for N-sufficient growth, it may also explain the slower growth of the high-g NIL relative to the low-g NIL under N limitation observed in both experiments (Figs. 2 and 6). Higher photosynthesis at elevated CO2 concentration can only improve growth if other nutrients are available so that additional carbon fixed can be converted into useful plant tissue (Kirschbaum 2011).
In summary, a 32% lower g in these four Arabidopsis NILs resulted in only a 4% decrease in Ci (Fig. 3). This small change in Ci, particularly at elevated CO2 concentration, should not and did not have a large effect on shoot NO3– assimilation. The low-g strategy, however, provided an advantage under N limitation, most likely as a result of more conservative investment in photosynthetic biochemistry. Low photosynthetic capacity rather than low g is important for N-limited growth at elevated CO2 concentration in Arabidopsis.
MATERIALS AND METHODS
Plant Material
Natural accessions of Arabidopsis (Arabidopsis thaliana) vary in g and δ13C, a time-integrated measure of chloroplast CO2-atmospheric CO2 ratio (McKay et al., 2003, 2008; Juenger et al., 2005, 2010; Christman et al., 2008; Monda et al., 2011; Des Marais et al., 2012; Lasky et al., 2012; Easlon et al., 2014). A sample of accessions will also differ in many other traits and harbor hundreds of thousands of polymorphisms in coding and noncoding regions (Cao et al., 2011). To minimize the number of genome-wide differences, we selected four NILs of Arabidopsis varying in δ13C. NILs were selected from the NIL library described by Fletcher et al. (2013) based on chromosomal introgressions at quantitative trait loci for g or δ13C from the Kas-1 (CS903) accession in a Tsu-1 (CS1640) accession background (Table I). Kas-1 is a winter accession with high water use efficiency, low g and photosynthesis, and long flowering time. Tsu-1 is a spring accession with low water use efficiency, high g and photosynthesis, and short flowering time (Easlon et al., 2014).
Table I. Arabidopsis NILs.
Arabidopsis NILs were generated from introgression of quantitative trait loci for g and leaf δ13C from Kas-1 into a Tsu-1 genetic background.
Hydroponic Growth
Seeds were germinated in GA-7 Magenta vessels on sand saturated with a nutrient solution that contained 1 mm CaSO4, 0.75 mm K2HPO4, 0.25 mm KH2PO4, 0.75 mm MgSO4, and 0.04 g L−1 iron-diethylene triamine pentaacetic acid and micronutrients at 20% (v/v) strength of a modified Hoagland solution (Epstein and Bloom, 2005) with 0.2 mm KNO3 as the sole source of N. Plants were grown in controlled-environment chambers (Conviron) set at 23°C/20°C light/dark and 50% to 60% relative humidity with 9 h of light per day at 350 μmol m−2 s−1 PPFD at plant height. After 7 d, seedlings were transferred to 300-mL opaque polyethylene bottles containing the above nutrient solution with 0.2 or 1 mm KNO3 as the sole source of N. Seedling hypocotyls were placed in a foam rubber plug, and roots were inserted into a hydroponics solution through a hole drilled in the lid.
CO2 × NO3− Study
In the first experiment, four NILs were grown in chambers at either ambient CO2 (405 ± 25 μmol mol−1) or elevated CO2 (720 ± 20 μmol mol−1) with either 0.2 or 1 mm KNO3 as the sole source of N. Six plants per NIL × NO3– combination were grown in each chamber in a complete randomized design (48 plants per CO2 treatment). At 19 d after transfer to hydroponics, rosettes were photographed for leaf area and plants were harvested. This growth duration was selected to avoid flowering, because flowering has significant effects on gas exchange and N partitioning in Arabidopsis.
N Deprivation at Elevated CO2 Concentration
The NILs (A and D) that had the lowest and highest g according to the first experiment were grown at elevated CO2 concentration in nutrient solution under 1 mm KNO3 for the first 12 d in hydroponics. At dawn the next day, plants were transferred to a nutrient solution containing 0 or 1 mm KNO3. Six N-deprived plants per genotype were harvested 0 h (right after solution change), 9 h (dusk), 1 d, 2 d, 5 d, and 7 d after the solution change. Six control 1 mm KNO3 plants per genotype were harvested on the last harvest date (six replicates × six harvests × two NILs + six replicates × two NILs = 84 plants).
N Analyses
At each harvest, rosettes were photographed for leaf area, plants were divided into shoots and roots, and roots were rinsed in deionized water. Shoots and roots were oven dried at 55°C for 48 h and weighed. Whole shoots and roots were ground to a fine powder in centrifuge tubes with ball bearings to determine NO3– and total N. Subsamples (2–5 mg) were extracted in 1.5 mL of 10 mm CaSO4 and clarified by centrifugation. Aliquots were analyzed for NO3– using the Griess reaction (Miranda et al., 2001). In the first experiment, total N and δ13C was determined at the University of California-Davis Stable Isotope Facility (http://stableisotopefacility.ucdavis.edu/). Differences in δ13C between CO2 treatments must be viewed with caution, as the 13C composition of chamber CO2, especially in the elevated CO2 concentration chamber, was variable. Organic N was estimated by subtracting NO3–-N from total N. In the NO3– deprivation experiment, plants were only analyzed for NO3– because there was not sufficient material to measure total N and δ13C.
Gas Exchange
Whole-canopy gas exchange was measured using a LI-6400 device with a 6400-17 whole-shoot Arabidopsis chamber (Li-Cor). In the first experiment, gas exchange was measured on all plants 18 d after transfer to hydroponics. The Arabidopsis chamber was maintained at 350 μmol m−2 s−1 PPFD, leaf temperature was maintained at 23°C, and relative humidity was maintained at 60%. CO2 was maintained at either 400 or 720 μmol mol−1 to match environmental chamber conditions. In the NO3– deprivation experiment, photosynthetic response curves were measured on six plants of each genotype from the N-deprived (0 mm NO3–) and control (1 mm NO3−) treatments 17 d after transfer to hydroponics (5 d after N deprivation). Arabidopsis chamber conditions were the same as above, but PPFD was at saturating (1,000 μmol m−2 s−1) light and CO2 was adjusted in a stepwise fashion to obtain photosynthetic response curves. Following gas-exchange measurements for each plant, leaf area was determined from digital photographs of plant rosettes using Easy Leaf Area software (Easlon and Bloom, 2014). Because of large CO2 gradients between the chamber and outside, empty chamber leak corrections were applied to data. Vcmax and J were calculated using a least-squares iterative curve-fitting procedure (Sharkey et al., 2007) to fit the Farquhar biochemical model for photosynthesis (Farquhar et al., 1980).
Statistical Analyses
We conducted ANOVA using PROC GLM in SAS (SAS 9.3). Mean separations were determined using Tukey’s tests (P < 0.05 was considered statistically significant). All data except shoot organic N and NO3– content satisfied the ANOVA assumptions of normality and homogeneity of variances. One-way ANOVA within each NO3– treatment (0.2 versus 1 mm) met the assumptions of ANOVA for N data, so N data were analyzed via one-way ANOVA to test for genotypic effects. We estimated correlations among physiological traits as the standard Pearson product-moment correlation.
Acknowledgments
We thank Madeline Perez for assistance in the growth chambers and laboratory, Rich Fletcher for help in selecting NILs, and the editor and reviewers for insightful comments.
Glossary
- g
stomatal conductance
- N
nitrogen
- NIL
near isogenic line
- Ci
intercellular CO2 concentration
- δ13C
carbon isotope composition
- Vcmax
maximum carboxylation rate
- J
photosynthetic electron transport
- PPFD
photosynthetic photon flux density
Footnotes
This work was supported by the National Research Initiative Competitive Grants Program (grant no. 2008–0214546).
References
- Arp WJ, Van Mierlo JEM, Berendse F, Snijders W (1998) Interactions between elevated CO2 concentration, nitrogen and water: effects on growth and water use of six perennial plant species. Plant Cell Environ 21: 1–11 [Google Scholar]
- Beerling DJ. (1998) The future as the key to the past for palaeobotany? Trends Ecol Evol 13: 311–316 [DOI] [PubMed] [Google Scholar]
- Beerling DJ, Chaloner WG (1993) Evolutionary responses of stomatal density to global CO2 change. Biol J Linn Soc Lond 48: 343–353 [Google Scholar]
- Bloom AJ. (2015) Photorespiration and nitrate assimilation: a major intersection between plant carbon and nitrogen. Photosynth Res 123: 117–128 [DOI] [PubMed] [Google Scholar]
- Bloom AJ, Asensio JSR, Randall L, Rachmilevitch S, Cousins AB, Carlisle EA (2012) CO2 enrichment inhibits shoot nitrate assimilation in C3 but not C4 plants and slows growth under nitrate in C3 plants. Ecology 93: 355–367 [DOI] [PubMed] [Google Scholar]
- Bloom AJ, Burger M, Asensio JSR, Cousins AB (2010) Carbon dioxide enrichment inhibits nitrate assimilation in wheat and Arabidopsis. Science 328: 899–903 [DOI] [PubMed] [Google Scholar]
- Brodribb TJ, McAdam SAM, Jordan GJ, Feild TS (2009) Evolution of stomatal responsiveness to CO2 and optimization of water-use efficiency among land plants. New Phytol 183: 839–847 [DOI] [PubMed] [Google Scholar]
- Cao J, Schneeberger K, Ossowski S, Günther T, Bender S, Fitz J, Koenig D, Lanz C, Stegle O, Lippert C, et al. (2011) Whole-genome sequencing of multiple Arabidopsis thaliana populations. Nat Genet 43: 956–963 [DOI] [PubMed] [Google Scholar]
- Christman MA, Richards JH, McKay JK, Stahl EA, Juenger TE, Donovan LA (2008) Genetic variation in Arabidopsis thaliana for night-time leaf conductance. Plant Cell Environ 31: 1170–1178 [DOI] [PubMed] [Google Scholar]
- Comstock J, Ehleringer J (1993) Stomatal response to humidity in common bean (Phaseolus vulgaris): implications for maximum transpiration rate, water use efficiency and productivity. Aust J Plant Physiol 20: 669–691 [Google Scholar]
- de Graaff MA, van Groenigen KJ, Six J, Hungate B, van Kessel C (2006) Interactions between plant growth and soil nutrient cycling under elevated CO2: a meta-analysis. Glob Change Biol 12: 2077–2091 [Google Scholar]
- Des Marais DL, McKay JK, Richards JH, Sen S, Wayne T, Juenger TE (2012) Physiological genomics of response to soil drying in diverse Arabidopsis accessions. Plant Cell 24: 893–914 [DOI] [PMC free article] [PubMed] [Google Scholar]
- Dukes JS, Chiariello NR, Cleland EE, Moore LA, Shaw MR, Thayer S, Tobeck T, Mooney HA, Field CB (2005) Responses of grassland production to single and multiple global environmental changes. PLoS Biol 3: e319. [DOI] [PMC free article] [PubMed] [Google Scholar]
- Easlon HM, Bloom AJ (2014) Easy Leaf Area: automated digital image analysis for rapid and accurate measurement of leaf area. Appl Plant Sci 2: 1400033. [DOI] [PMC free article] [PubMed] [Google Scholar]
- Easlon HM, Nemali KS, Richards JH, Hanson DT, Juenger TE, McKay JK (2014) The physiological basis for genetic variation in water use efficiency and carbon isotope composition in Arabidopsis thaliana. Photosynth Res 119: 119–129 [DOI] [PMC free article] [PubMed] [Google Scholar]
- Epstein E, Bloom AJ (2005) Mineral Nutrition of Plants: Principles and Perspectives, Ed 2 Sinauer Associates, Sunderland, MA [Google Scholar]
- Evans JR. (1989) Photosynthesis: the dependence on nitrogen partitioning. InLambers H, ed, Causes and Consequences of Variation in Growth Rate and Productivity of Higher Plants. SPB Academic Publishing, The Hague, The Netherlands, pp 159–174 [Google Scholar]
- Farquhar GD, von Caemmerer S, Berry JA (1980) A biochemical model of photosynthetic CO2 assimilation in leaves of C3 species. Planta 149: 78–90 [DOI] [PubMed] [Google Scholar]
- Field C, Mooney HA (1986) The photosynthesis-nitrogen relationship in wild plants. InGivinsh TJ, ed, On the Economy of Plant Form and Function. Cambridge University Press, Cambridge, UK, pp 25–55 [Google Scholar]
- Fletcher RS, Mullen JL, Yoder S, Bauerle WL, Reuning G, Sen S, Meyer E, Juenger TE, McKay JK (2013) Development of a next-generation NIL library in Arabidopsis thaliana for dissecting complex traits. BMC Genomics 14: 655. [DOI] [PMC free article] [PubMed] [Google Scholar]
- Franks PJ, Beerling DJ (2009) Maximum leaf conductance driven by CO2 effects on stomatal size and density over geologic time. Proc Natl Acad Sci USA 106: 10343–10347 [DOI] [PMC free article] [PubMed] [Google Scholar]
- Herrick JD, Maherali H, Thomas RB (2004) Reduced stomatal conductance in sweetgum (Liquidambar styraciflua) sustained over long-term CO2 enrichment. New Phytol 162: 387–396 [Google Scholar]
- Juenger TE, McKay JK, Hausmann N, Keurentjes JJB, Sen S, Stowe KA, Dawson TE, Simms EL, Richards JH (2005) Identification and characterization of QTL underlying whole-plant physiology in Arabidopsis thaliana: delta C-13, stomatal conductance and transpiration efficiency. Plant Cell Environ 28: 697–708 [Google Scholar]
- Juenger TE, Sen S, Bray E, Stahl E, Wayne T, McKay J, Richards JH (2010) Exploring genetic and expression differences between physiologically extreme ecotypes: comparative genomic hybridization and gene expression studies of Kas-1 and Tsu-1 accessions of Arabidopsis thaliana. Plant Cell Environ 33: 1268–1284 [DOI] [PubMed] [Google Scholar]
- Katul G, Manzoni S, Palmroth S, Oren R (2010) A stomatal optimization theory to describe the effects of atmospheric CO2 on leaf photosynthesis and transpiration. Ann Bot (Lond) 105: 431–442 [DOI] [PMC free article] [PubMed] [Google Scholar]
- Kirschbaum MUF. (2011) Does enhanced photosynthesis enhance growth? Lessons learned from CO2 enrichment studies. Plant Physiol 155: 117–124 [DOI] [PMC free article] [PubMed] [Google Scholar]
- Kruse J, Hetzger I, Hänsch R, Mendel RR, Walch-Liu P, Engels C, Rennenberg H (2002) Elevated pCO2 favours nitrate reduction in the roots of wild-type tobacco (Nicotiana tabacum cv. Gat.) and significantly alters N-metabolism in transformants lacking functional nitrate reductase in the roots. J Exp Bot 53: 2351–2367 [DOI] [PubMed] [Google Scholar]
- Kruse J, Hetzger I, Mai C, Polle A, Rennenberg H (2003) Elevated pCO2 affects N-metabolism of young poplar plants (Populus tremula × P. alba) differently at deficient and sufficient N-supply. New Phytol 157: 65–81 [DOI] [PubMed] [Google Scholar]
- Kürschner WM. (2001) Leaf sensor for CO2 in deep time. Nature 411: 247–248 [DOI] [PubMed] [Google Scholar]
- Lammertsma EI, de Boer HJ, Dekker SC, Dilcher DL, Lotter AF, Wagner-Cremer F (2011) Global CO2 rise leads to reduced maximum stomatal conductance in Florida vegetation. Proc Natl Acad Sci USA 108: 4035–4040 [DOI] [PMC free article] [PubMed] [Google Scholar]
- Lasky JR, Des Marais DL, McKay JK, Richards JH, Juenger TE, Keitt TH (2012) Characterizing genomic variation of Arabidopsis thaliana: the roles of geography and climate. Mol Ecol 21: 5512–5529 [DOI] [PubMed] [Google Scholar]
- Luo Y, Su B, Currie WS, Dukes JS, Finzi A, Hartwig U, Hungate B, McMurtrie RE, Oren R, Parton WJ, et al. (2004) Progressive nitrogen limitation of ecosystem responses to rising atmospheric carbon dioxide. Bioscience 54: 731–739 [Google Scholar]
- McKay JK, Richards JH, Mitchell-Olds T (2003) Genetics of drought adaptation in Arabidopsis thaliana. I. Pleiotropy contributes to genetic correlations among ecological traits. Mol Ecol 12: 1137–1151 [DOI] [PubMed] [Google Scholar]
- McKay JK, Richards JH, Nemali KS, Sen S, Mitchell-Olds T, Boles S, Stahl EA, Wayne T, Juenger TE (2008) Genetics of drought adaptation in Arabidopsis thaliana. II. QTL analysis of a new mapping population, KAS-1 × TSU-1. Evolution 62: 3014–3026 [DOI] [PubMed] [Google Scholar]
- Miranda KM, Espey MG, Wink DA (2001) A rapid, simple spectrophotometric method for simultaneous detection of nitrate and nitrite. Nitric Oxide 5: 62–71 [DOI] [PubMed] [Google Scholar]
- Monda K, Negi J, Iio A, Kusumi K, Kojima M, Hashimoto M, Sakakibara H, Iba K (2011) Environmental regulation of stomatal response in the Arabidopsis Cvi-0 ecotype. Planta 234: 555–563 [DOI] [PubMed] [Google Scholar]
- Moore BD, Cheng SH, Rice J, Seemann JR (1998) Sucrose cycling, Rubisco expression, and prediction of photosynthetic acclimation to elevated atmospheric CO2. Plant Cell Environ 21: 905–915 [Google Scholar]
- Newingham BA, Vanier CH, Charlet TN, Ogle K, Smith SD, Nowak RS (2013) No cumulative effect of 10 years of elevated [CO2] on perennial plant biomass components in the Mojave Desert. Glob Chang Biol 19: 2168–2181 [DOI] [PubMed] [Google Scholar]
- Pearson PN, Palmer MR (2000) Atmospheric carbon dioxide concentrations over the past 60 million years. Nature 406: 695–699 [DOI] [PubMed] [Google Scholar]
- Penuelas J, Matamala R (1990) Changes in N and S leaf content, stomatal density and specific leaf area of 14 plant species during the last 3 centuries of CO2 increase. J Exp Bot 41: 1119–1124 [Google Scholar]
- Poorter H, Navas ML (2003) Plant growth and competition at elevated CO2: on winners, losers and functional groups. New Phytol 157: 175–198 [DOI] [PubMed] [Google Scholar]
- Rachmilevitch S, Cousins AB, Bloom AJ (2004) Nitrate assimilation in plant shoots depends on photorespiration. Proc Natl Acad Sci USA 101: 11506–11510 [DOI] [PMC free article] [PubMed] [Google Scholar]
- Reich PB, Hobbie SE, Lee T, Ellsworth DS, West JB, Tilman D, Knops JMH, Naeem S, Trost J (2006) Nitrogen limitation constrains sustainability of ecosystem response to CO2. Nature 440: 922–925 [DOI] [PubMed] [Google Scholar]
- Royer DL, Wing SL, Beerling DJ, Jolley DW, Koch PL, Hickey LJ, Berner RA (2001) Paleobotanical evidence for near present-day levels of atmospheric CO2 during part of the tertiary. Science 292: 2310–2313 [DOI] [PubMed] [Google Scholar]
- Sage RF, Sharkey TD, Seemann JR (1989) Acclimation of photosynthesis to elevated CO2 in five C3 species. Plant Physiol 89: 590–596 [DOI] [PMC free article] [PubMed] [Google Scholar]
- Seibt U, Rajabi A, Griffiths H, Berry JA (2008) Carbon isotopes and water use efficiency: sense and sensitivity. Oecologia 155: 441–454 [DOI] [PubMed] [Google Scholar]
- Sharkey TD. (1988) Estimating the rate of photorespiration in leaves. Physiol Plant 73: 147–152 [Google Scholar]
- Sharkey TD, Bernacchi CJ, Farquhar GD, Singsaas EL (2007) Fitting photosynthetic carbon dioxide response curves for C3 leaves. Plant Cell Environ 30: 1035–1040 [DOI] [PubMed] [Google Scholar]
- Van Der Burgh J, Visscher H, Dilcher DL, Kürschner WM (1993) Paleoatmospheric signatures in neogene fossil leaves. Science 260: 1788–1790 [DOI] [PubMed] [Google Scholar]
- Virgona JM, Farquhar GD (1996) Genotypic variation in relative growth rate and carbon isotope discrimination in sunflower is related to photosynthetic capacity. Aust J Plant Physiol 23: 227–236 [Google Scholar]
- Wagner F, Dilcher DL, Visscher H (2005) Stomatal frequency responses in hardwood-swamp vegetation from Florida during a 60-year continuous CO2 increase. Am J Bot 92: 690–695 [DOI] [PubMed] [Google Scholar]
- Woodward FI. (1987) Stomatal numbers are sensitive to increases in CO2 from preindustrial levels. Nature 327: 617–618 [Google Scholar]
- Woodward FI, Bazzaz FA (1988) The responses of stomatal density to CO2 partial-pressure. J Exp Bot 39: 1771–1781 [Google Scholar]


