

Multiscale network analysis shows a robust gene network architecture in effector-triggered immunity of Arabidopsis.
Abstract
Pattern-triggered immunity (PTI) and effector-triggered immunity (ETI) are two main plant immune responses to counter pathogen invasion. Genome-wide gene network organizing principles leading to quantitative differences between PTI and ETI have remained elusive. We combined an advanced machine learning method and modular network analysis to systematically characterize the organizing principles of Arabidopsis (Arabidopsis thaliana) PTI and ETI at three network resolutions. At the single network node/edge level, we ranked genes and gene interactions based on their ability to distinguish immune response from normal growth and successfully identified many immune-related genes associated with PTI and ETI. Topological analysis revealed that the top-ranked gene interactions tend to link network modules. At the subnetwork level, we identified a subnetwork shared by PTI and ETI encompassing 1,159 genes and 1,289 interactions. This subnetwork is enriched in interactions linking network modules and is also a hotspot of attack by pathogen effectors. The subnetwork likely represents a core component in the coordination of multiple biological processes to favor defense over development. Finally, we constructed modular network models for PTI and ETI to explain the quantitative differences in the global network architecture. Our results indicate that the defense modules in ETI are organized into relatively independent structures, explaining the robustness of ETI to genetic mutations and effector attacks. Taken together, the multiscale comparisons of PTI and ETI provide a systems biology perspective on plant immunity and emphasize coordination among network modules to establish a robust immune response.
Plants have evolved a sophisticated immune system that enables each cell to monitor every possible destructive invasion by microbe and to mount an appropriate defense response when necessary (Spoel and Dong, 2012). Pattern-triggered immunity (PTI) and effector-triggered immunity (ETI) are two primary immune defense modes in plants (Jones and Dangl, 2006). In PTI, the immune response is triggered when pattern-recognition receptors detect specific molecular patterns from pathogens, also known as pathogen-associated molecular patterns (PAMPs). PAMPs, such as bacterial flagellin, bacterial ELONGATION FACTOR TU (EF-Tu), lipopolysaccharides, and peptidoglycans, are essential components of many pathogens but are lacking in plant cells. Thus, PAMPs are ideal molecular markers for detecting pathogen invasion. Pathogens can secrete virulence proteins called effectors into host cells to subvert the PTI process. Effectors usually mimic the biochemical function of eukaryotic enzymes, such as phosphatases, proteases, and ubiquitin ligases, to efficiently block immune signaling pathways at a low dosage (Abramovitch et al., 2006). ETI coevolved to monitor the presence of pathogen effectors (Chisholm et al., 2006; Jones and Dangl, 2006). In contrast to PAMPs, effectors are directly or indirectly detected by plant resistant (R) proteins in ETI, usually accompanied by a hypersensitive cell death response. After the initiation of PTI or ETI, extensive transcriptional reprogramming occurs, one of the most remarkable phenomena in the plant immune response (Moore et al., 2011).
In both PTI and ETI, the downstream immune response must be tightly controlled by gene networks to balance resource allocation between normal growth and an effective immune response to inhibit pathogen colonization. However, the difference in the downstream immune responses of PTI and ETI remain largely unknown (Dodds and Rathjen, 2010). Genome-wide microarray studies have demonstrated that differences in the Arabidopsis (Arabidopsis thaliana) transcriptome between PTI and ETI are largely quantitative (Tao et al., 2003; Truman et al., 2006). It has been proposed that ETI is faster and stronger than PTI and that the signaling network components of PTI and ETI are similar (Thomma et al., 2011). However, some studies have also suggested that distinct defense regulation mechanisms exist between PTI and ETI (He et al., 2006; Gao et al., 2013), while cross regulation between PTI and ETI has also been observed (Zhang et al., 2012).
Many immune-related genes involved in PTI or ETI have been identified using genetic screens in combination with biochemistry and molecular biology methods. For example, the Arabidopsis NONEXPRESSOR PATHOGENESIS-RELATED GENES1 (NPR1) gene is a master regulator of immune response mediated by salicylic acid (SA; Dong, 2004). NPR1 is required for effective defense in PTI and ETI and is also a crucial molecular switch for the regulation of cell death in ETI. ENHANCED DISEASE SUSCEPTIBILITY1 (EDS1), a positive regulator of basal resistance, is required for the triggering of ETI by Toll-Interleukin-1 (Toll-IL-1) receptor-nucleotide binding-leucine-rich repeat type R proteins (Wiermer et al., 2005). Among transcription factors (TFs), WRKY family members play pivotal roles (Pandey and Somssich, 2009). A heat shock factor-like TF, TRANSLOCON1-BINDING TRANSCRIPTION FACTOR (TBF1), was recently identified as a major TF that controls transcriptional reprogramming in PTI and ETI to favor defense over normal growth (Pajerowska-Mukhtar et al., 2012). Several pioneering studies explored how robust immunity is achieved in PTI and ETI based on these well-known key immune-related genes (Tsuda et al., 2009; Sato et al., 2010; Naseem et al., 2012; Kim et al., 2014). For example, leveraging a DELAYED DEHISCENCE2 (dde2)/ETHYLENE INSENSITIVE2 (ein2)/PHYTOALEXIN DEFICIENT4 (pad4)/SALICYLIC ACID INDUCTION DEFICIENT2 (sid2)-quadruple Arabidopsis mutant, Tsuda et al. (2009) found that immune signaling pathways tend to be synergistic in PTI, but compensatory in ETI. The genes from different signaling pathways tend to positively interact to amplify immune signaling in PTI, whereas in ETI the failure of one signaling pathway can be compensated by other redundant signaling pathways (Tsuda et al., 2009; Dodds and Rathjen, 2010). In 2010, Sato et al. (2010) performed network modeling and proposed a sector switching model to explain the regulatory relationships among 22 Arabidopsis immune-related genes. In this model, negative regulatory relationships among signaling pathways in ETI were derived, which are favorable to the establishment of a robust ETI signaling network against pathogen effectors. For instance, the perturbation of one pathway caused by effectors can result in the switching on (i.e. high activation) of the other pathways (Sato et al., 2010). To examine hormone crosstalk in ETI and PTI, network modeling was used to analyze a phytohormone-centric regulatory network containing 105 nodes (Naseem et al., 2012). The aforementioned studies have provided invaluable insight into differences in immune regulation. However, due to the limited network coverage in these studies, a complete systemic understanding of how immune-related genes coordinate with each other within gene networks and collectively lead to different PTI and ETI phenotypes has not been reached (Dodds and Rathjen, 2010).
Because thousands of genes can be differentially expressed after an immune response is activated, routine analyses based merely on genome-wide gene expression profiles are challenging. Although simple enrichment analysis can provide abundant information regarding which pathways are dysregulated, the connections among dysregulated pathways are usually not apparent and are highly dependent on interpretation by researchers. As a result, researchers must analyze the identified pathways individually and may lose the global perspective in understanding how multiple pathways coordinate with each other and ultimately lead to different PTI and ETI phenotypes. Breakthroughs in modular cellular network analyses and machine learning methods can be very useful to dissect behaviors of the immune-related gene network. Conceptually, many studies have suggested that cellular networks are modular (Barabási and Oltvai, 2004; Qi and Ge, 2006) and can be decomposed into coupled functional units or modules. The genes within one module are usually coregulated to perform common functions and contain relatively more dense interconnections than genes in different modules. The modularity of cellular networks provides a feasible entry point to simultaneously analyze the complicated behaviors of many genes. This concept is helpful in understanding plant development (He et al., 2010; Bassel et al., 2011b), predicting gene functions (Heyndrickx and Vandepoele, 2012; Tzfadia et al., 2012), and comparing stress responses (Shaik and Ramakrishna, 2013). Technically, machine-learning algorithms are very good at extracting information from a large amount of data in an automated way. State-of-the-art machine-learning methods have been used to successfully identify stress-responsive genes (Ma et al., 2014; Shaik and Ramakrishna, 2014) and development-related gene associations (Bassel et al., 2011a) from large-scale plant gene expression data. Recently, Dutkowski and Ideker (2011) proposed a new machine-learning ranking algorithm called the network-guided forest (NGF). NGF was developed from Random Forest (RF; Breiman, 2001), a popular machine-learning algorithm that uses many slightly different decision trees to infer the relationship between input features and class labels. Because only a randomly selected subset of training samples and input features are used to build each decision tree, RF is robust to outliers and can also yield high prediction accuracy (Touw et al., 2013). In the NGF, the molecular network is further introduced into RF to guide the growth of each decision tree. For example, by jointly using gene expression states and molecular network information as input to build the classification model, NGF can identify more cancer susceptibility genes in cancer stratification compared with conventional methods that only consider gene expression differences (Dutkowski and Ideker, 2011).
In this study, we developed an integrative network analysis framework that uses a machine-learning algorithm and modular network analysis to investigate the shared and distinct organization of Arabidopsis gene networks in response to PTI and ETI. First, we assembled an integrated gene network by combining different types of gene association data. Using the PTI/ETI gene expression profiles and the integrated gene network as input, the NGF algorithm was further used to identify key genes/interactions involved in the immune response. Moreover, we conducted multiresolution network analyses to obtain a global view of the Arabidopsis immune response. At the individual gene/interaction level, we observed that the gene interactions involved in the immune response significantly tended to link different network modules, highlighting the importance of module coordination in plant defense. At the subnetwork level, we identified a densely connected subnetwork shared between PTI and ETI and confirmed the biological importance of the shared subnetwork in the immune response. At the whole network level, we used NGF-based gene set enrichment analysis (GSEA; Mootha et al., 2003) to further identify immune response-related network modules and compared the organization structures of these modules in PTI and ETI. Finally, we have made our results accessible to the scientific community through the development of a user-friendly interactive network Web browser.
RESULTS
We designed an integrative multistep network analysis framework to dissect the complex immune response in Arabidopsis (see Fig. 1 for an overview). Herein, we present the assembly of the integrated gene network, the construction of the NGF model, and our major findings at three network levels (individual gene/interaction, subnetwork, and the whole network).
Figure 1.

Methodological overview of the integrative network analyses. The analyses consisted of five steps (from left to right). First, multiple genomic data were collected to assembly an integrated gene network with approximately 11,000 nodes and approximately 64,000 edges. Second, an NGF algorithm was used to combine gene expression data with the gene network to rank the importance of the network components (genes and interactions) in PTI and ETI. Third, a shared subnetwork between PTI and ETI was identified and validated using independent data. The global network organizations of PTI and ETI were compared using modular network models. An interactive network Web browser was developed for the convenience of the scientific community. AGI, Arabidopsis Genome Initiative number.
Assembly of an Integrated Gene Network of Arabidopsis
We assembled an integrated gene network by combining four types of gene association data (Supplemental Fig. S1), including (1) experimental protein-protein interactions (PPIs), (2) confirmed protein-DNA binding data, (3) TF and target coexpression relationships inferred from expression profiles under two physiological conditions (development and abiotic stress), and (4) TF and target chromatin comodification (Marbach et al., 2012) information inferred from genome-wide chromatin immunoprecipitation (ChIP)-chip experiments of 13 modification types (Supplemental Table S1). We selected these data because they are representative of and highly complementary to gene regulation relationships (Walhout, 2006; Marbach et al., 2012). To reduce false positives from these high-throughput data, we adopted a series of scoring strategies to remove unreliable gene association data (for more details, see “Materials and Methods” and Supplemental Figs. S1–S5).
Regarding the experimental PPI data, the reliability of each PPI was measured using the scoring scheme introduced by Lage et al. (2007), in which the network topology information surrounding the interaction, the number of publications supporting the interaction, and the experimental scale of PPI determination are combined to compute a probabilistic confidence score. Seventy-seven PPIs with confidence scores less than 0.20 were removed (Supplemental Figs. S1 and S2). Because gene association pairs tend to be involved in a common biological process, the gene ontology (GO) annotation similarity of gene pairs can also provide indirect evidence of the reliability of PPIs. The retained PPI data yielded an average GO annotation similarity score of 0.158, which is significantly higher than that of a random network (Supplemental Fig. S3). The average GO annotation similarity of retained PPIs can stably increase with the improvement of confidence score cutoff (Supplemental Fig. S4). However, the number of retained PPIs also decreases considerably when improving the cutoff (Supplemental Fig. S4). Therefore, it is difficult to select an optimal cutoff. Considering that experimental PPI data are relatively insufficient in Arabidopsis, we only used the cutoff of 0.20 to remove PPIs with very low reliability scores.
We inferred three gene networks from gene expression or chromatin modification data. First, two gene expression datasets collected during plant development (Schmid et al., 2005) and the abiotic stress response (Kilian et al., 2007) were used to construct two coexpression networks. The experimental conditions of the two data sets represent two major themes in the life of plants (development and adaptation to the environment). The diverse treatments and rich data (more than 200 profiles for each data set) also make these data sets suitable for inferring coexpression relationships. Second, we constructed a gene chromatin comodification network because particular chromatin states are preferentially associated with gene classes involved in development and the response to pathogens (Luo and Lam, 2010). To construct the network, we developed a modification pattern similarity measurement to assess whether two genes have similar chromatin states. Using the average GO annotation similarity score of the filtered PPI data as a reference, we further filtered the gene interactions in the three networks to ensure that the average GO annotation similarity score of the remaining interactions in these three networks was equal to 0.158. Finally, we only retained inferred interactions in which at least one gene was a TF.
We did not filter the experimentally confirmed protein-DNA binding data. The above refinement yielded five different networks, and the union set of these five networks was computed to generate an integrated gene network encompassing approximately 50% of the Arabidopsis genome (11,155 nodes [including 1,090 TFs] and 64,281 edges). To combine the network data with immune response expression profiles, we further removed from the network those genes that were not designed on the Affymetrix Arabidopsis ATH1 Genome Array. The retained network (AraONE; Supplemental Table S2) used by NGF included 9,862 genes and 57,487 interactions. The overlaps among the five networks are presented in Supplemental Figure S5.
Compared to the pure PPI network, AraONE has better genome coverage and reflects multiple gene associations in Arabidopsis. Although false positive interactions may inevitably be present in AraONE, our benchmark analysis demonstrates that the average GO annotation similarity of AraONE is significantly higher than that of a random gene interaction network (Supplemental Fig. S3). Therefore, we argue that AraONE is suitable for further network analyses.
Ranking Immune-Related Genes and Their Interactions Using the NGF Algorithm
NGF uses many slightly different network-guided decision trees that combine gene expression and gene networks simultaneously to yield an accurate classification model. The NGF tree structure is suitable for modeling complex gene expression combinatorial logic, such as synergistic or antagonistic effects. NGF assigns an importance score (IS) for each gene/interaction according to its contribution to improving the model classification accuracy.
We constructed two NGF models to classify PTI versus the control (PTI group) and ETI versus the control (ETI group). To train the NGF models, we compiled three Arabidopsis gene mRNA microarray data sets corresponding to three different immune response scenarios (PTI, ETI, and control) from multiple public databases (for additional details about the microarray data sets and model building procedures, see “Materials and Methods” and Supplemental Table S3). To evaluate and refine the NGF results, we conducted a series of computational experiments.
First, we assessed the prediction accuracy of NGF through a 10-fold cross-validation test. Accuracy, which represents the proportion of correctly predicted cases under a default cutoff, and the area under the receiver operating characteristics curve (AUC), which reflects the average accuracy of the classification models under different cutoffs, were used. As shown in Table I, NGF was highly accurate (accuracy = approximately 0.86 and AUC = approximately 0.94) for both the PTI and ETI groups. The performance was also validated on two independent data sets (Supplemental Table S4). Considering the randomness of NGF, we further examined the reproducibility of the NGF ranking results. Accordingly, we built 10 more NGF models with the same settings for the PTI and ETI groups, respectively, and performed a pairwise comparison between the models in the same group. More than 80% of the genes were reproducibly identified as significantly important immune-related genes at multiple scales in both the PTI and ETI groups (Supplemental Fig. S6). For gene interactions, more than 80% and approximately 70% were reproducible for the PTI and ETI groups, respectively (Supplemental Fig. S6). The relatively low reproducibility of the ETI group may be attributable to less training sample data. However, given the large number of gene interactions in AraONE, the NGF interaction ranking results are very stable.
Table I. Prediction performance of NGFa.
| NGF Model | Accuracy | AUC |
|---|---|---|
| PTI versus control | 0.859 ± 0.012 | 0.942 ± 0.008 |
| ETI versus control | 0.857 ± 0.014 | 0.934 ± 0.011 |
The number of trees is 100.
Finally, we permuted the training data labels and rebuilt 100 null hypothesis models. We compared real ISs with the ISs from null hypothesis by Student’s t test. Only those genes and interactions with statistically significant ISs were subjected to further analysis (see “Materials and Methods”). Based on these computational tests and the statistical analysis, we are confident of the reliability of the NGF ranking results.
For PTI and ETI group, there were 1,856 and 1,843 genes, respectively, identified as significantly important (Bonferroni correction, Student’s t test, P < 0.05; Supplemental Table S5). We list the top 30 genes with the highest ISs in Tables II and III (Supplemental Table S6) for further analyses. Of the top 30 genes, our approach successfully identified 12 and 14 known immune-related genes for PTI and ETI, respectively. We compared the NGF gene-ranking results with differentially expressed genes (DEGs). We defined the differential expression change of a gene as the absolute value of the difference of its average expression levels under two conditions (PTI/ETI versus control). Many of the top 30 DEGs are also involved in plant immunity (Supplemental Table S7). We observed that the top-ranked genes based on NGF are prone to differential expression in either PTI or ETI (Fig. 2, A and B). However, highly differential expression of a gene is not necessary to obtain a high rank in the NGF results. As shown in Figure 2, C and D, only two genes of the top 30 DEGs are ranked as the top 30 significantly important genes in the NGF. For both the PTI and ETI groups, most of the top 30 DEGs have a low network degree (≤2) in AraONE (Supplemental Table S7). This low degree might make these DEGs more difficult to be introduced to decision trees. By contrast, some immune-related genes with moderate expression changes were assigned a high rank, such as the calcium-dependent protein kinase (CPK) gene CPK1 (Coca and San Segundo, 2010) in the PTI group and NPR1 in the ETI group, which might be neglected in traditional gene differential expression analyses. Closer inspection of these two genes in the network revealed that CPK1 and NPR1 are highly connected and that many of their neighbors are DEGs. In fact, these DEGs also include known immune-related genes, such as the NPR1 neighbors GRX480, NON-INDUCIBLE IMMUNITY1 INTERACTING1, TGACG MOTIF-BINDING FACTOR4, and WRKY25, and the CPK1 neighbor LYSINE HISTIDINE TRANSPORTER1 (Supplemental Fig. S7). Although CPK1 and NPR1 exhibit only moderate changes in expression, the NGF algorithm combines their expression changes and network topologic features to identify them as immune-related genes among thousands of candidates.
Table II. Top 30 genes in PTI versus control.
| Arabidopsis Genome Initiative No. | Name | Function in Plant Immunitya | NGF IS |
|---|---|---|---|
| At1g68520 | B-BOX DOMAIN PROTEIN14 (BBX14) | SA-mediated signaling pathway | 0.660 |
| At2g02450 | LOV1 | Unknown | 0.573 |
| At4g23810 | WRKY53 | Coordinates with WRKY46 in basal resistance | 0.453 |
| At4g18880 | HEAT SHOCK TRANSCRIPTION FACTORA4A | Response to chitin; substrate of the MITOGEN-ACTIVATED PROTEIN KINASE3 (MPK3)/MPK6 signaling | 0.382 |
| At4g01090 | Unknown | 0.379 | |
| At1g72610 | GERMIN-LIKE PROTEIN GLP1 | Unknown | 0.377 |
| At2g24570 | WRKY17 | Negative regulator of basal resistance | 0.361 |
| At5g18150 | Unknown | 0.346 | |
| At1g14370 | AVRPPHB SUSCEPTIBLE1 -LIKE2 (PBL2) | Cleaved by effector protein AvrPphB; pbl2 mutant showed significantly reduced callose deposition in 22-amino acid motif of the bacterial flagellin (flg22) and N-term of elongation factor with the first 18 amino acid residues treatment | 0.340 |
| At1g69770 | CHROMOMETHYLASE3 | Involved in defense response-related DNA methylation | 0.303 |
| At3g26085 | Unknown | 0.276 | |
| At3g46780 | PLASTID TRANSCRIPTIONALLY ACTIVE16 | Unknown | 0.275 |
| At5g04870 | CPK1 | Control onset of cell death triggered by RESISTANT TO P. SYRINGAE2 and RESISTANCE TO P. SYRINGAE PV MACULICOLA1 (RPM1) | 0.271 |
| At2g38470 | WRKY33 | Key transcriptional regulator of and hormonal and metabolic responses to necrotroph | 0.268 |
| At1g34310 | AUXIN RESPONSE FACTOR12 | Unknown | 0.259 |
| At3g17700 | CYCLIC NUCLEOTIDE GATED CHANNEL20 | Regulation of plant-type hypersensitive response | 0.257 |
| At2g29100 | GLU RECEPTOR2.9 | Unknown | 0.255 |
| At5g05190 | Unknown | 0.255 | |
| At4g02410 | LECTIN-LIKE PROTEIN KINASE1 | Confers Arabidopsis pathogen resistance when overexpressed | 0.250 |
| At2g33500 | BBX12 | Unknown | 0.247 |
| At5g25930 | Unknown | 0.245 | |
| At4g09570 | CPK4 | Directly phosphorylates WRKY8/WRKY28/WRKY48 | 0.244 |
| At4g14540 | NUCLEAR FACTOR Y, SUBUNIT B3 | Unknown | 0.243 |
| At2g30250 | WRKY25 | Negative regulator of SA-mediated defense responses | 0.238 |
| At3g59060 | PHYTOCHROME INTERACTING FACTOR 3-LIKE6 | Unknown | 0.235 |
| At3g07040 | RPM1 | Resistance (R) gene | 0.233 |
| At1g35420 | Unknown | 0.229 | |
| At5g11060 | KNOTTED1-LIKE HOMEOBOX GENE4 | Unknown | 0.228 |
| At3g55250 | PIGMENT DEFECTIVE329 | Unknown | 0.224 |
| At1g75460 | Unknown | 0.222 |
Complete functional annotation of each gene and the corresponding references are provided in Supplemental Table S6.
Table III. Top 30 genes in ETI versus control.
| Arabidopsis Genome Initiative No. | Name | Function in Plant Immunitya | NGF IS |
|---|---|---|---|
| At3g44720 | AROGENATE DEHYDRATASE4 | Regulation of the plant-type hypersensitive response | 0.275 |
| At3g57150 | NAP57 | Unknown | 0.270 |
| At5g46760 | MYC2-RELATED BASIC HELIX-LOOP-HELIX TRANSCRIPTION FACTOR | Mediates the JA response | 0.215 |
| At1g63100 | Unknown | 0.212 | |
| At2g02450 | LOV1 | Unknown | 0.212 |
| At2g13650 | GOLGI NUCLEOTIDE SUGAR TRANSPORTER1 (GONST1) | gonst1 plants have a dwarfed phenotype and a constitutive hypersensitive response with elevated SA levels | 0.199 |
| At1g59590 | ZCF37 | Unknown | 0.197 |
| At2g30250 | WRKY25 | Negative regulator of SA-mediated defense responses | 0.174 |
| At1g14370 | PBL2 | Cleaved by effector protein AvrPphB; pbl2 mutant exhibits significantly reduced callose deposition upon flg22 and N-term of elongation factor with the first 18 amino acid residues treatment | 0.173 |
| At5g52010 | Unknown | 0.173 | |
| At3g22780 | CHINESE FOR “UGLY” (TSO1) | Unknown | 0.169 |
| At3g59220 | PIRIN1 | Unknown | 0.165 |
| At4g18880 | HEAT SHOCK TRANSCRIPTION FACTOR A4A | Response to chitin; substrate of MPK3/MPK6 signaling | 0.160 |
| At3g56400 | WRKY70 | Convergence between SA and JA signaling | 0.158 |
| At1g67690 | Unknown | 0.155 | |
| At2g38470 | WRKY33 | Key transcriptional regulator of hormonal and metabolic responses to necrotroph | 0.149 |
| At1g31190 | MYO-INOSITOL MONOPHOSPHATASE LIKE1 | Unknown | 0.149 |
| At5g20950 | Unknown | 0.147 | |
| At4g19030 | NODULATION26-LIKE MAJOR INTRINSIC PROTEIN1 | Regulation of the defense response | 0.146 |
| At1g71260 | WHY2 | Defense response | 0.146 |
| At1g64280 | NPR1 | Master regulator of SA-mediated systemic acquired resistance | 0.145 |
| At3g16870 | GATA TRANSCRIPTION FACTOR17 | Unknown | 0.139 |
| At1g29120 | Unknown | 0.138 | |
| At1g36310 | Unknown | 0.137 | |
| At1g17440 | CYTOKININ-HYPERSENSITIVE1, ENHANCED ETHYLENE RESPONSE4 | Unknown | 0.130 |
| At3g48090 | EDS1 | Indispensable for immunity mediated by Toll-IL-1 receptor-nucleotide binding-Leu-rich repeat receptors; acts redundantly with SA to regulate R gene-mediated signaling | 0.130 |
| At4g29810 | MITOGEN-ACTIVATED PROTEIN KINASE KINASE1 | Negative regulation of the defense response | 0.130 |
| At1g28480 | GLUTAREDOXIN (GRX480) | Negative regulation of the defense response | 0.129 |
| At3g02910 | Unknown | 0.127 | |
| At3g10640 | VACUOLAR PROTEIN SORTING60.1 | Unknown | 0.123 |
Complete functional annotation of each gene and the corresponding references are provided in Supplemental Table S6.
Figure 2.

Comparison of NGF with differential expression analysis and characterization of the topological properties of significantly important gene interactions. A, Change (absolute value) of gene expression in the PTI group. B, Change (absolute value) of gene expression in the ETI group. C, NGF ISs of genes in the PTI group. D, NGF ISs of genes in the ETI group. The top 30 DEGs (green) and the top 30 genes with the highest NGF ISs (purple) are shown. The genes included in the top 30 genes of both the DEGs and the NGF results are indicated in orange. Overall, the top 30 genes ranked by NGF tend to be differentially expressed, but some immune-related genes even with moderate expression alterations, such as CPK1 and NPR1 (red), are also discriminated from the noisy background as a top 30 gene by NGF. The genes are ordered along the x axis according to their Arabidopsis Genome Initiative (AGI) numbers. In both the PTI (E) and ETI (F) groups, the significantly important gene interactions identified by NGF tend to link different network modules. This phenomenon is more obvious when the IS cutoff is increased.
In addition to assigning an IS for each gene, one important feature of the NGF is that it can also yield an IS for each interaction in the network. In total, 5,466 and 6,342 significantly important interactions (P < 0.05, Bonferroni correction, Student’s t test; Supplemental Table S5) corresponding to 3,304 and 3,629 genes were identified by NGF from the PTI and ETI group, respectively. Because most functional annotation systems are gene-centric, the biological meaning of the identified interactions is difficult to interpret. Because previous studies have indicated that interactions connecting different cellular network modules tend to play an important role in specific biological processes (He et al., 2010; Bassel et al., 2011b), we also examined the distribution of the identified interactions in the context of network modules. We first applied the Markov cluster (MCL) algorithm (Enright et al., 2002) to detect densely connected network modules in AraONE. A total of 633 modules (Supplemental Table S8) were identified, 47% of which contained more than five genes. Second, the intermodule to intramodule interaction ratio (MIR) of significantly important interactions was calculated. Interactions in which the two genes belong to the same module were denoted intramodule interactions; interactions in which the two genes belong to different modules were denoted intermodule interactions. The MIR of a set of interactions was then defined as the number of intermodule interactions divided by the number of intramodule interactions. As a control, we randomly sampled the same number of interactions identified by NGF from AraONE. This procedure was repeated 1,000 times. The MIRs for the PTI and ETI groups were much larger than those of the corresponding control group (0.667 versus 0.344 and 0.587 versus 0.344, respectively; P < 10–100, Student’s t test; Fig. 2, E and F), and the MIR values increased with a more stringent IS cutoff (Fig. 2, E and F). This observation indicates that intermodule interactions were assigned relatively high ISs, suggesting that genes that distinguish the immune response and control samples usually came from multiple network modules instead of being enriched within one module. This observation may partly reflect the widespread gene expression changes in the plant immune response, which involves multiple biological processes (Wang et al., 2011b). The plant immunity-related functional roles of the significantly important intermodule interactions (Supplemental Table S5) merit further experimental validation.
The Shared Subnetwork between PTI and ETI Is Enriched with Effector Targets
To explore the shared network components between PTI and ETI, we computed the intersection of significantly important interactions in the two processes. The resulting subnetwork includes 1,156 genes and 1,289 interactions (Fig. 3A), of which 43.9% (566/1,289), 1.5% (20/1,289), 0.5% (6/1,289), 52.0% (671/1,289), and 1.2% (16/1,289) were exclusively from PPI data, protein-DNA binding data, gene chromatin comodification data, developmental gene coexpression data, and abiotic response gene coexpression data, respectively. Nineteen of the 181 TFs in the subnetwork belong to the WRKY family. Consistent with the MIR analysis, many interactions in this subnetwork tended to link modules (observed: 495/1,289; expected: 312/1,289; P = 2.20 × 10⁻¹⁶, Student’s t test). Rather than forming many interrupted small subgraphs, most genes are connected to a large subgraph encompassing 946 genes and 1,149 interactions (Supplemental Fig. S8). We used a new gene function visualization method called Enrichment Map (Merico et al., 2010) to characterize the functional distribution of genes in the shared subnetwork (Fig. 3B). In the Enrichment Map, each node represents a gene set corresponding to a GO term enriched in the subnetwork, and each weighted edge represents the overlap between two gene sets. We observed that stress response and development were two major themes on the map, and regulations of defense and development were linked by the term negative regulation of cellular process. These two themes remained prominent even after the interactions inferred from the coexpression data were removed (Supplemental Fig. S9).
Figure 3.

The shared subnetwork between PTI and ETI. A, The subnetwork is arranged in traditional pathway style using the Cerebral plugin according to the confirmed subcellular location information of gene products from SUBA3. Forty-nine putative effector targets (red) are enriched in this subnetwork (P = 6.44 × 10⁻¹⁵, hypergeometric test), and 19 WRKY family TFs (green triangles) are included. B, Enrichment map of the shared subnetwork. Each node represents a gene set corresponding to a GO term enriched in the shared subnetwork, and each weighted edge represents the overlap between two gene sets. The node size is proportional to the number of genes that belong to this GO term. The width of the edge is proportional to the size of the overlapping gene sets. ET, Ethylene; ABA, abscisic acid.
We further analyzed the distribution of SA response genes and type III effector target genes in this subnetwork. SA is a primary plant hormone in resistance to infection by biotrophic pathogens and participates in both PTI and ETI. To examine the distribution of SA response genes in this subnetwork, we used an independent data set generated by Wang et al. (2006), in which 2,288 genes were identified using a genome-wide microarray after 24 h of SA treatment on Arabidopsis. Note that the microarray data were not used to construct NGF models. A total of 1,303 SA response genes could be mapped on AraONE, 322 of which were included in the shared subnetwork (P < 10–100, hypergeometric test), indicating that this shared subnetwork is significantly enriched in the SA response. Moreover, we also downloaded 165 putative effector targets identified by Mukhtar et al. (2011) and mapped them on AraONE. These targets were defined as Arabidopsis proteins that physically interact with pathogen effectors. A total of 128 target genes could be mapped on AraONE, 49 of which were observed in the shared subnetwork (Supplemental Table S9; Supplemental Text S1), indicating that effector targets are also enriched in the subnetwork (P = 6.44 × 10⁻¹⁵, hypergeometric test). Taken together, we observed that the subnetwork is highly enriched in the SA response and also tend to include pathogen effector targets. Therefore, this subnetwork may represent an important part of the plant immune network shared by PTI and ETI. However, the complete functional role of this subnetwork in plant immunity remains to be established through additional experiments.
Modular Network Models of PTI and ETI
To delineate the global architecture of the gene networks activated in PTI and ETI, we applied GSEA to identify immune response-related network modules and further constructed two modular network models. GSEA is a nonparametric rank-based method in which information from all members of a gene set is combined as a whole to improve the signal-to-noise ratio. One prominent advantage of GSEA is that it can detect modest but significantly coordinated changes in a gene set that may be missed by individual gene-based analyses, such as a Student’s t test (Mootha et al., 2003). GSEA was originally introduced as a method to identify dysregulated pathways in microarray experiments but can also be used with other data types with the same structure as gene expression profiles. Here, we performed GSEA by replacing gene expression changes with NGF scores (i.e. NGF-based GSEA). Using the 100 null hypothesis models as the background, we identified network modules significantly enriched in genes with high ISs in the PTI or ETI groups (for details, see “Materials and Methods”). A total of 62 and 52 modules were identified by NGF-based GSEA in the PTI and ETI groups (permutation test, empirical P < 0.05; Supplemental Table S10), respectively, and 25 modules were common between the two groups. We further conducted GO functional annotations of these modules using Cytoscape plugin BiNGO (Maere et al., 2005; Saito et al., 2012). For convenience, we manually classified these modules into five functional categories according to their GO term annotations: signal transduction, transcription regulation, hormone, defense response, and growth or development. Those modules without any category assignment or GO enrichment were omitted from further analyses. Finally, we obtained 18 PTI-specific modules, 14 ETI-specific modules, and 19 common modules (Supplemental Table S11).
Moreover, we computed average logic state scores for the genes in each module and interactions between any two connected modules to characterize the combination patterns of the gene expression changes in immune response. In contrast to ISs, which were used to represent the usefulness of a gene or interaction in successfully distinguishing the immune response and control conditions, logic state scores reflect the direction of gene expression change in the immune response relative to control conditions. The logic state score of a gene was derived from the decision rules learned by NGF models. A positive/negative logic state score for a gene indicates that the gene state is up-regulation/down-regulation for the majority of decision rules ended as immune response. The absolute value of this score is proportional to the number of decision rules supporting the gene state. Moreover, we also computed the logic state scores of interactions that link different modules. For an interaction, a positive logic state score means the logic states of two interacting genes are identical, while a negative interaction logic score denoted different gene logic states between two interacting genes (for more details, see “Materials and Methods” ).
The resulting modular network modes of PTI and ETI are shown in Figure 4. By observing these two modular network models, we found that protein phosphorylation modules were the most highly connected in both the PTI and ETI models, suggesting that protein phosphorylation is a core biological process linking other functional modules in the plant immune response.
Figure 4.

Modular network models of PTI and ETI. Each node represents a network module identified by NGF-based GSEA. The circle nodes are modules common to the PTI and ETI models, and the triangle nodes are modules that are specific to the corresponding models. The width of the module interaction is proportional to the average interaction IS as assigned by NGF. The modules and interactions are colored according to the average logic state score. The modules are presented according to five functional categories. GTPase, GTP hydrolase. The detailed gene composition of the modules and their interactions are available at http://systbio.cau.edu.cn/pinet/home.php.
Closer scrutiny of the substructures of these two models that only include the modules of signal transduction and defense response categories yielded an unexpected finding. In PTI, defense response modules appear to be densely linked by a central protein phosphorylation module, resulting in a cohesive clique with prevalent positive logic interactions (Fig. 5A). By contrast, defense response modules in ETI are divided into multiple relatively independent parts and contain only a few links through the central protein phosphorylation module (Fig. 5B). The advantage of such module organization in ETI is that the perturbation of one module affects only the activity of the neighboring modules instead of spreading to the all defense response modules. As proposed by Tsuda et al. (2009) based on genetic analysis, the signaling pathways in PTI tend to interact synergistically, whereas the signaling pathways in ETI tend to be compensatory. Our findings are in line with the observations of Tsuda et al. (2009) and Tsuda and Katagiri (2010).
Figure 5.

Organization of defense response modules in PTI and ETI. A, The defense response modules are organized into a compact clique with signal transduction modules in PTI. Positive combinations of logic states are prevalent among the modules. B, Defense response modules are relatively independent of each other, and different parts of network models are mainly linked by a protein phosphorylation module. GTPase, GTP hydrolase. The color scheme and the meaning of each shape are the same as in Figure 4.
Module M63 Suggests a Potential Role of Chromatin Dynamics in ETI
We observed a highly connected module (M63) specific to the ETI model with an NGF-based GSEA empirical P value of 2.77 × 10⁻³ (permutation test, empirical P value = 0.730 in PTI). M63 contains 1,030 genes and is the largest module in AraONE. Although the most significant GO term annotated by BiNGO was gene expression, other significant terms such as DNA conformation change, nucleosome assembly, ribonucleoprotein complex biogenesis, chromatin modification, DNA replication, and DNA repair were also obtained. To summarize the biological themes in M63, we submitted M63 to the DAVID Web server (Huang et al., 2009) to cluster redundant GO annotations. Most of the enriched themes were related to chromatin configuration (Supplemental Fig. S10), a highly relevant process for gene expression that is an intrinsic component of plant-bacteria interactions (Ma et al., 2011). Considering the large size of M63, we further decomposed this module into four submodules (Supplemental Fig. S11). Most of the genes in the largest submodule (M63.1, size = 358) were connected to pseudouridine synthase NAP57, Whirly family protein ATWHY2, HISTONE DEACETYLASE A3 (HDA3), and HISTONE DEACETYLASE 2C (HD2C). NAP57 is a component of telomerase ribonucleoprotein and is required for telomere maintenance (Kannan et al., 2008). ATWHY2 is a mitochondrial protein that is involved in organelle genome repair (Cappadocia et al., 2010). HDA3 and HD2C are two histone deacetylases that are involved in development and the stress response (Wu et al., 2000; Luo et al., 2012). Consistent with the NGF-based GSEA analysis, the four genes were distributed at the top of the NGF rank list. NAP57 and ATWHY2 were included in the top 30 genes by NGF in the ETI group (Table II). HDA3 and HD2C were ranked as the 63rd and 47th genes. However, the functions of these genes in plant immunity remain unclear.
We further compared the average closeness centrality (CC) of the genes in M63 with the genes in the whole network. CC is a network topological parameter that measures if a node is near the center of the entire network. The average M63 CC values were significantly higher than that of the whole network (P = 9.41 × 10–324, Student’s t test; Supplemental Fig. S12). Therefore, M63 gene activities could quickly influence the entire network. Moreover, we observed a recently identified epigenetic regulator in M63, ELONGATOR COMPLEX SUBUNIT2, that is essential for rapid transcriptional reprogramming in ETI (Wang et al., 2013). Taken together, M63 implies a potential role of chromatin dynamics in ETI, although further validation is required.
A Web Tool to Interactively Explore Modular Network Models
To facilitate the exploration of these network models by the scientific community, we developed a user-friendly interactive network Web browser (http://systbio.cau.edu.cn/pinet/home.php) based on the network visualization framework sigma.js (http://sigmajs.org). This portal includes detailed gene composition information for each module from two modular network models as well as the shared subnetwork identified using NGF.
DISCUSSION
PTI and ETI are two major types of plant immunity; the dissection of their shared and distinct aspects is valuable for further understanding the evolution of plant immunity and can provide important insight for breeding new generations of disease-resistant crops. In this study, we used a network-based analysis framework and the machine-learning algorithm NGF to integrate heterogeneous but complementary high-throughput genomics data to gain a systems-level understanding of how different parts of the plant immune network coordinate with each other to lead to specific phenotypes.
NGF Can Effectively Combine Gene Network and Expression Cues to Pinpoint Immune-Related Genes
We used NGF to assess the importance of genes and interactions in the specific immune response. By converting the selection of immune-related genes into a task to classify the conditions of the expression profiles, NGF automatically identified immune-related genes, and it reveals advantages over some existing methods used in plant systems biology. Compared with other differential expression analyses based on machine-learning methods (Shaik and Ramakrishna, 2014), the major innovation of NGF is that it incorporates the gene network as a priori knowledge to effectively narrow the hypothesis space of candidate genes. In contrast to network-based methods that rely on known functional genes to discover new candidates (Lee et al., 2010; Ma et al., 2014), NGF can be regarded as a de novo gene discovery algorithm, which is particularly useful when only few genes involved in the biological process of interest are known.
Many significantly important genes identified by NGF are known immune-related genes. For example, multiple WRKY family TFs were considered significantly important genes by the NGF in the PTI group (Table II), including WRKY53, WRKY17, WRKY33, and WRKY25. WRKY53 was first identified as a senescence-associated gene and subsequently screened out as a member of the systemic acquired resistance signaling network (Hinderhofer and Zentgraf, 2001; Wang et al., 2006). This gene can interact with the jasmonic acid (JA)-inducible protein EPITHIOSPECIFYING SENESCENCE REGULATOR to mediate negative crosstalk between pathogen resistance and senescence (Miao and Zentgraf, 2007). Recent genetic analysis has suggested that WRKY53 positively regulates basal resistance by coordinating with WRKY70 and WRKY46 (Hu et al., 2012). By contrast, WRKY17, WRKY33, and WRKY25 are negative regulators of the defense response to Pseudomonas syringae (Journot-Catalino et al., 2006; Zheng et al., 2006, 2007). CPK1 and CPK4 are also ranked in the top 30 significantly important immune-related genes in the PTI group. A loss-of-function mutation of CPK1 increases the susceptibility of Arabidopsis to pathogen infection (Coca and San Segundo, 2010). CPK4 has been identified as a key positive component in initial PTI signaling to flg22. This protein directly phosphorylates WRKY8/WRKY28/WRKY48 (Gao et al., 2013). In the ETI group, NPR1 and EDS1 were identified by NGF as the 20th and 25th most significantly important genes, respectively. WRKY70, a convergence node for JA-mediated and SA-mediated signals in plant defense (Li et al., 2004), is also included in the list for the ETI group.
Several of the top-ranked genes that have not previously been related to the plant immune response may be candidates for further experimental validation. For example, LONG VEGETATIVE PHASE1 (LOV1; At2g02450) was ranked as one of the top 30 significantly important immune-related genes in both the PTI and ETI groups. LOV1 belongs to the NAC (for no apical meristem [NAM], Arabidopsis transcription activation factor1-2 [ATAF1-2], and cup-shaped cotyledon2 [CUC2]) TF family, of which some members have been found to be involved in the defense response to pathogen infection (Bu et al., 2008). LOV1 is a master regulator of flowering and cold response (Yoo et al., 2007), and its overexpression in switchgrass (Panicum virgatum) induces alterations lignin content and cell wall composition (Xu et al., 2012). Plant development and innate immunity are closely linked, and previous studies have uncovered several genes that can regulate both flowering time and plant immunity, including HOPW1-1-INTERACTING3, NPR1, and Plant U-box protein13 (Wang et al., 2011a; Li et al., 2012). Therefore, we infer that LOV1 is an immune-related candidate gene that warrants further characterization. Taken together, these results demonstrate the power of NGF for identifying key immune-related genes. Given the increasing availability of genome, proteome, and interactome data, we expect that NGF will be a useful tool for modern plant research.
Identification of a Shared Subnetwork between PTI and ETI
By comparing the significantly important gene interactions between PTI and ETI, we identified a shared subnetwork enriched in effector targets. The subnetwork spans the extracellular region to the nucleus (Fig. 3A) and includes many key immune-related genes, such as NPR1, TBF1, PENETRATION3 (PEN3), BRASSINOSTEROID-INSENSITIVE1-ASSOCIATED RECEPTOR KINASE (BAK1), RPM1 INTERACTING PROTEIN4 (RIN4), and HOMOLOG OF BEE2 INTERACTING WITH IBH1 (HBI1). PEN3 is an ATP-binding cassette transporter that participates in defense against fungal and oomycete pathogens (Clay et al., 2009). BAK1 is a master positive regulator of PTI (Schwessinger et al., 2011). RIN4 is a known target of multiple effectors (Jones and Dangl, 2006). HBI1 is a basic helix-loop-helix TF that mediates the tradeoff between plant growth and the immune response (Fan et al., 2014). Functional enrichment analysis indicated that development and defense are the most prominent themes in this subnetwork. These two themes were also observed in a conserved Arabidopsis PPI network targeted by effectors of pathogens from three kingdoms of life (Weßling et al., 2014). This shared subnetwork between PTI and ETI might contribute to the coordination of different biological processes by linking together relatively separated network modules to promote plants change their state from development to defense. In addition, the enrichment of pathogen effector targets implies pathogens might exploit genes in the subnetwork to impede plant immunity. In addition to TBF1 and HBI1, we speculate that additional genes in this subnetwork might function as regulators of the tradeoff between development and defense.
A Relatively Independent Organization of Defense Modules Distinguishes ETI from PTI
Two modular network models were constructed to compare the global network architecture of PTI and ETI. Protein phosphorylation was observed as a core process linking other network modules in both the PTI and ETI models. Reversible protein phosphorylation is a crucial mechanism for regulating protein activity and is a basic step in protein kinase-mediated signal transduction. Signaling networks mediated by protein kinases have been characterized as essential components of plant innate immunity (Tena et al., 2011). For example, receptor protein kinases are the main pattern recognition receptors sensing diverse PAMPs in PTI. Mitogen-activated protein kinase cascades were identified as defense response-related signaling pathways that directly connect upstream immune signaling from receptor protein kinases and downstream transcriptional reprogramming. Moreover, the CPK signaling pathway was also recently discovered as another convergence point of the upstream plant immune response and regulates ETI-related programmed cell death (Gao et al., 2013). In addition to regulating the plant immune response, protein phosphorylation signaling networks participate widely in other plant physiological processes, including response to light, abiotic stress, hormone stimulus, and nutrient deprivation (Stone and Walker, 1995). Therefore, it is reasonable that protein phosphorylation nodes are located in the center of these two immune response models and link most of the modules from five functional categories (Fig. 4).
However, we observed defense response modules that were organized into a relatively independent network structure in ETI in contrast to the cohesive structure observed in PTI (Fig. 5). The distinct defense module organization in PTI and ETI may be attributable to different demands in plant-pathogen coevolution (Katagiri and Tsuda, 2010). PTI is triggered by conserved PAMPs, but many nonpathogenic microbes also carry PAMPs. Plants must carefully balance the induction of strong immune responses to clear pathogens and the prevention of undue immune responses triggered by nonpathogenic microbes. The interdependent relationships among defense modules in PTI would facilitate the gradual establishment of a strong immune response when there are persistent PAMP signals, which could prevent the side effects of frequently activated immune responses triggered by invasion signals from low-risk pathogen. By contrast, the recognition of effectors by resistance proteins is a high-risk signal that requires plants to quickly adopt defense responses. The relatively independent relationships among defense modules in ETI could be the result of evolutionary demands for a rapid, robust defense response.
Limitations and Future Work
Our results are only based on currently available data and must be interpreted with caution. First, our approach is limited by the availability and quality of the molecular network. For example, we used an ad hoc cutoff to filter experimental PPIs. Many gene interactions were inferred from genomic data without confirmation, and only approximately one-half of Arabidopsis coding genes are covered by our analysis. Imperfect data quality and insufficient data coverage can result in errors. For instance, interactions in AraONE most likely include both direct and indirect gene regulations because many of these interactions were inferred from omics data instead of direct and detailed biochemical evidence. Thus, it is very difficult to judge whether the network organizations observed here are true characteristics of the underlying gene regulatory architecture or reflections of gene functional associations in the immune response. Second, mRNA microarray data provide no information of the regulation of immune-related genes by posttranslational modifications. We believe that these problems will be alleviated gradually with the development of more reliable computational algorithms (Lee et al., 2010) and high-throughput experimental methods (Jones et al., 2014; Lumba et al., 2014). Finally, NGF only distinguishes plant immune responses as two conditions (on/off). However, the plant immune response is a highly dynamic process. Dynamic behavioral information about the immune regulatory network that could be crucial in discriminating PTI and ETI is inevitably lost in a simple binary discrimination of the plant immune response (Katagiri and Tsuda, 2010). Integrating time course expression data with module analysis will further decipher the regulators and the core regulatory network that drives different PTI and ETI expression kinetics.
MATERIALS AND METHODS
Data Collection and Processing
To assemble the integrated gene network, we: (1) compiled an experimental PPI network from BioGrid, IntAct, and The Arabidopsis Information Resource (TAIR) that included 6,640 proteins and 16,797 interactions; (2) downloaded protein-DNA interactions annotated as confirmed from AGRIS (http://arabidopsis.med.ohio-state.edu/) covering 720 genes and 762 interactions; (3) downloaded 237 and 298 preprocessed gene expression profiles from the Weigel World Web site (http://www.weigelworld.org/), which are related to Arabidopsis (Arabidopsis thaliana) development and the abiotic stress response, respectively; and (4) collected 13 types of chromatin modification data from ChIP-chip experiments (Supplemental Table S1).
The ChIP-chip data for 13 chromatin modification types were processed using TileMap (Ji and Wong, 2005) to detect modification regions in the genome. Similar to the work of Marbach et al. (2012), chromatin modification information was mapped to five regions of a gene to characterize the chromatin modification status. These five regions were the 1-kb upstream region of the transcriptional start site, the 5′ untranslated region (UTR), the coding region, the 3′ UTR, and the 1-kb downstream region of the 3′ UTR. For each type of chromatin modification, we constructed a five-dimensional binary vector to determine if the above five regions of a gene were modified. For example, [0, 1, 1, 0, 0] denotes that the 5′ UTR and coding region of a gene were modified by a specific chromatin modification. The binary vectors of the 13 types of modification were concatenated into a 65-dimensional vector to represent the chromatin status of a gene. Genome information was downloaded from TAIR (http://www.arabidopsis.org).
To implement the NGF algorithm, Arabidopsis gene mRNA microarray data (Affymetrix Arabidopsis ATH1 Genome Array) corresponding to three different immune response scenarios (PTI, ETI, and control) were downloaded from the National Center for Biotechnology Information Gene Expression Omnibus, European Bioinformatics Institute ArrayExpress, and TAIR. Regarding the PTI data, 69 gene expression profiles were collected from Arabidopsis after different bacterial PAMPs treatments, including flg22, EF-Tu, type III secretion system protein HrpZ, lipopolysaccharide, and Pseudomonas syringae pv DC3000 with a deficient type III secretion system. Regarding the ETI data, we collected 36 gene expression profiles of Arabidopsis in response to P. syringae species carrying the Avirulence (Avr) gene (effector genes AvrRpm1 or AvrRpt2), which can elicit ETI in ecotype Columbia wild-type Arabidopsis. The control data included 65 gene expression profiles gathered from the corresponding control experiments for the above treatments. More detailed information can be found in Supplemental Table S3. Raw data in Affymetrix CEL format were processed using the robust multichip average method with the affy package from Bioconductor (http://www.bioconductor.org) and further transformed into z-scores to remove batch effects.
Filtering PPI Network
The reliability of a PPI was measured using the scoring scheme of Lage et al. (2007). First, the network topology information surrounding the interaction was used to compute a raw score (RS) between (–∞, 0):
 |
(1) |
where NS1 and NS2 denote the number of nonshared protein interaction partners of proteins g1 and g2, respectively. The smaller number of shared PPI partners results in a small value of RS. Second, the number of publications supporting the interaction and the experimental scale of the PPI determinations were combined to postprocess the RS as follows:
 |
(2) |
 |
(3) |
where N is the number of different PubMed identifications corresponding to publications in which this interaction is reported. Ti (throughput) is the number of PPIs reported in publication i. Thus, if an interaction was only reported in a high-throughput experiment, score(g1, g2) will be small. Finally, this score was normalized to (0, 1) using Equation 3. To select a suitable cutoff for removing unreliable PPIs, we plotted the distribution curve of the remaining PPI numbers at different cutoffs (Supplemental Fig. S2). A visual determination of the elbow was made, and the cutoff of 0.2 was chosen to remove PPIs with very low reliability scores.
Computing GO Term Annotation Similarity
First, the similarity of two GO terms was measured using the protocol developed by Bradford et al. (2010), in which both the directed acyclic graph structure of GO annotations and functional diversity of a gene were considered. The occurrence frequency p(c) of a GO term c was calculated as the number of Arabidopsis genes annotated with that term divided by the total number of genes annotated with any GO term. The probability of minimum of subsume pms(c1, c2) between the two GO terms c1 and c2 was defined as the minimum of p(c) in all possible shared parent GO terms. Then, the similarity of the two terms c1 and c2 was measured as –lnpms. Second, the GO annotation similarity of genes g1 and g2 was measured according to the similarity of the GO terms. The m GO terms associated with g1 and the n GO terms associated with g2 were used to construct an m × n similarity matrix. The sum of the maximum term similarity scores from each line, and each column was divided by m + n to give a GO annotation similarity score between g1 and g2. In this process, we only considered the GO term biological_process and its child terms. Note that GO annotations were downloaded from TAIR 10 (http://www.arabidopsis.org/), and only those terms with the evidence codes IDA, IPI, IMP, IGI, RCA, TAS, ISS, ISO, ISA, and ISM were considered validated annotations.
Construction of Three Gene Networks Based on Gene Expression Profiles and Gene Chromatin Modification Data
We inferred three gene interaction networks (Supplemental Fig. S1) using gene coexpression patterns in Arabidopsis development and the abiotic stress response and the gene comodification patterns of the 13 chromatin modification types.
The squared Spearman correlation coefficient was used to measure the correlation of gene coexpression patterns because this coefficient has been widely used and showed more accurate performance than Pearson correlation coefficient in inferring TF-target relationships (Ma and Wang, 2012). To minimize the potential possibility of introducing bias to the NGF algorithm, we avoided using immune response-related expression profiles to construct the coexpression network.
We used a weighted binary vector-matching coefficient to measure the similarity of chromatin modification between two genes as follows:
 |
(4) |
 |
(5) |
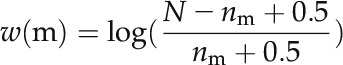
where m denotes a specific modification in the binary chromatin modification vector, Mall represents all 65 of the different modifications in the vector, and w(m) is the weight of m, which is calculated using Equation 5. N is the number of genes in the genome, and nm is the number of genes with modification m.
Moreover, the cutoffs 0.70, 0.80, and 0.44 were used to filter the interactions inferred from gene coexpression in development, gene coexpression in the abiotic stress response, and chromatin comodification, respectively. Thus, the average GO annotation similarity score of each filtered network was identical to that of the retained PPI network. Finally, we only retained the coexpression/comodification pairs in which at least one gene was a TF according to the TF annotations of AGRIS.
NGF Algorithm
The NGF uses the gene expression profiles from two different conditions and the gene interaction network as input to train a classification model that can predict the phenotype of a given expression profile. NGF assigns a score called IS to each gene/interaction according to its contribution to improve the classification accuracy. The complete methodology is detailed in the work of Dutkowski and Ideker (2011). The gene expression profiles of PTI, the control, and AraONE were used to train a PTI-related NGF model, whereas the gene expression profiles of ETI, the control, and AraONE were used to train an ETI-related NGF model. To generate one decision tree, a subset of all expression profiles was first randomly sampled with replacement to produce a new expression profile data set with the same size as the original one. Next, a best predictive gene was selected from a randomly sampled gene subset (size =  ) as a root. Ng is the number of genes in AraONE. To guarantee sufficient candidate genes for use in the next step, only genes with degree of at least 5 were used as root candidates. In the tree growth, the decision tree iteratively partitioned gene expression profiles according to the expression level of the gene (decision gene). In each step of tree growth, decision gene candidates were defined as network neighbors of the genes that had been included in the decision path, and a new decision gene was further selected as that with the highest IS(g) (see Eq. 6). The tree growth was terminated until the statistical predictive power, IS(g) less than 0.02, no longer improved when a new gene was added. A total of 10,000 decision trees were built to construct the NGF model. We implemented NGF using custom Python scripts based on NetworkX (http://networkx.github.io/).
In the original NGF algorithm, the ISs of genes and interactions are measured using the average reduction of tree accuracy on out-of-bag samples. We modified the original algorithm by using a faster method to calculate the ISs. In brief, we used a reduction in the output sample variance due to the node (gene) split in the decision tree to measure the importance of the gene, which is defined as follows:
 |
(6) |
 |
(7) |
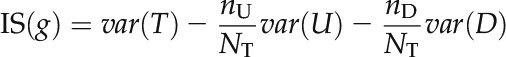
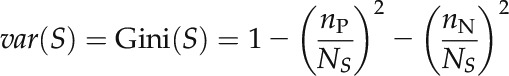
where var(T) is the variance of all of the samples as tested by split node g, var(U) is the variance of the sample subset U in which the expression level of split node g exceeds the threshold (up-regulated), and var(D) is the variance of sample subset D in which the expression level of node g is lower than or equal to the threshold (down-regulated). NT, nU, and nD are the sizes of the corresponding sample sets. The Gini index was used to measure the sample variance as defined by Equation 7, in which nP and nN represent the number of positive and negative samples in sample set S, respectively.
The ISs of the genes were further used to reversely infer the importance of interactions. When gene g was added to the decision tree, all N interactions between g and its parent nodes in the decision tree were assigned an IS equal to IS(g)/N. If a gene or interaction was used more than once in a decision tree, all of its ISs were summed. The ISs from all 10,000 decision trees in the NGF model were further averaged to produce the final IS.
To estimate the statistical significance of ISs for genes and gene interactions, we compared real ISs with those inferred from random conditions and assigned a P value for each real IS. For example, in the PTI group, we first randomly permuted the condition labels (i.e. PTI and control) of 69 PTI microarray samples and 65 control microarray samples. Then, a null hypothesis NGF model was constructed based on these permuted samples and AraONE. We repeated this computation 100 times. For each real IS, a Student’s t test was used to compare it with the corresponding 100 ISs from the null hypothesis. A Bonferroni correction was used to correct the P values. A gene or interaction with a corrected P < 0.05 for its IS was deemed significantly important.
The classification performance of NGF was assessed through a 10-fold cross-validation test. In brief, all of the positive samples (PTI/ETI) and negative samples (control) were first randomly divided into 10 subsets of the same size, respectively. The ratio of positive to negative samples in each subset was roughly the same as that of the original (i.e. 69:65 for the PTI group and 36:65 for the ETI group). Next, the first nine subsets were used to train a machine-learning model, and the remaining one subset was used to test the performance of the established model. This operation was repeated 10 times, in which every subset was used in turn to test the model, to estimate the overall performance of the NGF. To reduce the influence of small sample size on performance stability, the 10-fold cross-validation test was repeated 10 times using different data set partitions.
Extracting Decision Rules and Computing Interaction Logic State Scores
Decision rules were extracted by traversing decision paths for PTI (ETI) of all decision trees in the NGF model and further processed using three operations to remove unreliable, inconsistent, and redundant rules: (1) rules covered less than five samples were removed; (2) if there were multiple highly similar rules, only one was retained; and (3) all contradictory rules whose decision conditions were very similar but yield opposite outcomes were removed. The logic state score of a gene g is defined as follows:
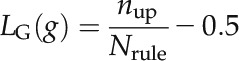 |
(8) |
where nup is the number of decision rules where g is set as up-regulated. Nrule is the total number of decision rules. The logic state sore of the interaction is the following:
 |
(9) |
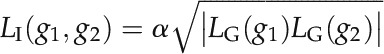
where α is 1 if LG(g1)LG(g2) is larger than 0; otherwise, α is –1.
Detection of Network Modules
MCL was used to detect network modules for the following reasons. First, it is robust to noisy biological network data (Vlasblom and Wodak, 2009) and has been successfully used in previous plant molecular network research (Tzfadia et al., 2012). Second, it has shown to be more accurate compared with other algorithms (Nepusz et al., 2012). Third, it is scalable to the network with thousands of nodes. The MCL algorithm (http://micans.org/mcl/) with default parameters (granularity = 2 and edge weight = 1) was used to cluster AraONE, and only network modules with a size of at least three genes were retained.
Identification and Functional Classification of Significant Modules
The preliminary version of the GSEA algorithm (Mootha et al., 2003) was implemented with custom code to identify network modules significantly enriched with high IS genes in the PTI group (or the ETI group). Using the PTI group as an example, the NGF-based GSEA was conducted as follow. In the first step, all N genes in AraONE were arranged in descending order according to their NGF
ISs. In the second step, for a module with M genes, a running sum was computed from the gene with the highest IS(g1) to that with the lowest IS(gN). The running sum was defined as  .
.  if gi belongs to the module; otherwise,
  . In the third step, an enrichment score (ES) of the module was defined as
  . To determine the statistical significance of the ESs, 100 random NGF models were built on gene expression profiles whose phenotype labels were randomly permuted. The above three computational procedures were repeated on ISs from each random model. Then, the ESs of all modules from all 100 random NGF models were pooled together to construct a background distribution of ESs. The P value of each real ES was computed as the proportion of the ES in the background distribution that was equal to or larger than the real ES (Mootha et al., 2003). Modules with an empirical P < 0.05 were considered significant.
We performed a functional annotation of the significant modules using BiNGO and classified them into five functional categories: (1) signal transduction, (2) transcriptional regulation, (3) hormone, (4) defense response, and (5) growth or development. Because there could be more than one enriched functional term within a module, we only considered the most significant term (i.e. the GO term with the lowest P value). The modules that were annotated with terms containing the words signal transduction or phosphorylation were partitioned into category 1; those that were annotated with terms including regulation of transcription or RNA processing were partitioned into category 2; those that were annotated with hormone-related terms such as response to auxin or ethylene-mediated signaling pathway or including known master hormone regulators, such as NPR1 (Dong, 2004), were grouped into category 3; those that were annotated with terms including defense response, hypersensitive response, or response to bacterium or important defense-related process, such as indole glucosinolate biosynthetic process (Clay et al., 2009), were partitioned into category 4; and those that were annotated with terms including photosynthesis, growth, development, cell cycle, or organ morphogenesis were partitioned into category 5. The modules that were annotated with other functions were removed. A complete list of the significant modules is provided in Supplemental Table S10.
Calculation of CC
As an index to measure the node’s closeness to the center of the network, CC is defined as follows:
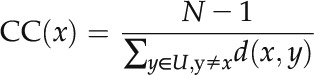 |
(10) |
where N is the gene number in the network, U is the set of all genes in the network, and d(x,y) is the shortest network distance between genes x and y.
Network Visualization
Cytoscape (Saito et al., 2012) and its plugins were used to visualize the network. Specifically, Cerebral plugin (http://www.pathogenomics.ca/cerebral/) was used to visualize the shared subnetwork in pathway style. The subcellular location information of gene production was downloaded from SUBA3 (http://suba.plantenergy.uwa.edu.au/). The GO enrichment results from BiNGO were imported into the Enrichment Map plugin (http://www.baderlab.org/Software/EnrichmentMap) to create an Enrichment Map of the shared network.
Supplemental Data
The following supplemental materials are available.
Supplemental Figure S1. Assembly of the integrative gene network (AraONE).
Supplemental Figure S2. The cumulative distribution of reliability score in the PPI data.
Supplemental Figure S3. Comparison of the GO term annotation similarities of AraONE/PPI and the corresponding random network.
Supplemental Figure S4. The average GO term annotation similarity of retained PPIs as a function of PPI reliability score.
Supplemental Figure S5. Venn diagram of the overlap among the five data sets.
Supplemental Figure S6. Reproducibility of NGF.
Supplemental Figure S7. Differential expression of NPR1, CPK1, and their neighbors.
Supplemental Figure S8. Force-directed layout of the shared subnetwork.
Supplemental Figure S9. Biological processes enriched in the shared subnetwork after removing the interactions inferred from gene coexpression data.
Supplemental Figure S10. Functional annotations of module M63.
Supplemental Figure S11. Submodules derived from M63.
Supplemental Figure S12. CC of M63.
Supplemental Table S1. Source of the chromatin modification data.
Supplemental Table S2. AraONE interactions annotated with their data sources.
Supplemental Table S3. Composition of the gene expression profiles.
Supplemental Table S4. Performance of NGF on two independent data sets.
Supplemental Table S5. All significantly important genes and interactions identified by NGF.
Supplemental Table S6. Extended Tables II and III with functional annotation and reference information for each gene.
Supplemental Table S7. The top 30 DEGs and their functional annotation.
Supplemental Table S8. Gene members of the 633 network modules.
Supplemental Table S9. List of 49 putative effector targets within the shared subnetwork.
Supplemental Table S10. Significant network modules identified by NGF-based GSEA and their functional annotations.
Supplemental Table S11. Functional annotation of the network modules of the two modular models.
Supplemental Text S1. The shared subnetwork in Cytoscape (.cys) format (Cytoscape 2.8.2 installed with the Cerebral plugin is recommended to explore this data set).
Supplementary Material
Acknowledgments
We thank the editor and anonymous referees whose constructive comments were very helpful in improving the quality of this work and Drs. Wenxian Sun and Changfu Tian (China Agricultural University) and Dr. Fei He (Brookhaven National Laboratory) for critical reading and helpful comments.
Glossary
- PTI
pattern-triggered immunity
- ETI
effector-triggered immunity
- PAMP
pathogen-associated molecular pattern
- SA
salicylic acid
- TF
transcription factor
- NGF
network-guided forest
- RF
Random Forest
- GSEA
gene set enrichment analysis
- GO
gene ontology
- IS
importance score
- AUC
area under the receiver operating characteristics curve
- DEG
differentially expressed gene
- MCL
Markov Cluster
- MIR
intermodule to intramodule interaction ratio
- CC
closeness centrality
- JA
jasmonic acid
- TAIR
The Arabidopsis Information Resource
- UTR
untranslated region
- RS
raw score
- ES
enrichment score
Footnotes
This work was supported by the National Natural Science Foundation of China (grant nos. 31271414 and 31471249).
References
- Abramovitch RB, Anderson JC, Martin GB (2006) Bacterial elicitation and evasion of plant innate immunity. Nat Rev Mol Cell Biol 7: 601–611 [DOI] [PMC free article] [PubMed] [Google Scholar]
- Barabási AL, Oltvai ZN (2004) Network biology: understanding the cell’s functional organization. Nat Rev Genet 5: 101–113 [DOI] [PubMed] [Google Scholar]
- Bassel GW, Glaab E, Marquez J, Holdsworth MJ, Bacardit J (2011a) Functional network construction in Arabidopsis using rule-based machine learning on large-scale data sets. Plant Cell 23: 3101–3116 [DOI] [PMC free article] [PubMed] [Google Scholar]
- Bassel GW, Lan H, Glaab E, Gibbs DJ, Gerjets T, Krasnogor N, Bonner AJ, Holdsworth MJ, Provart NJ (2011b) Genome-wide network model capturing seed germination reveals coordinated regulation of plant cellular phase transitions. Proc Natl Acad Sci USA 108: 9709–9714 [DOI] [PMC free article] [PubMed] [Google Scholar]
- Bradford JR, Needham CJ, Tedder P, Care MA, Bulpitt AJ, Westhead DR (2010) GO-At: in silico prediction of gene function in Arabidopsis thaliana by combining heterogeneous data. Plant J 61: 713–721 [DOI] [PubMed] [Google Scholar]
- Breiman L. (2001) Random Forest. Mach Learn 45: 5–32 [Google Scholar]
- Bu Q, Jiang H, Li CB, Zhai Q, Zhang J, Wu X, Sun J, Xie Q, Li C (2008) Role of the Arabidopsis thaliana NAC transcription factors ANAC019 and ANAC055 in regulating jasmonic acid-signaled defense responses. Cell Res 18: 756–767 [DOI] [PubMed] [Google Scholar]
- Cappadocia L, Maréchal A, Parent JS, Lepage E, Sygusch J, Brisson N (2010) Crystal structures of DNA-Whirly complexes and their role in Arabidopsis organelle genome repair. Plant Cell 22: 1849–1867 [DOI] [PMC free article] [PubMed] [Google Scholar]
- Chisholm ST, Coaker G, Day B, Staskawicz BJ (2006) Host-microbe interactions: shaping the evolution of the plant immune response. Cell 124: 803–814 [DOI] [PubMed] [Google Scholar]
- Clay NK, Adio AM, Denoux C, Jander G, Ausubel FM (2009) Glucosinolate metabolites required for an Arabidopsis innate immune response. Science 323: 95–101 [DOI] [PMC free article] [PubMed] [Google Scholar]
- Coca M, San Segundo B (2010) AtCPK1 calcium-dependent protein kinase mediates pathogen resistance in Arabidopsis. Plant J 63: 526–540 [DOI] [PubMed] [Google Scholar]
- Dodds PN, Rathjen JP (2010) Plant immunity: towards an integrated view of plant-pathogen interactions. Nat Rev Genet 11: 539–548 [DOI] [PubMed] [Google Scholar]
- Dong X. (2004) NPR1, all things considered. Curr Opin Plant Biol 7: 547–552 [DOI] [PubMed] [Google Scholar]
- Dutkowski J, Ideker T (2011) Protein networks as logic functions in development and cancer. PLoS Comput Biol 7: e1002180. [DOI] [PMC free article] [PubMed] [Google Scholar]
- Enright AJ, Van Dongen S, Ouzounis CA (2002) An efficient algorithm for large-scale detection of protein families. Nucleic Acids Res 30: 1575–1584 [DOI] [PMC free article] [PubMed] [Google Scholar]
- Fan M, Bai MY, Kim JG, Wang T, Oh E, Chen L, Park CH, Son SH, Kim SK, Mudgett MB, et al. (2014) The bHLH transcription factor HBI1 mediates the trade-off between growth and pathogen-associated molecular pattern-triggered immunity in Arabidopsis. Plant Cell 26: 828–841 [DOI] [PMC free article] [PubMed] [Google Scholar]
- Gao X, Chen X, Lin W, Chen S, Lu D, Niu Y, Li L, Cheng C, McCormack M, Sheen J, et al. (2013) Bifurcation of Arabidopsis NLR immune signaling via Ca²⁺-dependent protein kinases. PLoS Pathog 9: e1003127. [DOI] [PMC free article] [PubMed] [Google Scholar]
- He F, Zhou Y, Zhang Z (2010) Deciphering the Arabidopsis floral transition process by integrating a protein-protein interaction network and gene expression data. Plant Physiol 153: 1492–1505 [DOI] [PMC free article] [PubMed] [Google Scholar]
- He P, Shan L, Lin NC, Martin GB, Kemmerling B, Nürnberger T, Sheen J (2006) Specific bacterial suppressors of MAMP signaling upstream of MAPKKK in Arabidopsis innate immunity. Cell 125: 563–575 [DOI] [PubMed] [Google Scholar]
- Heyndrickx KS, Vandepoele K (2012) Systematic identification of functional plant modules through the integration of complementary data sources. Plant Physiol 159: 884–901 [DOI] [PMC free article] [PubMed] [Google Scholar]
- Hinderhofer K, Zentgraf U (2001) Identification of a transcription factor specifically expressed at the onset of leaf senescence. Planta 213: 469–473 [DOI] [PubMed] [Google Scholar]
- Hu Y, Dong Q, Yu D (2012) Arabidopsis WRKY46 coordinates with WRKY70 and WRKY53 in basal resistance against pathogen Pseudomonas syringae. Plant Sci 185-186: 288–297 [DOI] [PubMed] [Google Scholar]
- Huang W, Sherman BT, Lempicki RA (2009) Systematic and integrative analysis of large gene lists using DAVID bioinformatics resources. Nat Protoc 4: 44–57 [DOI] [PubMed] [Google Scholar]
- Ji H, Wong WH (2005) TileMap: create chromosomal map of tiling array hybridizations. Bioinformatics 21: 3629–3636 [DOI] [PubMed] [Google Scholar]
- Jones AM, Xuan Y, Xu M, Wang RS, Ho CH, Lalonde S, You CH, Sardi MI, Parsa SA, Smith-Valle E, et al. (2014) Border control: a membrane-linked interactome of Arabidopsis. Science 344: 711–716 [DOI] [PubMed] [Google Scholar]
- Jones JDG, Dangl JL (2006) The plant immune system. Nature 444: 323–329 [DOI] [PubMed] [Google Scholar]
- Journot-Catalino N, Somssich IE, Roby D, Kroj T (2006) The transcription factors WRKY11 and WRKY17 act as negative regulators of basal resistance in Arabidopsis thaliana. Plant Cell 18: 3289–3302 [DOI] [PMC free article] [PubMed] [Google Scholar]
- Kannan K, Nelson ADL, Shippen DE (2008) Dyskerin is a component of the Arabidopsis telomerase RNP required for telomere maintenance. Mol Cell Biol 28: 2332–2341 [DOI] [PMC free article] [PubMed] [Google Scholar]
- Katagiri F, Tsuda K (2010) Understanding the plant immune system. Mol Plant Microbe Interact 23: 1531–1536 [DOI] [PubMed] [Google Scholar]
- Kilian J, Whitehead D, Horak J, Wanke D, Weinl S, Batistic O, D’Angelo C, Bornberg-Bauer E, Kudla J, Harter K (2007) The AtGenExpress global stress expression data set: protocols, evaluation and model data analysis of UV-B light, drought and cold stress responses. Plant J 50: 347–363 [DOI] [PubMed] [Google Scholar]
- Kim Y, Tsuda K, Igarashi D, Hillmer RA, Sakakibara H, Myers CL, Katagiri F (2014) Mechanisms underlying robustness and tunability in a plant immune signaling network. Cell Host Microbe 15: 84–94 [DOI] [PMC free article] [PubMed] [Google Scholar]
- Lage K, Karlberg EO, Størling ZM, Olason PI, Pedersen AG, Rigina O, Hinsby AM, Tümer Z, Pociot F, Tommerup N, et al. (2007) A human phenome-interactome network of protein complexes implicated in genetic disorders. Nat Biotechnol 25: 309–316 [DOI] [PubMed] [Google Scholar]
- Lee I, Ambaru B, Thakkar P, Marcotte EM, Rhee SY (2010) Rational association of genes with traits using a genome-scale gene network for Arabidopsis thaliana. Nat Biotechnol 28: 149–156 [DOI] [PMC free article] [PubMed] [Google Scholar]
- Li J, Brader G, Palva ET (2004) The WRKY70 transcription factor: a node of convergence for jasmonate-mediated and salicylate-mediated signals in plant defense. Plant Cell 16: 319–331 [DOI] [PMC free article] [PubMed] [Google Scholar]
- Li W, Ahn IP, Ning Y, Park CH, Zeng L, Whitehill JGA, Lu H, Zhao Q, Ding B, Xie Q, et al. (2012) The U-Box/ARM E3 ligase PUB13 regulates cell death, defense, and flowering time in Arabidopsis. Plant Physiol 159: 239–250 [DOI] [PMC free article] [PubMed] [Google Scholar]
- Lumba S, Toh S, Handfield LF, Swan M, Liu R, Youn JY, Cutler SR, Subramaniam R, Provart N, Moses A, et al. (2014) A mesoscale abscisic acid hormone interactome reveals a dynamic signaling landscape in Arabidopsis. Dev Cell 29: 360–372 [DOI] [PubMed] [Google Scholar]
- Luo C, Lam E (2010) ANCORP: a high-resolution approach that generates distinct chromatin state models from multiple genome-wide datasets. Plant J 63: 339–351 [DOI] [PubMed] [Google Scholar]
- Luo M, Wang YY, Liu X, Yang S, Lu Q, Cui Y, Wu K (2012) HD2C interacts with HDA6 and is involved in ABA and salt stress response in Arabidopsis. J Exp Bot 63: 3297–3306 [DOI] [PMC free article] [PubMed] [Google Scholar]
- Ma C, Wang X (2012) Application of the Gini correlation coefficient to infer regulatory relationships in transcriptome analysis. Plant Physiol 160: 192–203 [DOI] [PMC free article] [PubMed] [Google Scholar]
- Ma C, Xin M, Feldmann KA, Wang X (2014) Machine learning-based differential network analysis: a study of stress-responsive transcriptomes in Arabidopsis. Plant Cell 26: 520–537 [DOI] [PMC free article] [PubMed] [Google Scholar]
- Ma KW, Flores C, Ma W (2011) Chromatin configuration as a battlefield in plant-bacteria interactions. Plant Physiol 157: 535–543 [DOI] [PMC free article] [PubMed] [Google Scholar]
- Maere S, Heymans K, Kuiper M (2005) BiNGO: a Cytoscape plugin to assess overrepresentation of gene ontology categories in biological networks. Bioinformatics 21: 3448–3449 [DOI] [PubMed] [Google Scholar]
- Marbach D, Roy S, Ay F, Meyer PE, Candeias R, Kahveci T, Bristow CA, Kellis M (2012) Predictive regulatory models in Drosophila melanogaster by integrative inference of transcriptional networks. Genome Res 22: 1334–1349 [DOI] [PMC free article] [PubMed] [Google Scholar]
- Merico D, Isserlin R, Stueker O, Emili A, Bader GD (2010) Enrichment map: a network-based method for gene-set enrichment visualization and interpretation. PLoS ONE 5: e13984. [DOI] [PMC free article] [PubMed] [Google Scholar]
- Miao Y, Zentgraf U (2007) The antagonist function of Arabidopsis WRKY53 and ESR/ESP in leaf senescence is modulated by the jasmonic and salicylic acid equilibrium. Plant Cell 19: 819–830 [DOI] [PMC free article] [PubMed] [Google Scholar]
- Moore JW, Loake GJ, Spoel SH (2011) Transcription dynamics in plant immunity. Plant Cell 23: 2809–2820 [DOI] [PMC free article] [PubMed] [Google Scholar]
- Mootha VK, Lindgren CM, Eriksson KF, Subramanian A, Sihag S, Lehar J, Puigserver P, Carlsson E, Ridderstråle M, Laurila E, et al. (2003) PGC-1α-responsive genes involved in oxidative phosphorylation are coordinately downregulated in human diabetes. Nat Genet 34: 267–273 [DOI] [PubMed] [Google Scholar]
- Mukhtar MS, Carvunis A-R, Dreze M, Epple P, Steinbrenner J, Moore J, Tasan M, Galli M, Hao T, Nishimura MT, et al. (2011) Independently evolved virulence effectors converge onto hubs in a plant immune system network. Science 333: 596–601 [DOI] [PMC free article] [PubMed] [Google Scholar]
- Naseem M, Philippi N, Hussain A, Wangorsch G, Ahmed N, Dandekar T (2012) Integrated systems view on networking by hormones in Arabidopsis immunity reveals multiple crosstalk for cytokinin. Plant Cell 24: 1793–1814 [DOI] [PMC free article] [PubMed] [Google Scholar]
- Nepusz T, Yu H, Paccanaro A (2012) Detecting overlapping protein complexes in protein-protein interaction networks. Nat Methods 9: 471–472 [DOI] [PMC free article] [PubMed] [Google Scholar]
- Pajerowska-Mukhtar KM, Wang W, Tada Y, Oka N, Tucker CL, Fonseca JP, Dong X (2012) The HSF-like transcription factor TBF1 is a major molecular switch for plant growth-to-defense transition. Curr Biol 22: 103–112 [DOI] [PMC free article] [PubMed] [Google Scholar]
- Pandey SP, Somssich IE (2009) The role of WRKY transcription factors in plant immunity. Plant Physiol 150: 1648–1655 [DOI] [PMC free article] [PubMed] [Google Scholar]
- Qi Y, Ge H (2006) Modularity and dynamics of cellular networks. PLoS Comput Biol 2: e174. [DOI] [PMC free article] [PubMed] [Google Scholar]
- Saito R, Smoot ME, Ono K, Ruscheinski J, Wang PL, Lotia S, Pico AR, Bader GD, Ideker T (2012) A travel guide to Cytoscape plugins. Nat Methods 9: 1069–1076 [DOI] [PMC free article] [PubMed] [Google Scholar]
- Sato M, Tsuda K, Wang L, Coller J, Watanabe Y, Glazebrook J, Katagiri F (2010) Network modeling reveals prevalent negative regulatory relationships between signaling sectors in Arabidopsis immune signaling. PLoS Pathog 6: e1001011. [DOI] [PMC free article] [PubMed] [Google Scholar]
- Schmid M, Davison TS, Henz SR, Pape UJ, Demar M, Vingron M, Schölkopf B, Weigel D, Lohmann JU (2005) A gene expression map of Arabidopsis thaliana development. Nat Genet 37: 501–506 [DOI] [PubMed] [Google Scholar]
- Schwessinger B, Roux M, Kadota Y, Ntoukakis V, Sklenar J, Jones A, Zipfel C (2011) Phosphorylation-dependent differential regulation of plant growth, cell death, and innate immunity by the regulatory receptor-like kinase BAK1. PLoS Genet 7: e1002046. [DOI] [PMC free article] [PubMed] [Google Scholar]
- Shaik R, Ramakrishna W (2013) Genes and co-expression modules common to drought and bacterial stress responses in Arabidopsis and rice. PLoS ONE 8: e77261. [DOI] [PMC free article] [PubMed] [Google Scholar]
- Shaik R, Ramakrishna W (2014) Machine learning approaches distinguish multiple stress conditions using stress-responsive genes and identify candidate genes for broad resistance in rice. Plant Physiol 164: 481–495 [DOI] [PMC free article] [PubMed] [Google Scholar]
- Spoel SH, Dong X (2012) How do plants achieve immunity? Defence without specialized immune cells. Nat Rev Immunol 12: 89–100 [DOI] [PubMed] [Google Scholar]
- Stone JM, Walker JC (1995) Plant protein kinase families and signal transduction. Plant Physiol 108: 451–457 [DOI] [PMC free article] [PubMed] [Google Scholar]
- Tao Y, Xie Z, Chen W, Glazebrook J, Chang HS, Han B, Zhu T, Zou G, Katagiri F (2003) Quantitative nature of Arabidopsis responses during compatible and incompatible interactions with the bacterial pathogen Pseudomonas syringae. Plant Cell 15: 317–330 [DOI] [PMC free article] [PubMed] [Google Scholar]
- Tena G, Boudsocq M, Sheen J (2011) Protein kinase signaling networks in plant innate immunity. Curr Opin Plant Biol 14: 519–529 [DOI] [PMC free article] [PubMed] [Google Scholar]
- Thomma BPHJ, Nürnberger T, Joosten MHAJ (2011) Of PAMPs and effectors: the blurred PTI-ETI dichotomy. Plant Cell 23: 4–15 [DOI] [PMC free article] [PubMed] [Google Scholar]
- Touw WG, Bayjanov JR, Overmars L, Backus L, Boekhorst J, Wels M, van Hijum SAFT (2013) Data mining in the Life Sciences with Random Forest: a walk in the park or lost in the jungle? Brief Bioinform 14: 315–326 [DOI] [PMC free article] [PubMed] [Google Scholar]
- Truman W, de Zabala MT, Grant M (2006) Type III effectors orchestrate a complex interplay between transcriptional networks to modify basal defence responses during pathogenesis and resistance. Plant J 46: 14–33 [DOI] [PubMed] [Google Scholar]
- Tsuda K, Katagiri F (2010) Comparing signaling mechanisms engaged in pattern-triggered and effector-triggered immunity. Curr Opin Plant Biol 13: 459–465 [DOI] [PubMed] [Google Scholar]
- Tsuda K, Sato M, Stoddard T, Glazebrook J, Katagiri F (2009) Network properties of robust immunity in plants. PLoS Genet 5: e1000772. [DOI] [PMC free article] [PubMed] [Google Scholar]
- Tzfadia O, Amar D, Bradbury LMT, Wurtzel ET, Shamir R (2012) The MORPH algorithm: ranking candidate genes for membership in Arabidopsis and tomato pathways. Plant Cell 24: 4389–4406 [DOI] [PMC free article] [PubMed] [Google Scholar]
- Vlasblom J, Wodak SJ (2009) Markov clustering versus affinity propagation for the partitioning of protein interaction graphs. BMC Bioinformatics 10: 99. [DOI] [PMC free article] [PubMed] [Google Scholar]
- Walhout AJM. (2006) Unraveling transcription regulatory networks by protein-DNA and protein-protein interaction mapping. Genome Res 16: 1445–1454 [DOI] [PubMed] [Google Scholar]
- Wang D, Amornsiripanitch N, Dong X (2006) A genomic approach to identify regulatory nodes in the transcriptional network of systemic acquired resistance in plants. PLoS Pathog 2: e123. [DOI] [PMC free article] [PubMed] [Google Scholar]
- Wang GF, Seabolt S, Hamdoun S, Ng G, Park J, Lu H (2011a) Multiple roles of WIN3 in regulating disease resistance, cell death, and flowering time in Arabidopsis. Plant Physiol 156: 1508–1519 [DOI] [PMC free article] [PubMed] [Google Scholar]
- Wang W, Barnaby JY, Tada Y, Li H, Tör M, Caldelari D, Lee DU, Fu XD, Dong X (2011b) Timing of plant immune responses by a central circadian regulator. Nature 470: 110–114 [DOI] [PMC free article] [PubMed] [Google Scholar]
- Wang Y, An C, Zhang X, Yao J, Zhang Y, Sun Y, Yu F, Amador DM, Mou Z (2013) The Arabidopsis elongator complex subunit2 epigenetically regulates plant immune responses. Plant Cell 25: 762–776 [DOI] [PMC free article] [PubMed] [Google Scholar]
- Weßling R, Epple P, Altmann S, He Y, Yang L, Henz SR, McDonald N, Wiley K, Bader KC, Gläßer C, et al. (2014) Convergent targeting of a common host protein-network by pathogen effectors from three kingdoms of life. Cell Host Microbe 16: 364–375 [DOI] [PMC free article] [PubMed] [Google Scholar]
- Wiermer M, Feys BJ, Parker JE (2005) Plant immunity: the EDS1 regulatory node. Curr Opin Plant Biol 8: 383–389 [DOI] [PubMed] [Google Scholar]
- Wu K, Tian L, Malik K, Brown D, Miki B (2000) Functional analysis of HD2 histone deacetylase homologues in Arabidopsis thaliana. Plant J 22: 19–27 [DOI] [PubMed] [Google Scholar]
- Xu B, Sathitsuksanoh N, Tang Y, Udvardi MK, Zhang JY, Shen Z, Balota M, Harich K, Zhang PYH, Zhao B (2012) Overexpression of AtLOV1 in switchgrass alters plant architecture, lignin content, and flowering time. PLoS ONE 7: e47399. [DOI] [PMC free article] [PubMed] [Google Scholar]
- Yoo SY, Kim Y, Kim SY, Lee JS, Ahn JH (2007) Control of flowering time and cold response by a NAC-domain protein in Arabidopsis. PLoS ONE 2: e642. [DOI] [PMC free article] [PubMed] [Google Scholar]
- Zhang Z, Wu Y, Gao M, Zhang J, Kong Q, Liu Y, Ba H, Zhou J, Zhang Y (2012) Disruption of PAMP-induced MAP kinase cascade by a Pseudomonas syringae effector activates plant immunity mediated by the NB-LRR protein SUMM2. Cell Host Microbe 11: 253–263 [DOI] [PubMed] [Google Scholar]
- Zheng Z, Mosher SL, Fan B, Klessig DF, Chen Z (2007) Functional analysis of Arabidopsis WRKY25 transcription factor in plant defense against Pseudomonas syringae. BMC Plant Biol 7: 2. [DOI] [PMC free article] [PubMed] [Google Scholar]
- Zheng Z, Qamar SA, Chen Z, Mengiste T (2006) Arabidopsis WRKY33 transcription factor is required for resistance to necrotrophic fungal pathogens. Plant J 48: 592–605 [DOI] [PubMed] [Google Scholar]
Associated Data
This section collects any data citations, data availability statements, or supplementary materials included in this article.