Abstract
Somites are embryonic precursors that give rise to the axial skeleton and skeletal muscles and form the segmental vertebrate body plan. Somitogenesis is controlled by the “segmentation clock”, which contains multiple oscillator genes that must be tightly regulated at both the transcriptional and post-transcriptional levels for proper clock function. However, how the segmentation clock governs the formation of the somites at post-transcriptional level, remains unclear. In this work, we develop an integrated model with three modules for the segmentation clock and explore the mechanism for somite segmentation based on the dynamics of the network. By numerical simulations, we find that the amplitude and period of the somite segmentation clock are sensitive to Notch activity, which is fine-tuned by Lunatic fringe (Lfng) and microRNA (miRNA), and Lfng and miRNA are essential for forming the proper segmentation during somitogenesis. Moreover, miRNA is found to have a crucial role in minimizing the fluctuation period and amplitude to maintain coherent oscillation. Introduction of stochasticity in the model enables us to explain the available experimental data with dampening of oscillations. These findings uncover a fresh mechanism for regulation of the segmentation clock at a post-transcriptional level and provide important insights into how the relatively subtle effects of miRNAs on target genes can have broad effects in developmental situations that have critical requirements for tight posttranscriptional regulation.
Keywords: Somitogenesis, miRNA, stochastic simulation, deterministic model, segmentation clock
Introduction
Somitogenesis is a developmental process during which the cohorts of cells, also named as somites, are generated in a rhythmic fashion from the mesenchymal presomitic mesoderm (PSM) [1]. As the embryo elongates in the posterior direction and adds new cells to the posterior PSM, a posteriorly moving wavefront of differentiation is observed traversing the anterior-posterior (AP) axis of the vertebrate embryo [2]. During somitogenesis, the expression level of numerous genes oscillate in the PSM as part of a segmentation clock [3], during which the clock oscillation rate attains its maximum value in the posterior PSM and decreases anteriorly along the AP axis, thereby controls the timing of somite formation.
In vertebrate such as zebrafish and chicken, the Delta-Notch signaling, which is an evolutionary conserved signaling pathway, has been demonstrated to play a critical role in the coordination of patterning in the posterior PSM [4,5]. The canonical Delta-Notch signaling is a receptor-ligand binding interaction in which the Delta ligand binding to the extracellular domain of Notch receptor of a neighboring cell triggers proteolytic cleavage and release of the Notch intracellular domain (NICD), which enters the cell nucleus to initiate the transcription of target genes [6]. Up to now, multiple oscillating Notch target genes have been identified and many possible feedback loops have been proposed (see reviews in [7]). The Notch target c-hairy-1 (a chicken homologue of mouse Hes1) was found oscillated in the PSM as part of a segmentation clock that controls the timing of somite formation [3,8]. In mouse and chick, a key oscillatory gene is Lunatic fringe (Lfng) that encodes a glycosyltransferase to inhibit the Notch signaling [9]. Interestingly, the Hes1 protein forms a dimer that can inhibit its own and others’ (e.g. Lfng) transcription. Then, gene transcription decreases and so does the protein product as a result. In these feedback loops, the lengths of delays imposed by transcription rate and translational efficiency, as well as the half-lives of transcripts and proteins are critical for the maintenance of stable oscillations. During the vertebrate segmentation, both the Lfng transcript levels and Lfng protein levels oscillate with a period that matches the rate of somite formation (120 min in the mouse, 90 min in the chick) [10,11].
Previous studies show that the loss of Lfng in mice leads to severe skeletal abnormalities and its mutants result in defects in somite segmentation and rostral-caudal somite patterning [12,13]. The constitutive expression of Lfng in mice [14] and the overexpression of Lfng in chick [10] have similar somite and skeletal phenotypes, indicating that the nonoscillatory Lfng activity perturbs somite formation and patterning. This is presumably because of perturbing the oscillatory nature of the endogenous gene expression. These results imply that the control of Lfng mRNA and protein is tightly associated with proper segmentation clock function.
Recent evidence indicates that the cyclic Lfng expression is also regulated at post-transcriptional level by miRNA. For example, mir-125a-5p can bind to evolutionarily conserved sequences in the Lfng 3’ untranslated region (UTR) for repression by translation inhibition, and/or mRNA deadenylation and decay [15]. Notably, blocking interactions between them in vivo results in abnormal segmentation and perturbs clock activity. Therefore, regulation of Lfng by miRNA is essential for proper segmentation during chick somitogenesis. However, the underlying mechanism remains elusive.
Although several models of the segmentation clock in other animals have been developed [7,16-18], they are almost all deterministic. However, the copy number of the molecules involved in the system is supposed to be small. In contrast, the stochasticity (molecular noise) may cause physiological heterogeneity in populations of (isogenic) cells. Therefore, the main purpose of this work is to address the following two problems: (1) how does miRNA regulate the dynamics of the clock? (2) what is the behavior of the clock in somitogenesis by introducing noise? By developing a mathematic model of the segmentation clock including post-transcriptional regulation in aves, we investigate the effect of the miRNA and the stochastic fluctuations on the clock behavior (such as the distribution of fluctuation period and amplitude), the discrepancy between continuous deterministic model and the discrete stochastic model, and their relationships with experimental data.
Model and methods
The model, schematized in Figure 1, describes the regulatory interactions between the products of the Notch, c-hairy-1, Lfng and miRNA genes. This integrative model is composed of three modules: Notch-Lfng feedback control module, a c-hairy-1 autoregulation module, and a miRNA-mediated tuner module.
Figure 1.
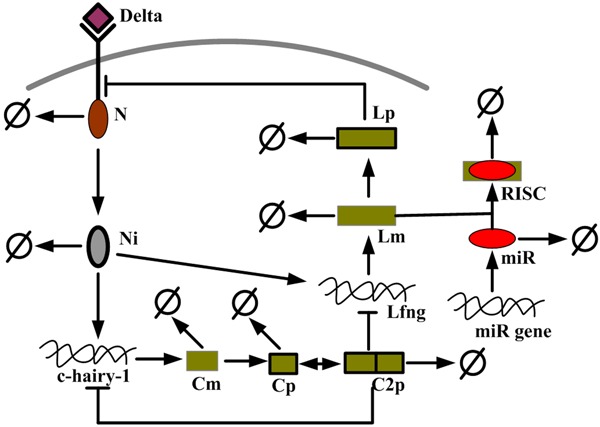
Schematic representation of the segmentation clock network. Notch protein is activated by Delta ligand, and then releases NICD to induce transcription of Lfng and c-hairy-1 genes. The Lfng protein plays a negative control on the cleavage of Notch into NICD, thus forms a Notch-Lfng feedback control module. The Lfng gene can be modulated by miRNA (miR) in post-transcription level (miRNA-mediated tuner module). The c-hairy-1 protein forms a dimer to auto-regulate its own gene expression (c-hairy-1 auto-regulation module) and also inhibits the transcription of Lfng gene.
Kinetic equations for oscillations in Notch-Lfng feedback control module
In this module, several processes are incorporated: the activation of the Notch protein (N) by cleavage yielding active Notch in the form of the NICD (Ni), the Lfng gene transcription induced by NICD while inhibited by c-hairy-1 protein dimer (C2p), the degradation of Lfng mRNA induced by miRNA (miR), the translation of Lfng mRNA (Lm), and the negative control on the cleavage of Notch into NICD by the Lfng protein (Lp). The kinetic equations are described as follows:
d[N]/dt = k 1 - k 2·[N]m·k 9 m/(k 9 m + [Lp]m) - d 1·[N] (1)
d[Ni]/dt = k 2·[N]m·k 9 m/(k 9 m + [Lp]m) - d 2·[Ni] (2)
d[Lm]/dt = k 6·[Ni]j/(k 7 j + [Ni]j + [C2p]j) - d 5·[Lm] - k 11·[Lm]·[miR] (3)
d[Lp]/dt = k 8·[Lm] - d 6·[Lp] (4)
Kinetic equations for oscillations in a c-hairy-1 autoregulation module
c-hairy-1 gene is an avian homolog of the Hes repressor genes, which plays an important role in the development of chick PSM. In mammals, all Hes protein factors contain a conserved basic helix loop helix (bHLH) domain for dimerization that binds to the E box of the corresponding promoter and thereby represses transcription. Thus, Hes factors display a dominant-negative effect on its own gene expression. By analogy with Hes gene, we suppose that c-hairy-1 has a similar half-life time and also posits a negative feedback loop. Hence, in this module, we incorporated the models by following processes: the activation of c-hairy-1 gene transcription by NICD, the translation of c-hairy-1 mRNA (Cm) to c-hairy-1 protein (Cp), the formation, and dissociation of c-hairy-1 protein dimer. The time evolution of these variables is governed by the following kinetic equations:
d[Cm]/dt = k 3·[Ni]n/(k 5 n + [Ni]n + [C2p]n) - d 3·[Cm] (5)
d[Cp]/dt = K 4·[Cm] - d 4·[Cp] - ka·[Cp]2 + kd·[C2p] (6)
d[C2p]/dt = K a·[Cp]2 - kd·[C2p] - d 9·[C2p] (7)
Kinetic equations for oscillations in a miRNA-mediated tuner module
This module involves miRNA gene transcription and RNA induced silencing complex (RISC) formation. Their kinetic equations are depicted as follows:
d[miR]/dt = k 10 - d 7·[miR] - k 11·[miR]·[Lm] (8)
d[RISC]/dt = k 11·[miR]·[Lm] - d 8·[RISC] (9)
All parameters used in these equations are listed in Table 1 and the ordinary differential equations (ODEs) were numerically solved by the Runge-Kutta method. To study the stochastic behavior of the system, we analyze our model of the clock by performing discrete stochastic simulations (using Gillespie’s [19] algorithm) in which stochasticity emerges through the randomized behavior defined by the reaction propensity functions.
Table 1.
Parameter values used for the models
| Symbol | Description | Value | Source |
|---|---|---|---|
| k1 | Fixed rate of Notch synthesis | 1.5 (nM·min-1) | evaluated |
| k2 | First-order rate constant for Notch cleavage into NICD upon Delta binding | 3.45 (nM-1 min-1) | [16] |
| k3 | Maximum rate of c-hairy-1 gene transcription | 2.5 (nM-1 min-1) | evaluated |
| k4 | First-order rate constant for c-hairy-1 protein synthesis | 4.5 (min-1) | [20] |
| k5 | Threshold constant for activation of c-hairy-1 gene transcription by nuclear NICD | 15 (nM) | evaluated |
| k6 | Maximum rate of Lfng gene transcription | 1.5 (nM-1 min-1) | evaluated |
| k7 | Threshold constant for activation of Lfng gene transcription by nuclear NICD | 10 (nM) | evaluated |
| k8 | First-order rate constant for Lfng protein synthesis | 0.3 (min-1) | [16] |
| k9 | Threshold constant for inhibition of Notch cleavage into NICD by Lfng protein | 0.5 (nM) | [16] |
| k10 | Fixed rate of miRNA synthesis | 0.4 (nM·min-1) | evaluated |
| k11 | Rate for RISC formation | 1 (nM-1 min-1) | evaluated |
| ka | Association constant for c-hariy-1 protein | 1 (nM-1) | [21] |
| kd | Dissociation constant for c-hariy-1 dimer | 4 (min-1) | evaluated |
| d1 | First-order rate of Notch degradation | 2.82 (min-1) | [16] |
| d2 | First-order rate of NICD degradation | 0.06 (min-1) | evaluated |
| d3 | First-order rate of c-hariy-1 mRNA degradation | 0.029 (min-1) | [8] |
| d4 | First-order rate of c-hariy-1 protein degradation | 0.0315 (min-1) | [8] |
| d5 | First-order rate of Lfng mRNA degradation | 0.03 (min-1) | evaluated |
| d6 | First-order rate of Lfng protein degradation | 0.09 (min-1) | evaluated |
| d7 | First-order rate of miRNA degradation | 0.3 (min-1) | evaluated |
| d8 | First-order rate of RISC degradation | 0.1 (nM-1 min-1) | evaluated |
| d9 | First-order rate of c-hariy-1 dimer degradation | 0.12 (min-1) | evaluated |
| m, n, j | Hill coefficient | 2 | [16] |
Period and amplitude of clock identification and computation of their fluctuations (noise)
We use the classic notions of period and amplitude to characterize the oscillatory behavior of the system. First, we introduce the most commonly adopted definitions of peak and trough.
Peak is the highest value obtained by the variable in one oscillation; Trough is the lowest value obtained by the variable in one oscillation. Then, period and amplitude are defined respectively as “peak-to-peak time difference between two cycles” and “difference between peak and trough values”.
Although the concepts of period and amplitude are basic, several issues often make their measurement tricky by wet experiments. For examples, experimental data are generally very noisy due to differences in the observed cells/organisms, random variations due to system stochasticity, and experimental errors. Moreover, they often suffer limited days of observation because of the high costs and/or technique limitations. Thus an alternative method is in silico simulations, which introduce stochasticity in the system and can be repeated many times at low costs. It should be pointed out that the stochastic variations could be so high that these measurements can be problematic. We modify a simple method from Guerriero et al [22] to identify peaks and troughs in noisy data.
The noise (fluctuation) strength for period (ηp) and amplitude (ηa) of the oscillation are quantified as the standard deviations of the distributions of period and amplitude divided by their mean values, respectively.
Results and discussion
The segmentation clock involving oscillations in the Notch signaling pathway was documented experimentally [3,10] and considered theoretically on the basis of negative feedback involving the Hairy-related genes [5,23]. This family of transcription factors negatively regulate their own transcription and in some cases act downstream of Notch (e.g. Lfng). The Notch-dependent negative feedback circuits involves Lfng gene, which acts by inhibiting the Notch pathway [10]. Moreover, the Notch signaling is required for the oscillation of Lfng gene, which appears to play a key role in somitogenesis [14]. As evidenced by experiments, the cyclic Lfng expression is regulated not only at the transcriptional level but also at the post-transcriptional level, which is tightly regulated to ensure proper segmentation clock function [14,15]. To explore the dynamics of the clock, we focus on the network that combines Notch-Lfng feedback control module, a c-hairy-1 autoregulation module, and a miRNA-mediated tuner module.
Oscillatory behaviors of the pathway
The dynamics of the nine variables with default parameters are illustrated in Figure 2A. All variables are initially set to zero; the pathway is clearly sustained oscillatory in all variables with a period close to 90 min which is consistent with the rate of somite formation in chick [11]. Notch oscillates in antiphase with NICD, and RISC oscillates in antiphase with miRNA and Lfng mRNA (Figure 2A). Besides, the proteins undergo similar oscillations and follow their mRNA by about 10 min, which is similar to the experimental observation (about 15 min).
Figure 2.
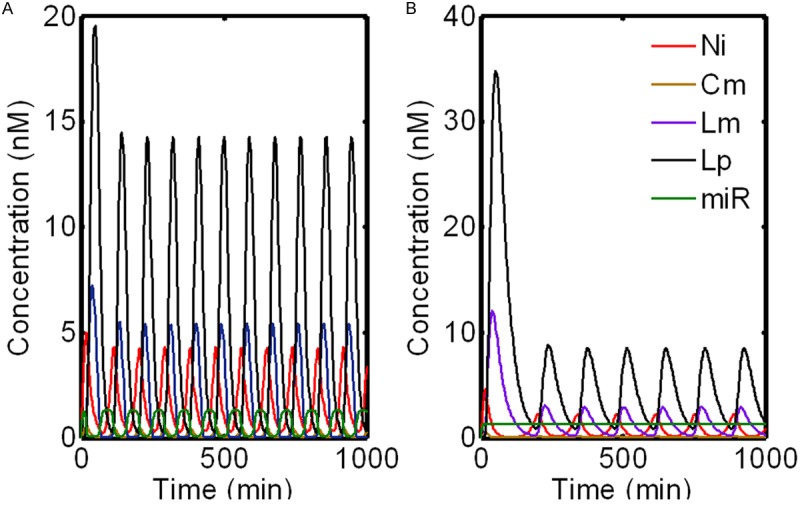
Temporal behavior of the model with miRNA regulation. For clarity, only five components (Ni, Cm, Lm, Lp and miR) included in the system are displayed. A. Dynamic behavior of the system in the presence of miRNA; B. Dynamic behavior of the system in the absence of miRNA.
To investigate the dynamics of the system in the absence of miRNA, we set k11=0. The temporal evolution of the pathway is depicted in Figure 2B. We find that, in the absence of miRNA, the system still keeps the sustained oscillation; this indicates that the oscillations and the stability of the clock system are effectively maintained by the interlocked negative feedback loops. However, the system without miRNA regulation oscillates with a period of about 135 min, which is much longer than that in the miRNA-mediated case. This is supported by the experimental evidence that the c-hairy-1 expression pattern appears oscillatory about 120 min posttransfection with anti-mir-125aMO [15]. It is noted to point out that the amplitudes of some key components such as Lfng mRNA and its protein in the absence of miRNA changes significantly (decrease by about 45% and 41% respectively). This implies that, although loss of mir-125a-5p activity stabilizes the Lfng transcript and prevents its rapid turnover, it also decreases the expression of Lfng. This result is consistent with the finding of Riley and colleagues, who observed very low expression of Lfng in the caudal PSM (below the levels of detection by in situ) after long-term inhibition of mir-125a-5p [15]. This is different from our previous observation that the miR-206 decreased both amplitude and frequency of the mammalian circadian clock oscillation in skeletal muscle [24]. The discrepancy is probably due to the different position of miRNA in the system. Nevertheless, this result is supported by the evidence that blocking interactions between mir-125a-5p and Lfng transcripts in vivo triggers abnormal segmentation and perturbs clock activity [15]. Thus miRNA-mediated regulation of Lfng is essential for proper segmentation during chick somitogenesis.
Sensitivity analysis
Sensitivity analysis is used to understand how a model’s output depends on variations in parameter values or initial conditions. With sensitivity analysis application to the study of biochemical systems, we can capture which parameters are the most or least crucial ones affecting the whole system [24,25]. In this study, local sensitivity analysis (LSA) is employed to measure the effects of small changes in the parameters on the output, since it is widely used in modeling and analysis of biological systems, in which the nominal parameter values are estimated using experimental data or computation [24-26].
A sensitivity analysis for all parameters (Figure 3) of the system including miRNA was conducted, where a total of 225 (25 parameter values×9 non-constant concentrations of species) local sensitivities are calculated and normalized, we find 24 scaled sensitivity absolute values |S| ≥ 0.75, which have significant effects on the system. The concentrations of Lfng mRNA and protein are mainly affected by Notch synthesis (k1) and degradation (d1), inhibition of Notch cleavage into NICD by Lfng protein (k9), hill coefficients (m and n). This confirms that the Notch signaling is prerequisite for the oscillation of Lfng gene [14]. In addition, Lfng mRNA concentration is significantly influenced by Lfng protein synthesis (k8) and degradation (d6), which is probably attributed to the negative feedback control of Lfng protein in Notch-Lfng feedback control module. Notably, miRNA synthesis rate (k10) has relatively small negative effect (S=-0.2) on the concentrations of Lfng mRNA and protein. This reflects a fact that mir-125a-5p modulates the system in a relatively weak manner. Combined with our previous study that miR-206-mediated modulates dynamics of circadian clock in skeleton muscle [24], these results suggest that subtle effects of microRNAs on target genes can have broad effects in developmental situations that have critical requirements for tight posttranscriptional regulation.
Figure 3.
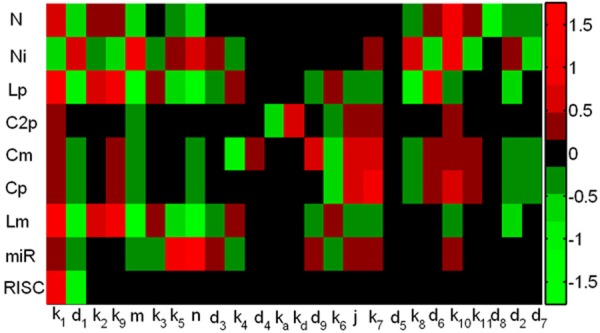
The heatmap of local sensitivities for the concentration of each component with respect to each parameter.
Effect of parameters on the system dynamics
Several mathematical models, based on experimental observations, for segmentation clock have so far been proposed [7,16-18]. These deterministic models predict that the genetic regulatory network undergoes sustained oscillations in an appropriate window of parameter values. Outside of this range, the oscillatory behavior fades out and the system evolves toward a stable steady state; such an evolution is usually accompanied by damped oscillations. To investigate the effect of parameters on the system dynamics, we mainly focus on the parameters (k1, d1, k9, k8 and d6) that exhibit significant effects on the system or species on the basis of LSA.
First, we examine the variation of the dynamics of our system with changes of Notch synthesis rate (k1). k1 is set to 0.375, 0.75, 1.5 (default value) and 3 nM·min-1 respectively, while values of the other parameters are kept fixed. For clarity, only the concentrations of Lfng mRNA and protein are illustrated in Figure 4. With k1 decreases from 1.5 to 0.375 nM·min-1, the sustained oscillations of all molecules vanish and evolve to steady state and such evolution is accompanied by damped oscillations. As k1 increases from 1.5 to 3 nM·min-1, both the period and amplitude of oscillation increase compared to the default case. In contrast, increase of d1 is accompanied with decrease of both period and amplitude of oscillation (data not shown). This is consistent with the fact that the Notch expression is necessary to maintain the normal segmentation and its (at least in part) deficiency can result in perturbed patterns of cyclic and segmental expression of genes in PSM, and also shows its consequent malformation of segmented structures later in development [27].
Figure 4.
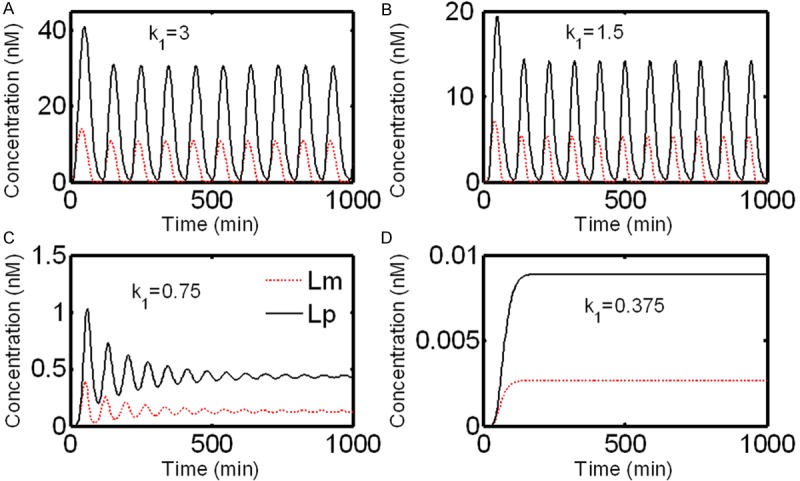
Effect of the variation of parameter k1 on the evolutions of Lfng mRNA and its protein.
Then, we find that only slight variations occur in the amplitude and period of oscillation of Notch and NICD with the moderate change of k9, k8, or d6, indicating that the dynamics of Notch and NICD are robust to the variations of k9, k8, or d6. For example, when k8 increases from 0.3 to 0.9 min-1, the amplitudes and periods of Notch and NICD decrease by about 2% and 2%, and about 9% and 2% respectively. This is supported by a line of evidences that, in the posterior border cells, Lfng regulates Notch binding to Delta1 and transmitting signals intracellularly and Notch-activated cells, thus generating a sharp interface for Notch activity at the segmenter. However, either appropriate knockdown or overexpression of Lfng gene does not affect morphological segmentation significantly [28,29].
Effect of parameter variation of miRNA
Previous investigations suggested that the mir-125a-5p targets evolutionarily conserved sequences in the Lfng 3’-UTR to regulate RNA half-life, ensuring proper clock function [15]. The LSA also demonstrates that the system is sensitive to the variation of the mir-125a-5p production rate (k10). Therefore, we investigate how the variations of the kinetic parameter k10 alter the dynamic behavior (period and amplitude) of the clock system.
The range of parameter k10 that produces sustained oscillations is from 0.0 to 1.0 nM·min-1. Out of this range, the system shows a damped oscillation toward a steady state. Thus we set k10 from 0.0 to 0.8 nM·min-1, with all other parameters fixed. The resultant periods and amplitudes of the system are shown in Figure 5. As k10 increases from 0.0 to 0.8 nM·min-1, the periods and amplitudes of oscillation for NICD, c-hairy-1 mRNA, Lfng mRNA and its protein initially increase, pass through a maximum and eventually decrease (until oscillations disappear above a critical value of k10). A similar behavior of period has been observed for other proteins and mRNAs in mammalian circadian clock [30]. Notably, the periods of these four components are in synchrony and reach the peak with value of about 138 min when k10=0.025 nM·min-1. When k10 increases from 0.025 to 0.8 nM·min-1, the period decreases by half. Different from the periods, their amplitudes display asynchrony. For examples, the amplitudes of NICD and c-hairy-1 mRNA peak when k10=0.4 nM·min-1 while that of Lfng mRNA and its protein show cusps when k10=0.05 nM·min-1. When k10 increases from 0.4 to 0.8 nM·min-1, the amplitudes of NICD and c-hairy-1 mRNA decrease slightly (about 13% and 6%, respectively); the increase of k10 from 0.05 to 0.8 nM·min-1 results in about 4-fold and 6-fold decrease in the amplitudes of Lfng mRNA and its protein, respectively. In summary, the reduction in period and amplitude of the oscillation shows that the dynamics of the system can be affected by mir-125a-5p, suggesting the importance of posttranscriptional controls in biological rhythms.
Figure 5.
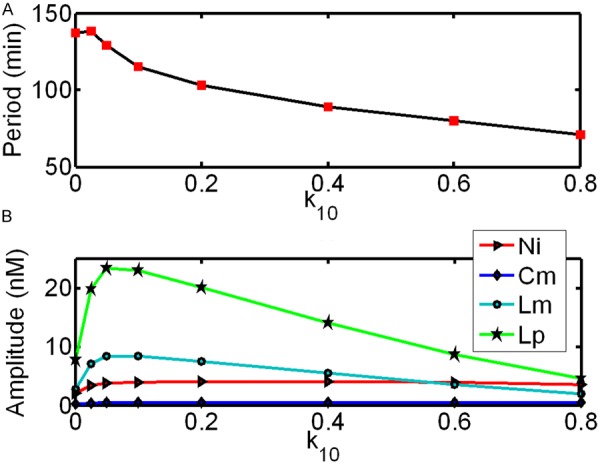
Effect of the variation of the miRNA synthesis rate (k10) on the period and amplitude of the model.
Stochastic behavior
Generally speaking, current experimental data provide an average behavior of a population of cells. However, to investigate the behavior of single cells, which is essential to understand the behavior of the whole organism, is still a challenge for current experiments. Theoretically, given a model that represents the behavior of a cell, each individual stochastic simulation run is one possible evolution of the model and therefore it can be treated as the behavior of one single cell.
In this section, we compare the mean behavior of a stochastic model which is determined by averaging over multiple simulation runs with the deterministic behavior which also, implicitly, is a mean behavior. The average stochastic behavior of the system shows a damped oscillation, indicating that the effect of discreteness and stochasticity on the behavior of the system is obviously different from the deterministic behavior which displays a sustained oscillation in the free-running clock (Figure 6B). This dampened oscillation is also observed in the experimental population data of Hes1 mRNA and protein [8,31] and explains why, after several cycles, the oscillatory expression of Hes1 is not detected by northern or western blot analysis [31]. There may be several reasons for this experimentally observed damping: (1) it is probably attributed to the lack of synchronization in the oscillations in different runs; (2) since a low number of molecule is involved in this system, thus a certain noise (stochastic effects) probably induces the damping oscillation (Figure 6A). This is different from oscillation damping, as described above, which could also be reproduced by a population of deterministic oscillators with different parameters.
Figure 6.
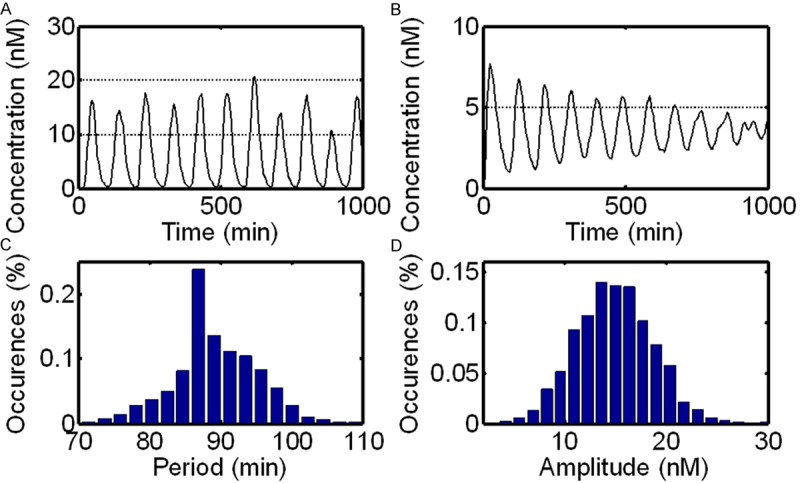
Single and mean behaviors of a stochastic model are shown in (A) and (B) respectively. Distributions of period and amplitude of Lfng protein oscillations over 20,000 minutes in 100 independent runs are illustrated in (C) and (D), respectively.
In addition, we also calculate the distribution profiles of period and amplitude of oscillations. Figure 6C and 6D show the distributions of the period and amplitude of the system in multiple (100) independent runs (20,000 min for each), respectively. Although the average period of the Lfng protein oscillations in an individual run is sometimes slightly longer than 90 min, the average of multiple runs (e.g. cell population) is always very close to 90 min (Figure 6C). The average amplitude is very close to 15 nM (Figure 6D), which is consistent with the results of deterministic simulation.
miRNA in oscillator period and amplitude noise
The segmentation clock is an ensemble of multiple cellular oscillators, located in the unsegmented PSM. The wave-like gene expression patterns generated from the oscillation in the posterior PSM sweep anteriorly and are arrested before all paraxial mesoderm is segmented into somites [3,10]. It is believed that the morphology (e.g. size) of the resulting segments is affected by the period and amplitude of the clock oscillation [32]. Thus in this section, we set out to probe whether the fluctuations of the period and amplitude (“noise”) of this clock oscillation that may cause physiological heterogeneity in populations of cells are influenced by post-transcriptional modulation.
The results of this investigation are striking (Table 2): When miRNA is absent, ηp and ηa are 0.138 and 0.517, respectively, while in the presence of miRNA and k10=0.2 nM·min-1, ηp and ηa become 0.065 and 0.219 respectively, which decrease by half. When k10 increases from 0.2 to 0.4 nM·min-1, both ηp and ηa are slightly changed. When k10=0.8 nM·min-1, ηp and ηa increase to 0.091 and 0.382 respectively. These results indicate that miRNA can reduce the fluctuations of period and amplitude of the clock oscillation by a certain degree. Moreover, the efficiency of the reduction of fluctuations can be adjusted by changing the constant k10 of the miRNA synthesis.
Table 2.
Impact of k10 on noises of period and amplitude of Lfng protein respectively
| k10 (nM·min-1) | Period noise (ηp) | Amplitude noise (ηa) |
|---|---|---|
| 0 | 0.138 | 0.517 |
| 0.2 | 0.065 | 0.219 |
| 0.4 | 0.069 | 0.251 |
| 0.8 | 0.091 | 0.382 |
Conclusions
Here, we investigate the dynamic properties of the segmentation clock involving Notch-Lfng feedback control module, a c-hairy-1 autoregulation module, and a miRNA-mediated tuner module. A sustained periodic oscillation occurs in the segmentation clock system when the series of parameters are set with biologically reasonable values. By deterministic simulation, we find that the mechanism of clock oscillations relies on the interlock of Notch-Lfng feedback control module and a c-hairy-1 autoregulation module. While miRNA synthesis in the regulation of the clock system does not only change the amplitude but also alters the frequency of the oscillations, which explains how the miRNA-mediated regulation of Lfng is essential for proper segmentation during chick somitogenesis. We compare the effect of the various parameters and show that both the occurrence and the period of the oscillations are generally most sensitive to parameters related to synthesis or degradation of Notch protein. We also investigate the noise-induced behavior in the chick segmentation clock. By stochastic simulation, the analysis of individual simulation runs, representing the behavior of individual independent cells, help us to explain the experimentally observed dampening of oscillations. Moreover, the fluctuations of period and amplitude of the clock oscillation can be reduced by post-transcriptional regulation.
Acknowledgements
This work was partly supported by the Program for Changjiang Scholars and Innovative Research Team in Sichuan Agricultural University (PCSIRT) (IRT0848).
Disclosure of conflict of interest
None.
References
- 1.Gossler A, Hrabe de Angelis M. Somitogenesis. Curr Top Dev Biol. 1998;38:225–287. [PubMed] [Google Scholar]
- 2.Cooke J, Zeeman EC. A clock and wavefront model for control of the number of repeated structures during animal morphogenesis. J Theor Biol. 1976;58:455–476. doi: 10.1016/s0022-5193(76)80131-2. [DOI] [PubMed] [Google Scholar]
- 3.Palmeirim I, Henrique D, Ish-Horowicz D, Pourquie O. Avian hairy gene expression identifies a molecular clock linked to vertebrate segmentation and somitogenesis. Cell. 1997;91:639–648. doi: 10.1016/s0092-8674(00)80451-1. [DOI] [PubMed] [Google Scholar]
- 4.Delaune EA, Francois P, Shih NP, Amacher SL. Single-cell-resolution imaging of the impact of Notch signaling and mitosis on segmentation clock dynamics. Dev Cell. 2012;23:995–1005. doi: 10.1016/j.devcel.2012.09.009. [DOI] [PMC free article] [PubMed] [Google Scholar]
- 5.Lewis J, Hanisch A, Holder M. Notch signaling, the segmentation clock, and the patterning of vertebrate somites. J Biol. 2009;8:44. doi: 10.1186/jbiol145. [DOI] [PMC free article] [PubMed] [Google Scholar]
- 6.Oswald F, Tauber B, Dobner T, Bourteele S, Kostezka U, Adler G, Liptay S, Schmid RM. p300 acts as a transcriptional coactivator for mammalian Notch-1. Mol Cell Biol. 2001;21:7761–7774. doi: 10.1128/MCB.21.22.7761-7774.2001. [DOI] [PMC free article] [PubMed] [Google Scholar]
- 7.Cinquin O. Understanding the somitogenesis clock: what’s missing? Mech Dev. 2007;124:501–517. doi: 10.1016/j.mod.2007.06.004. [DOI] [PubMed] [Google Scholar]
- 8.Hirata H, Yoshiura S, Ohtsuka T, Bessho Y, Harada T, Yoshikawa K, Kageyama R. Oscillatory expression of the bHLH factor Hes1 regulated by a negative feedback loop. Science. 2002;298:840–843. doi: 10.1126/science.1074560. [DOI] [PubMed] [Google Scholar]
- 9.Bruckner K, Perez L, Clausen H, Cohen S. Glycosyltransferase activity of Fringe modulates Notch-Delta interactions. Nature. 2000;406:411–415. doi: 10.1038/35019075. [DOI] [PubMed] [Google Scholar]
- 10.Dale JK, Maroto M, Dequeant ML, Malapert P, McGrew M, Pourquie O. Periodic notch inhibition by lunatic fringe underlies the chick segmentation clock. Nature. 2003;421:275–278. doi: 10.1038/nature01244. [DOI] [PubMed] [Google Scholar]
- 11.Pourquie O. The vertebrate segmentation clock. J Anat. 2001;199:169–175. doi: 10.1046/j.1469-7580.2001.19910169.x. [DOI] [PMC free article] [PubMed] [Google Scholar]
- 12.Evrard YA, Lun Y, Aulehla A, Gan L, Johnson RL. lunatic fringe is an essential mediator of somite segmentation and patterning. Nature. 1998;394:377–381. doi: 10.1038/28632. [DOI] [PubMed] [Google Scholar]
- 13.Zhang N, Gridley T. Defects in somite formation in lunatic fringe-deficient mice. Nature. 1998;394:374–377. doi: 10.1038/28625. [DOI] [PubMed] [Google Scholar]
- 14.Serth K, Schuster-Gossler K, Cordes R, Gossler A. Transcriptional oscillation of lunatic fringe is essential for somitogenesis. Genes Dev. 2003;17:912–925. doi: 10.1101/gad.250603. [DOI] [PMC free article] [PubMed] [Google Scholar]
- 15.Riley MF, Bochter MS, Wahi K, Nuovo GJ, Cole SE. Mir-125a-5p-mediated regulation of Lfng is essential for the avian segmentation clock. Dev Cell. 2013;24:554–561. doi: 10.1016/j.devcel.2013.01.024. [DOI] [PMC free article] [PubMed] [Google Scholar]
- 16.Goldbeter A, Pourquie O. Modeling the segmentation clock as a network of coupled oscillations in the Notch, Wnt and FGF signaling pathways. J Theor Biol. 2008;252:574–585. doi: 10.1016/j.jtbi.2008.01.006. [DOI] [PubMed] [Google Scholar]
- 17.Schroter C, Ares S, Morelli LG, Isakova A, Hens K, Soroldoni D, Gajewski M, Julicher F, Maerkl SJ, Deplancke B, Oates AC. Topology and dynamics of the zebrafish segmentation clock core circuit. PLoS Biol. 2012;10:e1001364. doi: 10.1371/journal.pbio.1001364. [DOI] [PMC free article] [PubMed] [Google Scholar]
- 18.Özbudak EM, Lewis J. Notch signalling synchronizes the zebrafish segmentation clock but is not needed to create somite boundaries. PLoS Genet. 2008;4:e15. doi: 10.1371/journal.pgen.0040015. [DOI] [PMC free article] [PubMed] [Google Scholar]
- 19.Gibson MA, Bruck J. Efficient exact stochastic simulation of chemical systems with many species and many channels. The Journal of Physical Chemistry A. 2000;104:1876–1889. [Google Scholar]
- 20.Zeiser S, Muller J, Liebscher V. Modeling the Hes1 oscillator. J Comput Biol. 2007;14:984–1000. doi: 10.1089/cmb.2007.0029. [DOI] [PubMed] [Google Scholar]
- 21.Agrawal S, Archer C, Schaffer DV. Computational models of the Notch network elucidate mechanisms of context-dependent signaling. PLoS Computational Biology. 2009;5:e1000390. doi: 10.1371/journal.pcbi.1000390. [DOI] [PMC free article] [PubMed] [Google Scholar]
- 22.Guerriero ML, Pokhilko A, Fernandez AP, Halliday KJ, Millar AJ, Hillston J. Stochastic properties of the plant circadian clock. J R Soc Interface. 2012;9:744–756. doi: 10.1098/rsif.2011.0378. [DOI] [PMC free article] [PubMed] [Google Scholar]
- 23.Monk NA. Oscillatory expression of Hes1, p53, and NF-kappaB driven by transcriptional time delays. Curr Biol. 2003;13:1409–1413. doi: 10.1016/s0960-9822(03)00494-9. [DOI] [PubMed] [Google Scholar]
- 24.Zhou W, Li Y, Wang X, Wu L, Wang Y. MiR-206-mediated dynamic mechanism of the mammalian circadian clock. BMC Syst Biol. 2011;5:141. doi: 10.1186/1752-0509-5-141. [DOI] [PMC free article] [PubMed] [Google Scholar]
- 25.Wang X, Li Y, Xu X, Wang YH. Toward a system-level understanding of microRNA pathway via mathematical modeling. Biosystems. 2010;100:31–38. doi: 10.1016/j.biosystems.2009.12.005. [DOI] [PubMed] [Google Scholar]
- 26.Yue H, Brown M, He F, Jia J, Kell DB. Sensitivity analysis and robust experimental design of a signal transduction pathway system. International Journal of Chemical Kinetics. 2008;40:730–741. [Google Scholar]
- 27.Mito T, Shinmyo Y, Kurita K, Nakamura T, Ohuchi H, Noji S. Ancestral functions of Delta/Notch signaling in the formation of body and leg segments in the cricket Gryllus bimaculatus. Development. 2011;138:3823–3833. doi: 10.1242/dev.060681. [DOI] [PubMed] [Google Scholar]
- 28.Nikolaou N, Watanabe-Asaka T, Gerety S, Distel M, Koster RW, Wilkinson DG. Lunatic fringe promotes the lateral inhibition of neurogenesis. Development. 2009;136:2523–2533. doi: 10.1242/dev.034736. [DOI] [PMC free article] [PubMed] [Google Scholar]
- 29.Sato Y, Yasuda K, Takahashi Y. Morphological boundary forms by a novel inductive event mediated by Lunatic fringe and Notch during somitic segmentation. Development. 2002;129:3633–3644. doi: 10.1242/dev.129.15.3633. [DOI] [PubMed] [Google Scholar]
- 30.Leloup JC, Goldbeter A. Modeling the mammalian circadian clock: sensitivity analysis and multiplicity of oscillatory mechanisms. J Theor Biol. 2004;230:541–562. doi: 10.1016/j.jtbi.2004.04.040. [DOI] [PubMed] [Google Scholar]
- 31.Kageyama R, Ohtsuka T, Kobayashi T. The Hes gene family: repressors and oscillators that orchestrate embryogenesis. Development. 2007;134:1243–1251. doi: 10.1242/dev.000786. [DOI] [PubMed] [Google Scholar]
- 32.Cooke J. A gene that resuscitates a theory--somitogenesis and a molecular oscillator. Trends Genet. 1998;14:85–88. doi: 10.1016/s0168-9525(98)01396-1. [DOI] [PubMed] [Google Scholar]


