

Abstract
High aldehyde dehydrogenase (ALDH) activity is a marker commonly used to isolate stem cells, particularly breast cancer stem cells (CSCs). Here, we determined that ALDH1A1 activity is inhibited by acetylation of lysine 353 (K353) and that acetyltransferase P300/CBP–associated factor (PCAF) and deacetylase sirtuin 2 (SIRT2) are responsible for regulating the acetylation state of ALDH1A1 K353. Evaluation of breast carcinoma tissues from patients revealed that cells with high ALDH1 activity have low ALDH1A1 acetylation and are capable of self-renewal. Acetylation of ALDH1A1 inhibited both the stem cell population and self-renewal properties in breast cancer. Moreover, NOTCH signaling activated ALDH1A1 through the induction of SIRT2, leading to ALDH1A1 deacetylation and enzymatic activation to promote breast CSCs. In breast cancer xenograft models, replacement of endogenous ALDH1A1 with an acetylation mimetic mutant inhibited tumorigenesis and tumor growth. Together, the results from our study reveal a function and mechanism of ALDH1A1 acetylation in regulating breast CSCs.
Introduction
Aldehyde dehydrogenases (ALDHs) are family members of NAD-dependent enzymes that catalyze the oxidation of aldehydes to acids. To date, 19 ALDH members have been identified in the human genome. They are localized in the cytoplasm, mitochondria, or nucleus and have been implicated in a wide variety of biological processes, including the detoxification of exogenously and endogenously generated aldehydes and the metabolism of vitamin A, alcohol, and ROS. In the ALDH1 family, ALDH1A1 (also known as retinaldehyde dehydrogenase 1, RALHD1) mainly catalyzes the conversion of retinaldehyde to retinoic acid (RA) in vitamin A metabolism (1). RA enters the nucleus and binds to and activates the RA receptors (RARs) or the retinoid X receptors (RXRs), which are nuclear transcription factors that promote target gene expression (2). The genes downstream of RA are involved in many important biological processes, including cell differentiation, proliferation, and lipid metabolism.
Ziouzenkova et al. found that Aldh1a1–/– mice suppressed adipogenesis and reduced adipocyte size in vivo, thereby conferring resistance to high-fat diet–induced obesity (3). It was also reported that ALDH1A1 regulates a thermogenic program in white adipose tissue (4). Recently, abundant evidence has shown that ALDH1A1 activity is a marker for stem cells — primarily hematopoietic stem cells (HSCs) and cancer stem cells (CSCs) — in both normal and malignant tissues (5–7). In 1990, it was first reported that HSCs are highly enriched for ALDH1, while less primitive cells express lower levels of this protein (8). Later, other groups developed a convenient method to measure intracellular ALDH1 activity in live cells (7, 9). To date, this method is widely used to isolate HSCs from blood and CSCs from many tumor types, including leukemia (5, 8, 9), breast cancer (6), melanoma (10), lung cancer (11), and others (12, 13). Ginestier et al. found that ALDH1 is a good marker for malignant human mammary stem cells and that high–ALDH1 activity cell populations leads to substantial tumorigenesis, poor prognosis, and increased metastasis in xenografted mouse models (6). Furthermore, ALDH1A1 expression in breast cancer was found to correlate with advanced disease stage, triple negativity, and poor outcome following neoadjuvant chemotherapy (14).
CSCs are believed to contribute to tumor metastasis and poor prognosis and are defined by 2 key characteristics: the tumorigenic potential to give rise to new tumors and the capacity for self-renewal and differentiation. The balance between self-renewal and differentiation regulates tumor growth and metastasis. The development of specific therapies targeting CSCs offers great potential to improve the survival of cancer patients, especially those with metastatic disease (15, 16).
NOTCH signaling plays an important role in development by modulating cell-fate determination, cell survival, and proliferation (17). The NOTCH receptors, including 4 members in mammals (NOTCH1–4), are activated by binding with a number of ligands (delta-like 1, 3, and 4; jagged 1 and 2). Upon ligand binding, the intracellular NOTCH domain is cleaved and translocates to the nucleus, where it regulates downstream target gene transcription (18). The NOTCH link to cancer was first reported in human T cell leukemia, in which aberrant NOTCH signaling promotes tumorigenesis (19–21). Later, numerous studies established that the NOTCH1 signaling pathway plays a role in breast cancer development (22). Recently, many reports have suggested a function of the NOTCH signaling pathway in promoting self-renewal of mammary stem cells and breast cancer stem cells (23–26). Harrison et al. reported that pharmacologic or genetic inhibition of NOTCH reduced stem cell activity in vitro and tumor formation in vivo. The NOTCH pathway is an appealing therapeutic target in CSC research, and several investigational NOTCH inhibitors are being developed. Here, we report that NOTCH signaling activates ALDH1A1 by inducing deacetylation, thereby promoting breast CSC self-renewal and tumor growth.
Results
Lys-353 acetylation decreases ALDH1A1 enzyme activity.
Given the critical role of ALDH1A1 in stem cells, we sought to investigate its regulation. Recent studies have revealed a broad role of lysine acetylation in metabolic enzyme regulation. We examined previous acetylation proteomic datasets and found that 10 putative acetylation sites were identified in ALDH1A1 by mass spectrometry (ref. 27 and Supplemental Table 1; supplemental material available online with this article; doi:10.1172/JCI76611DS1). To confirm lysine acetylation in ALDH1A1, we ectopically expressed FLAG-tagged ALDH1A1 in HEK293T cells and then treated the cells with trichostatin A (TSA), an inhibitor of histone deacetylases (HDACs) I and II and nicotinamide (NAM), an inhibitor of the sirtuin (SIRT) family of deacetylases. Western blotting with anti–pan-acetyllysine antibody showed that the acetylation of ALDH1A1 was elevated approximately 2.3-fold after treatment with NAM, but not TSA (Figure 1A). This result suggests that ectopically expressed ALDH1A1 is acetylated in cells and is deacetylated by a member of the SIRT family of deacetylases.
Figure 1. Acetylation at Lys-353 decreases ALDH1A1 enzyme activity.

(A) ALDH1A1 was acetylated, and FLAG-ALDH1A1 was transfected into 293T cells, followed by treatment with the deacetylase inhibitor TSA or NAM. ALDH1A1 acetylation was analyzed by Western blotting with pan–anti-acetyllysine antibody (α-Ac). (B) K353 mutation decreased ALDH1A1 acetylation. (C) Specificity of the antibody against K353-acetylated ALDH1A1 was determined. The nitrocellulose membrane was spotted with different amounts of acetylated K353 peptide or unmodified peptide, as indicated, and probed with anti-AcALDH1A1(K353) antibody (α-K353Ac). (D) The anti-AcALDH1A1(K353) antibody recognized WT but not K353R-mutant ALDH1A1. (E) Treatment with NAM increased endogenous ALDH1A1 acetylation at K353. HEPG2 cells were treated with NAM. Endogenous ALDH1A1 protein levels and K353 acetylation were determined. (F) Endogenous ALDH1A1 was acetylated at Lys-353. K353 acetylation of endogenous ALDH1A1 in human liver tissues was determined using the anti-AcALDH1A1(K353) antibody preincubated with or without acetylated K353 peptide. (G and H) Inhibition of SIRT family deacetylases reduced the enzyme activity of WT, but not K353R/Q-mutant, ALDH1A1. FLAG-tagged WT or mutant ALDH1A1 protein was expressed in 293T cells, and transfected cells were treated with or without NAM and then purified by IP using an anti-FLAG antibody. Enzymatic activity was measured and normalized to protein levels. (I) Acetylation at K353 inhibited ALDH1A1 enzyme activity. Recombinant WT and K353-acetylated ALDH1A1 protein were prepared by genetically encoding Nε-acetyllysine in E. coli. UnAc-ALDH1A1, unacetylated ALDH1A1. (G–I) Enzymatic activity was measured and normalized to protein levels. Relative enzyme activity data represent the mean ± SD of triplicate experiments.
We then mutated each of 10 putative acetylation sites individually to arginine (R) or glutamine (Q) and examined their acetylation. Only K353R and K353Q mutations resulted in a significant reduction (80% and 78%, respectively) in ALDH1A1 acetylation (Figure 1B), indicating that K353, which is evolutionarily conserved from D. melanogaster to mammals (Supplemental Figure 1A), is a major acetylation site in ALDH1A1. Mutations of the other 9 putative acetylation sites had little effect on ALDH1A1 acetylation (Supplemental Figure 1B).
To further confirm Lys-353 acetylation of endogenous ALDH1A1, we generated an antibody specifically recognizing K353-acetylated ALDH1A1 by immunizing rabbits with K353-acetylated peptide. The specificity of the anti-AcALDH1A1(K353) antibody was verified, as it recognized the K353-acetylated peptide but not the unacetylated control peptide (Figure 1C). Western blotting with this antibody detected ectopically expressed WT, but only weakly detected K353R-mutant ALDH1A1 (Figure 1D). Moreover, we found that treatment of cells with the deacetylase inhibitor NAM strongly increased K353 acetylation of both ectopically expressed (Supplemental Figure 1C) and endogenous ALDH1A1 (Figure 1E and Supplemental Figure 1D). Using this antibody, we also detected K353 acetylation of endogenous ALDH1A1 in human liver tissue, and this signal was completely blocked by preincubation with the antigen peptide (Figure 1F). Collectively, these studies demonstrate that ALDH1A1 is acetylated at K353 in vivo.
To determine the effect of ALDH1A1 acetylation on its activity, we measured ALDH1A1 enzyme activity in the oxidation of retinaldehyde. Inhibition of deacetylases with NAM treatment decreased ALDH1A1 enzyme activity by 50% (Figure 1G). Moreover, ALDH1A1K353R and ALDH1A1K353Q mutants displayed only 40% and 50%, respectively, of WT activity levels (Supplemental Figure 1E), and treatment with NAM had little effect on the activity of either mutant (Figure 1H). These data suggest that K353 acetylation inhibits ALDH1A1 activity. To definitively demonstrate the effect of K353 acetylation on ALDH1A1 activity, we used the system of genetically encoding Nε-acetyllysine to prepare recombinant proteins in E. coli (28, 29). This expression system produced ALDH1A1 proteins with 100% acetylation at K353 due to the suppression of the K353-UAG stop codon by the Nε-acetyllysine–conjugated amber suppressor tRNA. We prepared both unacetylated and K353-acetylated ALDH1A1 and compared their enzymatic activity. As shown in Figure 1I, K353-acetylated ALDH1A1 abolished catalytic activity. Collectively, these results demonstrate that acetylation at Lys-353 inhibits ALDH1A1 activity. However, we have no evidence to support the notion that acetylation participates in the regulation of ALDH1A1 protein stability (Supplemental Figure 1F).
SIRT2 activates ALDH1A1 by deacetylating Lys-353.
Treatment with the SIRT inhibitor NAM, but not the HDAC inhibitor TSA, increased ALDH1A1 acetylation at K353 (Figure 1A), indicating that a member of the SIRT family of deacetylases is involved in K353 deacetylation. Because ALDH1A1 is a cytoplasmic protein, we coexpressed ALDH1A1 with the 2 cytosolic SIRT deacetylases SIRT1 and SIRT2. We found that SIRT2, but not SIRT1, decreased ALDH1A1 acetylation at Lys-353 (Figure 2A and Supplemental Figure 2A) and increased its activity by 52% (Figure 2A). Furthermore, coexpression of WT SIRT2, but not the inactive H187Y mutant, reduced ALDH1A1 acetylation and increased its enzyme activity (Figure 2B), supporting the idea that SIRT2 deacetylase activity is important in regulating ALDH1A1 K353 acetylation and enzyme activity. Consistent with this observation, knocking down SIRT2 increased K353 acetylation of ectopically expressed ALDH1A1 and significantly (P = 0.0006) decreased its activity by 31% (Figure 2C).
Figure 2. SIRT2 deacetylates and activates ALDH1A1.

(A) SIRT2, not SIRT1, decreased K353 acetylation and increased ALDH1A1 activity. 293T cells were transfected with the indicated plasmids. FLAG-ALDH1A1 was immunoprecipitated, and ALDH1A1 activity was assayed. (B) SIRT2 deacetylase activity was required to increase ALDH1A1 activity. 293T cells were cotransfected with FLAG-ALDH1A1 and SIRT2 WT or the inactive mutant H187Y. (C) SIRT2 knockdown increased K353 acetylation and decreased ALDH1A1 activity. 293T cells were transfected with the indicated plasmids and SIRT2 siRNA oligonucleotides. ALDH1A1 was immunoprecipitated and activity was assayed. ALDH1A1 acetylation at K353 was determined by Western blotting. (A–C) ALDH1A1 activity was normalized to protein levels, and relative enzyme activity data represent the mean ± SD of triplicate experiments. (D) SIRT2 overexpression decreased endogenous ALDH1A1 K353 acetylation. Plasmid expressing SIRT2 WT or the inactive mutant H187Y was transfected into HEPG2 cells, and endogenous K353 acetylation and ALDH1A1 were determined. (E) SIRT2 knockdown increased endogenous ALDH1A1 K353 acetylation. siRNA oligonucleotide targeting SIRT2 was transfected into HEPG2 cells, and the levels of endogenous K353 acetylation, ALDH1A1, and SIRT2 protein were determined by Western blotting. (F and G) ALDH1A1 bound to SIRT2. (F) The indicated plasmids were cotransfected into 293T cells, and ALDH1A1-SIRT2 binding was determined by IP and Western blotting. (G) Interaction of endogenous ALDH1A1 and SIRT2 in HEPG2 cells was determined by IP and Western blotting.
We then ectopically expressed WT and H187Y-mutant SIRT2 in HEPG2 cells and found that only WT SIRT2 downregulated endogenous ALDH1A1 acetylation at Lys-353 (Figure 2D). Conversely, SIRT2 knockdown elevated ALDH1A1 acetylation (Figure 2E), and treatment with the SIRT2 inhibitor AGK2 increased K353 acetylation as well (Supplemental Figure 2B). Next, we examined the physical interaction between SIRT2 and ALDH1A1 and found that ectopically expressed SIRT2 was coprecipitated by ALDH1A1 (Figure 2F). Moreover, endogenous SIRT2 could also be coimmunoprecipitated by the ALDH1A1 antibody in HEPG2 cells (Figure 2G). Together, these observations demonstrate a specific and prominent role of SIRT2 in the K353 deacetylation and enzymatic activation of ALDH1A1.
PCAF acetylates ALDH1A1 at Lys-353 and decreases its enzyme activity.
To identify the acetyltransferase responsible for ALDH1A1 acetylation at K353, we examined 12 lysine acetyltransferases (KATs) and found that only PCAF (p300/CBP-associated factor, also known as KAT2B) regulated ALDH1A1 acetylation at K353 (Figure 3A and Supplemental Figure 3), whereas the other acetyltransferases had little effect (Supplemental Figure 3). Notably, coexpressed PCAF also decreased ALDH1A1 activity by 50% (Figure 3B), while knocking down PCAF reduced K353 acetylation and enhanced ALDH1A1 activity (Figure 3C).
Figure 3. PCAF acetylates ALDH1A1 at Lys-353 and decreases its enzymatic activity.

(A and B) PCAF overexpression increased ALDH1A1 acetylation at K353 and decreased ALDH1A1 activity. 293T cells were transfected with the indicated plasmids, and FLAG-ALDH1A1 was immunoprecipitated for activity and acetylation analysis. (C) Knockdown PCAF decreased K353 acetylation and increased ALDH1A1 activity. 293T cells were transfected with the indicated plasmids and PCAF siRNA oligonucleotides. ALDH1A1 was immunoprecipitated and its activity was assayed. ALDH1A1 acetylation at K353 was determined by Western blotting. (A–C) ALDH1A1 activity was normalized to protein levels, and relative enzyme activity data represent the mean ± SD of triplicate experiments. (D and E) PCAF increased endogenous ALDH1A1 K353 acetylation. Plasmid expressing PCAF was transfected into HEPG2 cells (D), or siRNA oligonucleotide targeting PCAF was transfected into HEPG2 cells (E). Endogenous K353 acetylation, ALDH1A1, and PCAF protein levels were determined by Western blotting. (F and G) ALDH1A1 bound with PCAF. (F) HEK293T cells were transfected with the indicated plasmids. ALDH1A1-PCAF binding was determined by IP and Western analysis. (G) Endogenous ALDH1A1-PCAF interaction in HEPG2 cells was determined by IP and Western blotting.
To determine whether PCAF could affect endogenous ALDH1A1 acetylation, we analyzed K353 acetylation of endogenous ALDH1A1 in HEPG2 cells after either ectopic expression or knockdown of PCAF. We found that PCAF ectopic expression increased K353 acetylation of endogenous ALDH1A1 (Figure 3D), while PCAF knockdown reduced ALDH1A1 acetylation (Figure 3E). Furthermore, both ectopically expressed and endogenous ALDH1A1 and PCAF displayed physical interaction, as determined by co-IP experiments (Figure 3, F and G). Together, these results indicate that PCAF regulates ALDH1A1 enzyme activity by acetylating K353.
Acetylation of ALDH1A1 inhibits ALDH1+ cell populations and CSC self-renewal in breast cancer.
Ginestier et al. found that high ALDH1 activity (labeled as the ALDH1+ cell population) is a good marker of breast CSCs (6). Considering the effect of K353 acetylation on ALDH1A1 activity, we investigated the functions of ALDH1A1 acetylation in regulating CSC self-renewal. We identified ALDH1+ cell populations in the breast cancer cell line MDA-MB-468 using aldehyde dehydrogenase–dependent fluorophore (ALDEFLUOR) assay and found that about 15% of cells showed high ALDH1 activity (Figure 4A), which is close to what has previously been reported (30). Then, we sorted the ALDH1+ cell populations (10%) and ALDH1– cell populations (10%) according to fluorescence intensity and determined their mammosphere-forming ability, which is a commonly used assay for self-renewal. We found that the ALDH1+ cell population showed much stronger mammosphere-forming activity, consistent with the enrichment of CSCs in this cell population (P = 0.0002, Figure 4B). Compared with the ALDH1– cell population, the ALDH1+ cell population showed higher ALDH1A1 protein expression levels, but decreased K353 acetylation (Figure 4C). The relative level of K353-acetylated ALDH1A1 versus total ALDH1A1 in ALDH1+ cells was reduced by 81% when compared with that in the ALDH1– cell population. We observed a similar effect in the breast cancer cell line MCF-7 (Supplemental Figure 4).
Figure 4. K353 acetylation of ALDH1A1 decreases in ALDH1+ breast cancer cells.

(A) ALDEFLUOR FACS analysis of the breast cancer cell line MDA-MB-468. Cells incubated with ALDEFLUOR substrate and the ALDH-specific inhibitor DEAB were used to establish baseline fluorescence (ALDH1–) and to define the ALDH1+ region (ALDH1+) (left panel). Incubation of MDA-MB-468 cells with ALDEFLUOR substrate in the absence of DEAB induced a fluorescence shift defining the ALDH1+ cell population (right panel). (B and C) ALDH1+ cell populations (top 10% of cells with high fluorescence) and ALDH1– cell populations (bottom 10% of cells with low fluorescence) were sorted from MDA-MB-468 cells. Sorted ALDH1+ and ALDH1– cells were measured for mammosphere formation (B) and K353 acetylation of ALDH1A1 (K353Ac) (C). Relative K353 acetylation indicates the intensity ratio of K353Ac/ALDH1A1 protein levels. (D) Representative FACS analysis of primary breast cancer cells by ALDEFLUOR assay. (E and F) ALDH1+ cell populations (top 3% of cells with high fluorescence) and ALDH1– cell populations (bottom 10% of cells with low fluorescence) were sorted from primary breast cancer cells, followed by a mammosphere-forming assay (E) and Western blotting with the indicated antibodies (F). (B and E) Data represent the mean ± SD of triplicate experiments for the number of mammospheres per 10,000 transplanted cells.
These data suggest that decreased K353 acetylation, along with increased expression of ALDH1A1, contribute to increased ALDH activity in the ALDH1+ cell population. Interestingly, we also detected decreased PCAF expression and increased SIRT2 expression in the ALDH1+ cell population (Figure 4C and Supplemental Figure 4), which may contribute to decreased K353 acetylation of ALDH1A1.
In order to confirm the decrease in K353-acetylated ALDH1A1 in breast CSCs, we repeated these experiments using several breast cancer tissue samples. Primary breast cancer cells were cultured, and stem cells were separated by ALDEFLUOR assay. The results showed that the ALDH1+ cell population, which has self-renewal properties, accounted for about 3.5% of cells in one of the breast cancer tissues (Figure 4, D and E). Importantly, we found that SIRT2 protein levels were substantially increased in ALDH1+ cells isolated from primary tumors when compared with the levels in ALDH1– cells (Figure 4F). Associated with this increase in SIRT2, the relative level of K353-acetylated ALDH1A1 versus total ALDH1A1 was reduced by 77%. Our results demonstrate a strong correlation between reduced ALDH1A1 acetylation and breast CSCs.
To determine the function of ALDH1A1 and its acetylation in breast CSCs, ALDH1A1 was knocked down in MDA-MB-468 cells. We found that ALDH1A1 knockdown reduced the ALDH1+ cell population and mammosphere-forming activity by more than 80% and 90%, respectively (Figure 5, A and B), indicating that ALDH1A1 plays an important role in CSC self-renewal. We then stably reintroduced WT or K353R/Q mutants into ALDH1A1-knockdown cells and determined the mammosphere-forming activity of these cells. Cells that expressed the K353Q or K353R mutants showed reduced ALDH1+ cell populations and decreased mammosphere-forming activity compared with those that reexpressed WT ALDH1A1 (Figure 5, C and D). Collectively, these results demonstrate that K353 acetylation of ALDH1A1 could inhibit self-renewal of breast CSCs by reducing ALDH1A1 activity.
Figure 5. Acetylation of ALDH1A1 at Lys-353 inhibits ALDH1+ cell populations and CSC self-renewal.

(A and B) ALDH1A1 plays important roles in regulating ALDH1+ cell populations and maintaining stem cell properties in breast cancer cells. ALDH1A1 was stably knocked down in MDA-MB-468 cells, and knockdown efficiency was determined by Western blotting (A). ALDEFLUOR (A) and mammosphere-forming (B) assays were performed. (C and D) ALDH1A1K353R and ALDH1A1K353Q mutants were defective in supporting ALDH1+ cell populations and the mammosphere-forming activity of MDA-MB-468. The FLAG-tagged shRNA-resistant WT ALDH1A1 or K353R/Q mutant was reintroduced into MDA-MB-468 cells, stably knocking down ALDH1A1. Protein levels of reexpressed ALDH1A1 were determined by Western blotting (C). ALDH1+ cell populations (C) and mammosphere formation (D) were measured. (E) Inhibiting SIRT2 decreased ALDH1+ cell populations. Primary breast cancer cells were treated with AGK2, a SIRT2 inhibitor, for the indicated concentrations and times. Data represent the mean ± SD of triplicate experiments for relative ALDH1+ cell populations and number of mammosphere per 10,000 transplanted cells.
Considering the roles of SIRT2 in regulating ALDH1A1 K353 acetylation and that SIRT2 protein levels were increased in ALDH1+ cell populations, we investigated whether SIRT2 regulates breast CSCs. Our data showed that treatment with the SIRT2 inhibitor AGK2 decreased ALDH1+ cell populations in primary breast cancer cells, and this effect depended on the treatment duration and concentration of AGK2 (Figure 5E and Supplemental Figure 5). Collectively, our data show that K353 acetylation of ALDH1A1 regulates ALDH1+ cell populations and CSC self-renewal in breast cancer.
NOTCH activates ALDH1A1 by inducing deacetylation to promote breast CSCs.
The NOTCH signaling pathway is known to regulate self-renewal of breast CSCs (23–26). This led us to determine whether K353 acetylation of ALDH1A1 is modulated by NOTCH signaling. FLAG-ALDH1A1 was transfected into 293T cells, and the transfected cells were treated with the NOTCH inhibitor DAPT (a γ-secretase inhibitor that blocks activation of the NOTCH intracellular domain). As shown in Figure 6A, inhibition of NOTCH signaling increased K353 acetylation and reduced the enzymatic activity of ALDH1A1. DAPT treatment also reduced SIRT2 protein levels, but had no effect on PCAF. Furthermore, when the NOTCH pathway was activated by DLL4 (the extracellular ligand of NOTCH), ALDH1A1 K353 acetylation was reduced, while SIRT2 protein levels were increased (Figure 6B). Concomitant with the reduced K353 acetylation, ALDH1A1 activity was increased. These data suggest that NOTCH signaling can activate ALDH1A1 by decreasing K353 acetylation. To confirm NOTCH signaling in the regulation of ALDH1A1, we cotransfected 293T cells with ALDH1A1 and NOTCH1 intracellular domain (NICD1), which is an activate component of the NOTCH pathway. We found that coexpressed NICD1 induced deacetylation and activation of ectopically expressed ALDH1A1 (Figure 6C).
Figure 6. NOTCH activates ALDH1A1 by inducing deacetylation.

(A–C) NOTCH signaling promoted SIRT2 expression, decreased K353 acetylation, and activated ALDH1A1. FLAG-tagged ALDH1A1 was expressed in 293T cells, followed by treatment with (A) DAPT (an inhibitor of NOTCH) and (B) DLL4 (extracellular ligand for activating the NOTCH pathway) for 24 hours, or (C) 293T cells were cotransfected with FLAG-ALDH1A1 and FLAG-NICD1 (NOTCH1 intracellular domain, activated NOTCH1) plasmids. ALDH1A1 was purified by IP, followed by enzyme assay and Western blotting with the indicated antibodies. (A–C) Enzymatic activity was measured and normalized to protein levels, and relative enzyme activity data represent the mean ± SD of triplicate experiments. (D and E) The NOTCH signaling pathway increased SIRT2 and decreased endogenous ALDH1A1 K353 acetylation of breast cancer cells. MDA-MB-468 cells or primary breast cancer cells were treated with DAPT or DLL4 for the indicated durations. Endogenous NICD1, PCAF, SIRT2, and ALDH1A1 protein levels and K353 acetylation were determined by Western blotting.
We then investigated the effect of the NOTCH pathway on endogenous ALDH1A1 acetylation. MDA-MB-468 cells, MCF-7 cells, and primary human breast cancer cells were treated with DAPT or DLL4 for the indicated durations in Figure 6, D and E). Inhibition of the NOTCH pathway reduced SIRT2 protein levels and increased ALDH1A1 K353 acetylation in breast cancer cells (Figure 6D and Supplemental Figure 6A). Activation of the NOTCH pathway by DLL4 elevated SIRT2 levels and decreased ALDH1A1 K353 acetylation (Figure 6E and Supplemental Figure 6B). Furthermore, when NICD1 was transfected into MDA-MB-468 cells, SIRT2 protein levels were increased along with concomitant ALDH1A1 deacetylation (Supplemental Figure 6C). In addition, we determined the SIRT2 mRNA levels and found that they were upregulated by NOTCH signaling (Supplemental Figure 6D). To gain mechanistic insights, we performed ChIP on endogenous NOTCH signaling transcription factors (HES1, HEY1, and HEY2) and investigated whether they bound to the SIRT2 promoter. However, the ChIP-PCR experiments did not detect significant binding of HES1, HEY1, or HEY2 to the SIRT2 promoter (Supplemental Figure 6E), indicating that NOTCH signaling may regulate SIRT2 expression indirectly. Together, the above data suggest a model in which NOTCH signaling activates ALDH1A1 via deacetylation by inducing SIRT2 expression.
To address the function of the NOTCH pathway in breast CSC populations and self-renewal properties, we treated MDA-MB-468 cells with DAPT or DLL4 and then determined the presence of ALDH1+ cell populations and mammosphere formation. The results showed that inhibiting the NOTCH pathway with DAPT reduced both ALDH1+ cell populations and stem cell self-renewal (Figure 7, A and B), whereas, activating the NOTCH pathway with DLL4 increased ALDH1+ cell populations and promoted stem cell self-renewal (Figure 7, C and D). To investigate the effect of the NOTCH pathway on ALDH1+ cell populations in vivo, we performed xenografting using MDA-MB-468 cells in mammary fat pads of NOD/SCID mice. DAPT was intratumorally injected at a concentration of 20 mg/kg/mouse every week. Six weeks later, all tumors were collected and digested into a single-cell suspension, followed by the determination of ALDH1+ cell populations and K353 acetylation. The results indicate that inhibition of the NOTCH pathway with DAPT treatment not only reduced ALDH1+ cell populations, but also increased K353 acetylation in vivo (Figure 7E). These data are consistent with previous reports of a positive role for NOTCH in breast CSCs (25). Notably, compared with MDA-MB-468 cells reexpressing WT ALDH1A1, cells reexpressing K353R or K353Q mutants showed a blunted response to DAPT and DLL4 treatment in mammosphere-forming assays (Figure 7F), further supporting the notion that NOTCH signaling promotes breast CSCs, at least in part by regulating K353 acetylation of ALDH1A1.
Figure 7. Mutation of the K353 acetylation site in ALDH1A1 inhibits NOTCH signaling to promote breast CSCs.

(A and B) Inhibition of NOTCH signaling reduced ALDH1+ cell populations and mammosphere formation. MDA-MB-468 cells were treated with 20 μM DAPT, followed by ALDEFLUOR assay (A) and mammosphere-forming assay (B). (C and D) Activation of the NOTCH signaling pathway promoted breast CSCs. MDA-MB-468 cells were treated with 10 nM DLL4, followed by ALDEFLUOR assay (C) and mammosphere-forming assay (D). (E) NOTCH inhibitor treatment enhanced K353 acetylation and decreased ALDH1+ cell populations in vivo. Xenografting into mammary fat pads was performed using 104 MDA-MB-468 cells, and xenograft tumors were treated with DAPT (20 mg/kg/mouse) every week. After 6 weeks, ALDH1A1, K353 acetylation, and ALDH1+ cell populations in tumors were analyzed. (F) K353R/Q mutation blocked the effect of the NOTCH signaling pathway on mammosphere formation. MDA-MB-468 cells reexpressing ALDH1A1WT, ALDH1A1K353R, and ALDH1A1K353Q mutants were treated with DAPT or DLL4 at the indicated concentrations, and mammosphere formation was measured. Data represent the mean ± SD of triplicate experiments for relative ALDH1+ cell populations and number of mammospheres per 10,000 transplanted cells.
ALDH1A1 Lys-353 acetylation inhibits breast cancer tumorigenesis and tumor growth.
CSCs possess tumorigenic potential and contribute to relapse and metastasis. Self-renewal, the most important property of CSCs, regulates tumor growth and metastasis. We determined the effect of ALDH1A1 K353 acetylation on cell proliferation and tumorigenesis. To this end, endogenous ALDH1A1 in MDA-MB-468 breast cancer cells was knocked down by shRNA, followed by reintroduction of the shRNA-resistant WT ALDH1A1 and K353Q mutant (Figure 5, A and C). Notably, cells expressing the ALDH1A1K353Q mutant showed reduced cell proliferation (Figure 8A), indicating that ALDH1A1 K353 acetylation inhibits breast cancer cell proliferation.
Figure 8. Lys-353 acetylation of ALDH1A1 inhibits breast tumorigenesis and tumor growth.

(A) ALDH1A1K353Q was compromised to support breast cancer cell proliferation. MDA-MB-468 cells with stably knocked down ALDH1A1 and reintroduced ALDH1A1WT or ALDH1A1K353Q were seeded into each well. Cell numbers were counted every 48 hours (error bars represent the mean ± SD of triplicate experiments). (B) MDA-MB-468 cells expressing ALDH1A1K353Q showed reduced TIC frequencies. Xenografting into mammary fat pads was performed using different concentrations (5 × 10⁵, 5 × 10⁴, 5 × 10³, 1 × 10³, 200, and 40 cells per mouse) of endogenous ALDH1A1-knockdown MDA-MB-468 cells that expressed either ALDH1A1WT or ALDH1A1K353Q. After 3 weeks, their tumorigenesis was determined, and TIC frequencies were calculated with L-Calc software. (C) ALDH1A1K353Q was defective in supporting tumor growth in vivo. Tumor sizes from the mouse injected with 5 × 10⁵, 5 × 10⁴, and 5 × 10³ cells were monitored every week after tumor formation. Tumor growth derived from the mice injected with 5 × 10³ cells is shown. (B and C) P values were calculated by Student’s t test. (D) Schematic illustration of NOTCH-mediated ALDH1A1 K353 deacetylation in the promotion of breast CSCs. High ALDH1A1 activity is required to maintain breast CSCs. K353 acetylation reduces ALDH1A1 enzyme activity, thereby inhibiting self-renewal of breast CSCs. NOTCH signaling is elevated in breast CSCs, and NOTCH induces SIRT2 to deacetylate and activate ALDH1A1 to maintain breast CSCs. NICD, NOTCH intracellular domain; Ac, acetylation.
To address the significance of K353 acetylation in tumorigenesis, we injected varying numbers (from 40 cells to 5 × 10⁵ cells) of the MDA-MB-468 cells expressing WT and K353Q-mutant ALDH1A1 into mouse mammary fat pads and monitored tumor formation. After 3 weeks, the acetylation mimetic K353Q-mutant–expressing MDA-MB-468 cells displayed weaker tumorigenic potential than did the WT ALDH1A1–expressing cells (Table 1) and lower tumor-initiating cell (TIC) frequencies (Figure 8B). These results support a role for ALDH1A1 acetylation in CSCs.
Table 1.
MDA-MB-468 cells expressing ALDH1A1K353Q show reduced tumorigenic potential
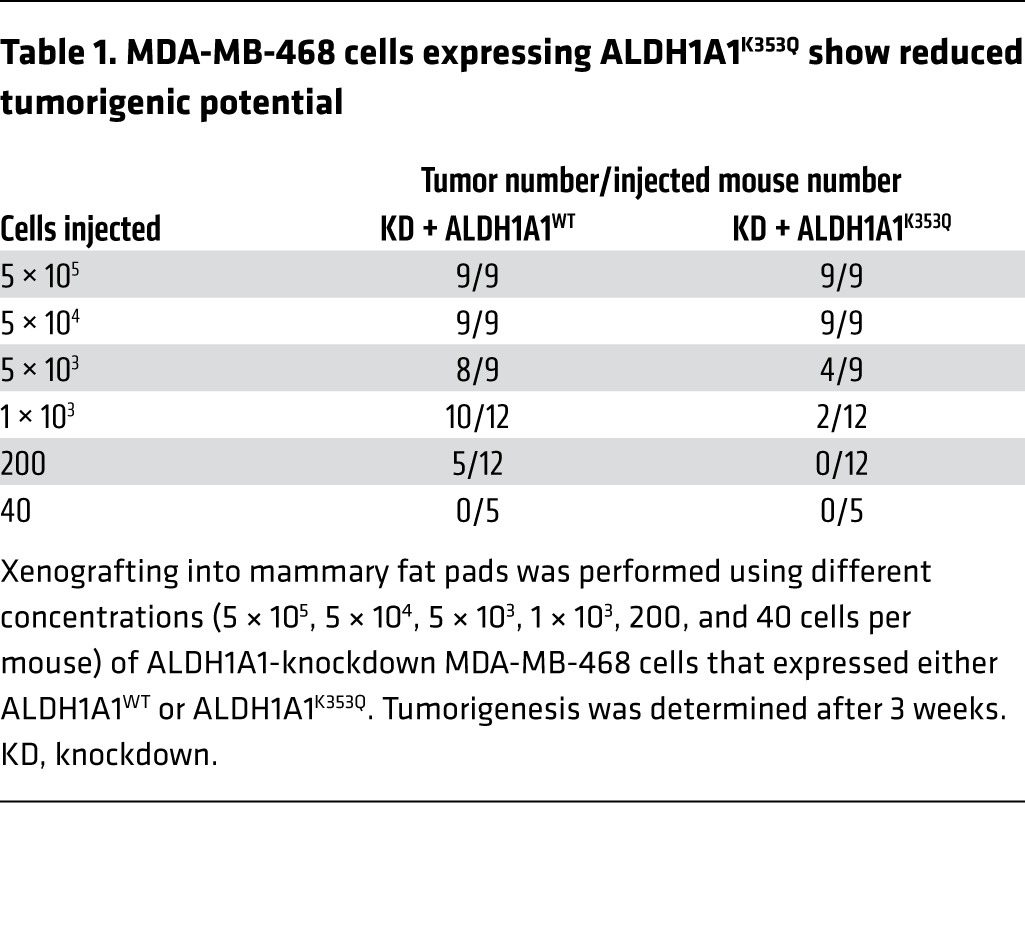
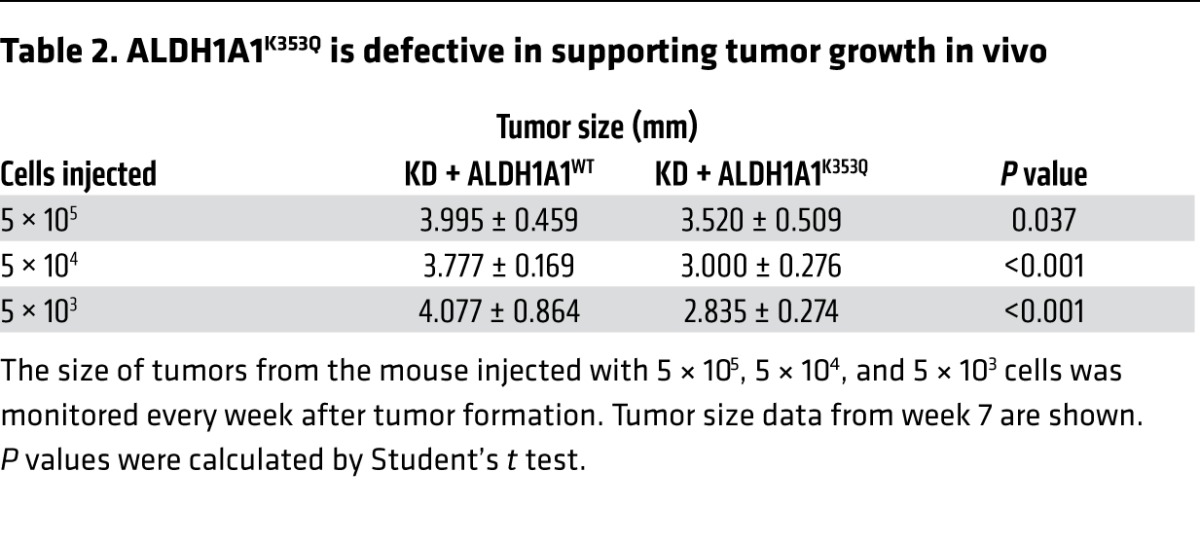
We also evaluated tumor growth in the mouse injected with different quantities of MDA-MB-468 cells and found that the tumors that developed from cells expressing K353Q-mutant ALDH1A1 grew at a significantly (P < 0.001 when measured 4, 6, and 7 weeks after the initial injection and P = 0.05 when measured at 5 weeks, respectively) slower rate than did the tumors that developed from cells expressing WT ALDH1A1 (Figure 8C). Then, the mice were sacrificed, the tumors were collected and weighed, and we found that regardless of the number of cells initially injected, there was a reduction in both the size (Table 2) and weight (Supplemental Figure 7A and Supplemental Table 2) of the tumors that developed from K353Q-expressing cells compared with those that developed from WT ALDH1A1–expressing cells. Reintroduced ALDH1A1 expression levels were similar between the WT and K353Q-mutant ALDH1A1 cells (Supplemental Figure 7B). Taken together, our data demonstrate that K353 acetylation of ALDH1A1 inhibits self-renewal of breast CSCs, thereby suppressing breast cancer tumorigenesis and tumor growth.
Table 2.
ALDH1A1K353Q is defective in supporting tumor growth in vivo
Discussion
High ALDH1 activity is a property commonly associated with CSCs. Breast cancer is the first solid tumor in which CSCs were defined (31). Besides the CD44+CD24–/lo markers, ALDH1+ was also identified as a key marker for breast CSCs. Although the precise mechanism of ALDH1A1 in CSC maintenance is not fully understood, it likely involves the metabolism of chemicals that are involved in stem cell maintenance and/or differentiation. High ALDH1A1 activity in stem cells could be maintained by increased protein expression and/or posttranslational activation. However, posttranslational regulation of ALDH1A1 in CSCs has not been investigated. In this report, we identified a novel mechanism of ALDH1A1 regulation at the posttranslational level. Our data show that ALDH1A1 protein is modified by lysine acetylation, and its enzyme activity is inhibited by Lys 353 acetylation. Moreover, we identified PCAF and SIRT2 as the enzymes responsible for ALDH1A1 acetylation and deacetylation, respectively (Figure 8D). This report establishes lysine acetylation as an in vivo biochemical mechanism in the regulation of ALDH1A1 activity.
In the breast cancer cells, we found that the cell population with high mammosphere-forming potential showed higher ALDH activity than did the cell population with low mammosphere-forming potential. Furthermore, our findings indicate that ALDH1A1 isolated from the ALDH1+ stem cells had reduced Lys-353 acetylation. We made similar observations in primary breast CSCs, which also displayed low ALDH1A1 Lys-353 acetylation. Therefore, lysine acetylation appears to play an important role in the regulation of ALDH1A1 activity and thereby modulates breast CSCs. Moreover, cells expressing the acetylated Lys-353 mimetic mutant ALDH1A1 displayed lower cell-proliferative and tumor-initiating potential, consistent with the reduced tumor growth we observed in the mouse xenograft experiments.
In our study, activation of ALDH1A1 by SIRT2-mediated deacetylation showed tumor-promoting effects. However, Kim et al. reported that SIRT2-deficient mice develop mammary tumors (32), suggesting that SIRT2 has tumor-suppressive function. A large number of studies have shown that 1 gene can function as either a tumor suppressor or an oncogene in a cell context–dependent manner; e.g., SHP2 and PAR3 can be either tumor suppressors or oncogenes (33–37). SIRT2 is known to have many physiological substrates. The effect of SIRT2 on cellular function would depend on the dominant SIRT2 substrates involved in the specific cellular process. It is possible that the deacetylation of some substrates is growth promoting, while deacetylation of other substrates is growth inhibitory. Therefore, whether SIRT2 acts as a tumor suppressor or an oncogene may be cell context dependent.
A wide range of hormones and morphogens, such as NOTCH, WNT, and sonic hedgehog, have been implicated in stem cell maintenance and differentiation. The function of NOTCH signaling in stem cells has been demonstrated in several cell types, including hematopoietic, neural, and mammary stem cells. Harrison et al. reported that the NOTCH signaling pathway promotes self-renewal of mammary stem cells and breast CSCs (25). Interestingly, our study reveals that NOTCH signaling can regulate ALDH1A1 acetylation. Mechanistically, this appeared to be mediated by NOTCH signaling–induced SIRT2 expression. Inhibition of NOTCH signaling decreased SIRT2 levels and concomitantly increased ALDH1A1 Lys-353 acetylation. Likewise, NOTCH activation induced expression of SIRT2, which could then deacetylate and activate ALDH1A1 (Figure 8D). NOTCH promoted CSC self-renewal through transcriptional regulation of downstream target genes participating in cell-fate determination, cell survival, and proliferation. Our data suggest that NOTCH signaling promotes breast CSCs, at least in part by activating ALDH1A1 through the indirect induction of SIRT2. Further studies are needed to clarify whether the regulation of ALDH1A1 acetylation is unique to NOTCH signaling or broadly involved in other signaling pathways in stem cell regulation.
Methods
Cell culture and transfection.
HEK293T cells were cultured in DMEM (Invitrogen) supplemented with 10% newborn calf serum (HyClone), 100 units/ml penicillin, and 100 μg/ml streptomycin (Invitrogen). HEPG2, MCF-7, and MDA-MB-468 cells were cultured in DMEM (Invitrogen) with 10% FCS (HyClone), 100 units/ml penicillin, and 100 μg/ml streptomycin (Invitrogen). All cell lines were purchased from the Cell Bank of the Chinese Academy of Sciences (CAS). Cell transfection was performed using Lipofectamine 2000 (Invitrogen) or calcium phosphate methods.
Primary breast cancer cell cultures.
Fresh breast cancer tissues were cut into pieces and digested by collagenase for 2 hours. Cells were washed 3 times and collected by centrifugation and then cultured in DMEM (Invitrogen) with 10% FCS (HyClone), 100 units/ml penicillin, and 100 μg/ml streptomycin (Invitrogen).
Cell lysis, immunological procedures, and antibodies.
Cells were lysed in an NP40 buffer containing 50 mM Tris-HCl (pH 7.5), 150 mM NaCl, 0.3% Nonidet P-40, 1 μg/ml aprotinin, 1 μg/ml leupeptin, 1 μg/ml pepstatin, and 1 mM PMSF. Cell lysate (1 ml) was incubated with anti-FLAG M2-agarose for 3 hours at 4°C, then the beads were washed 3 times with lysis buffer. Proteins were blotted following standard protocol. Antibodies specific to FLAG (F7425; Sigma-Aldrich), HA (sc-7392; Santa Cruz Biotechnology Inc.), ALDH1A1 (12035; Cell Signaling Technology), Myc (Shanghai Genomics), PCAF (Epitomics), NICD1 (ab8925; Abcam), SIRT2 (NBP1-76879; Novus Biologicals), HES1 (11988S; Cell Signaling Technology), HEY1 (ab154077; Abcam), HEY2 (sc-28747; Santa Cruz Biotechnology Inc.), and β-actin (A00702; GenScript) were purchased. Polyclonal antibodies against pan–anti-acetyllysine (antigen: chemically modified acetylated chicken OVA) were generated by immunizing rabbits at Shanghai Genomics. To generate the acetyllysine 353–specific polyclonal antibody against ALDH1A1, synthetic peptide DKEQYDK(Ac)ILDLIES was coupled to KLH as an antigen to immunize rabbits (Shanghai Genomics). Antiserum was collected after 4 doses of immunization and characterized by Western blotting under various conditions, such as peptide competition.
ALDH1A1 enzyme assay.
FLAG-ALDH1A1 was ectopically expressed, immunoprecipitated, and eluted using 250 μg/ml FLAG peptide. The eluent was added to a reaction buffer containing 10 mM sodium pyrophosphate (pH 7.5), 1 mM NAD+, and 100 μM all-trans-retinaldehyde. The change in absorbance (340 nm) resulting from NADH production was measured using a Hitachi F-4600 fluorescence spectrophotometer.
Genetically encoding Nε-acetyllysine in recombinant proteins.
To generate a homogenously K353-acetylated ALDH1A1 construct, we used a 3-plasmid system as previously described (38). This system allows for the site-specific incorporation of N-acetyllysine by way of a Methanosarcina barkeri acetyl-lysyl-tRNAsynthetase/tRNACUA pair that recognizes the amber codon. We cloned WT ALDH1A1 into pTEV-8 (pET-21b backboned with the TEV cleavage site), producing a C-terminal His6-tagged construct, and incorporated an amber codon at Lys-353 (AAA to TAG by site-directed mutagenesis). Bacteria were cultured to an OD600 of 0.6 and then induced with 0.5 mM IPTG. The amber construct was overexpressed in Luria-Bertani (LB) culture medium with spectinomycin (50 μg/ml), kanamycin (50 μg/ml), and ampicillin (150 μg/ml), in addition to 2 mM N-acetyllysine (Sigma-Aldrich) and 20 mM nicotinamide at the time of induction. Both unacetylated and K353-acetylated ALDH1A1 proteins were purified for enzyme activity analysis.
RNA interference.
SIRT2 or PCAF knockdown was carried out using synthetic siRNA oligonucleotides (SIRT2 target sequences: ATGACAACCTAGAGAAGTA; PCAF target sequences: GCAATTCCCTCAACCAGAAACCAAA) synthesized by Genepharma Inc. Cell transfections were performed using Lipofectamine 2000 (Invitrogen).
ALDEFLUOR assay and separation of ALDH1+ cell populations by FACS.
The ALDEFLUOR kit (STEMCELL Technologies) was used to isolate cell populations with high ALDH1 enzymatic activity in breast cancer cells. Briefly, 2 × 10⁶/ml cells were suspended in ALDEFLUOR assay buffer containing BODIPY-aminoacetaldehyde and incubated at 37°C for 40 minutes. For each sample, cell aliquots were incubated with or without 50 mM diethylaminobenzaldehyde (DEAB), an ALDH-specific inhibitor. ALDEFLUOR staining was detected using the FITC channel of FACS. The sorting gates were established using background fluorescence levels of the DEAB control sample. For MDA-MB-468 and MCF-7 cells, the top 10% of cells with the highest fluorescence were collected as the ALDH1+ cell population, while the bottom 10% of cells were collected as the ALDH1– cell population. For primary breast cancer cells, the top 3% of cells with the highest fluorescence were collected as the ALDH1+ cell population, while the bottom 10% of cells were collected as the ALDH1– cell population.
Mammosphere-forming assay.
Cells were digested by trypsin and disrupted into single-cell suspensions. Then, cells were cultured in MammoCult medium (STEMCELL Technologies), including 4 μg/ml heparin (STEMCELL Technologies), 0.48 μg/ml hydrocortisone (STEMCELL Technologies), 100 units/ml penicillin, and 100 μg/ml streptomycin in Corning Ultra-Low Attachment 6-well plates at a density of 2 × 10⁴ cells/2 ml for 7 to 10 days every generation. Mammospheres were imaged and counted under phase-contrast microscopy for 3 generations. Only the mammospheres exceeding 50 μm in diameter were counted.
Knocking down and putting back.
An shRNA retrovirus targeting human ALDH1A1 was constructed using the following sequences: ALDH1A1, 5′-CCGGGGACAATGCTGTTGAATTTGCCTCGAGGCAAATTCAACAGCATTGTCCTTTTTG-3′. A control shRNA retrovirus was constructed using the following sequences: 5′-CCGGGAGGCTTCTTATAAGTGTTTACTCGAGTAAACACTTATAAGAAGCCTCTTTTTG-3′. Retroviruses were produced using a 3-plasmid packaging system. Briefly, the pMKO.1-puro vector expressing the shRNA sequence was cotransfected into 293T cells together with vectors expressing the gag and vsvg genes. Retroviral supernatant was harvested 36 hours after initial plasmid transfection and mixed with polybrene (8 μg/ml) to increase the infection efficiency. For transduction, MDA-MB-468 cells were infected with 5 ml retrovirus and 5 ml fresh medium for 48 hours and then selected in puromycin (2 μg/ml) for 1 week.
To reintroduce ALDH1A1, FLAG-tagged human ALDH1A1WT, ALDH1A1K353R, and ALDH1A1K353Q containing 3 silent nucleotide substitutions in the sequence corresponding to the shRNA-targeted region were cloned into the retroviral vector (pQCXIH) and were cotransfected into 293T cells together with vectors expressing the gag and vsvg genes. Retroviral supernatant was used to infect the ALDH1A1-knockdown MDA-MB-468 cells. The infected cells were selected with hygromycin (2 μg/ml) for 2 weeks.
ChIP.
To determine the interaction between the NOTCH pathway transcriptional factors (HES1, HEY1, and HEY2) and the SIRT2 promoter, a ChIP assay was performed as previously described (39). MCF-7 cells were treated with formaldehyde and lysed using sonication. Endogenous HES1, HEY1, and HEY2 in cell lysate were immunoprecipitated with the specific antibody overnight at 4°C. After washing several times, DNAs coprecipitated with these transcriptional factors were eluted, and the cross-link was reversed before being used as a template for quantitative PCR (SYBR Premix Ex Taq, Tli RNase H Plus; Clontech, Takara Bio Company) with several pairs of primers targeting the SIRT2 promoter regions (primer information refers to Supplemental Figure 6E).
Cell proliferation.
MDA-MB-468 stable cell lines with ALDH1A1 knockdown and reexpressed shRNA-resistant WT or K353Q-mutant ALDH1A1 were prepared. Cells (1 × 10⁵) were seeded in triplicate on plates, and cell numbers were counted every 2 days over an 8-day period.
Mouse breast cancer model.
Female 5- to 6-week-old NOD/SCID mice were used to assess the in vivo stem cell properties and tumor growth of breast cancer as described previously (6, 40). MDA-MB-468 cells, which knocked down ALDH1A1 and expressed ALDH1A1WT or ALDH1A1K353Q, were injected into the mammary fat pads of female mice. Cell concentrations included 5 × 10⁵, 5 × 10⁴, 5 × 10³, 1 × 10³, 200, and 40 cells/100 μl/mouse containing 50 μl Matrigel (BD Biosciences), and reexpressing ALDH1A1WT or ALDH1A1K353Q cells were paired and injected into each side of the NOD/SCID mice. Then, the mice were observed for tumorigenesis and tumor growth. Seven weeks later, all mice were sacrificed and tumors were harvested, followed by photographing and weighing. For in vivo NOTCH-inhibitor treatment experiments, 104 MDA-MB-468 cells were injected into the mammary fat pads of NOD/SCID mice. The NOTCH inhibitor DAPT (Selleck) was intratumorally injected at a concentration of 20 mg/kg/week. After 6 weeks, all tumors were collected and digested into a single-cell suspension, followed by ALDEFLUOR assay and Western blot analysis.
Statistics.
Statistical analyses were performed using GraphPad Prism software (GraphPad Software), with significance set at the 5% level. P values were calculated by 2-tailed Student’s t test, and results are represented as the mean ± SD. A P value of less than 0.05 was considered statistically significant. TIC frequencies were calculated using L-Calc software (STEMCELL Technologies).
Study approval.
All animal studies were reviewed and approved by the Animal Welfare Committee of Shanghai Medical College, Fudan University. The procedures related to human subjects were approved by the ethics committee of Shanghai Tenth People’s Hospital, Tong Ji University (approval number SHSY-IEC-pap3.0/14-13). Written informed consent was obtained from all patients whose tumor tissues were used in this study.
Supplementary Material
Acknowledgments
We thank the members of the Fudan Molecular and Cell Biology laboratory for discussions throughout this study. We also thank the Biomedical Core Facility of Fudan University for their technical support and Guo-Ping Zhang for the FACS assay. This work was supported by grants from the Ministry of Science and Technology (MOST) 973 (2015CB910401, 2011CB910601, and 2012CB910103); the National Natural Science Foundation of China (NSFC) (31271454, 81430057, and 81225016); the Shanghai Key Basic Research Program (12JC1401100); the “100 Talents” program of Shanghai Health (XBR2011041); the “Scholar of Dawn” program of the Shanghai Education Commission; and the Shanghai Outstanding Academic Leader program (13XD1400600, to Q.Y. Lei). This work was also supported by the 985 Program; the Shanghai Leading Academic Discipline Project (B110); and by NIH grants (CA108941 and CA132809, to K.L. Guan, and GM067113 and CA163834, to Y. Xiong).
Footnotes
Note regarding evaluation of this manuscript: Manuscripts authored by scientists associated with Duke University, The University of North Carolina at Chapel Hill, Duke-NUS, and the Sanford-Burnham Medical Research Institute are handled not by members of the editorial board but rather by the science editors, who consult with selected external editors and reviewers.
Conflict of interest: The authors have declared that no conflict of interest exists.
Reference information:J Clin Invest. 2014;124(12):5453–5465. doi:10.1172/JCI76611.
References
- 1.Vasiliou V, Nebert DW. Analysis and update of the human aldehyde dehydrogenase (ALDH) gene family. Hum Genomics. 2005;2(2):138–143. doi: 10.1186/1479-7364-2-2-138. [DOI] [PMC free article] [PubMed] [Google Scholar]
- 2.Maden M. Retinoid signalling in the development of the central nervous system. Nat Rev Neurosci. 2002;3(11):843–853. doi: 10.1038/nrn963. [DOI] [PubMed] [Google Scholar]
- 3.Ziouzenkova O, et al. Retinaldehyde represses adipogenesis and diet-induced obesity. Nat Med. 2007;13(6):695–702. doi: 10.1038/nm1587. [DOI] [PMC free article] [PubMed] [Google Scholar]
- 4.Kiefer FW, et al. Retinaldehyde dehydrogenase 1 regulates a thermogenic program in white adipose tissue. Nat Med. 2012;18(6):918–925. doi: 10.1038/nm.2757. [DOI] [PMC free article] [PubMed] [Google Scholar]
- 5.Gerber JM, et al. A clinically relevant population of leukemic CD34(+)CD38(–) cells in acute myeloid leukemia. Blood. 2012;119(15):3571–3577. doi: 10.1182/blood-2011-06-364182. [DOI] [PMC free article] [PubMed] [Google Scholar]
- 6.Ginestier C, et al. ALDH1 is a marker of normal and malignant human mammary stem cells and a predictor of poor clinical outcome. Cell Stem Cell. 2007;1(5):555–567. doi: 10.1016/j.stem.2007.08.014. [DOI] [PMC free article] [PubMed] [Google Scholar]
- 7.Storms RW, et al. Isolation of primitive human hematopoietic progenitors on the basis of aldehyde dehydrogenase activity. Proc Natl Acad Sci U S A. 1999;96(16):9118–9123. doi: 10.1073/pnas.96.16.9118. [DOI] [PMC free article] [PubMed] [Google Scholar]
- 8.Kastan MB, Schlaffer E, Russo JE, Colvin OM, Civin CI, Hilton J. Direct demonstration of elevated aldehyde dehydrogenase in human hematopoietic progenitor cells. Blood. 1990;75(10):1947–1950. [PubMed] [Google Scholar]
- 9.Jones RJ, et al. Assessment of aldehyde dehydrogenase in viable cells. Blood. 1995;85(10):2742–2746. [PubMed] [Google Scholar]
- 10.Luo Y, et al. ALDH1A isozymes are markers of human melanoma stem cells and potential therapeutic targets. Stem Cells. 2012;30(10):2100–2113. doi: 10.1002/stem.1193. [DOI] [PMC free article] [PubMed] [Google Scholar]
- 11.Jiang F, et al. Aldehyde dehydrogenase 1 is a tumor stem cell-associated marker in lung cancer. Mol Cancer Res. 2009;7(3):330–338. doi: 10.1158/1541-7786.MCR-08-0393. [DOI] [PMC free article] [PubMed] [Google Scholar]
- 12.Kim MP, et al. ALDH activity selectively defines an enhanced tumor-initiating cell population relative to CD133 expression in human pancreatic adenocarcinoma. PLoS One. 2011;6(6):e20636. doi: 10.1371/journal.pone.0020636. [DOI] [PMC free article] [PubMed] [Google Scholar]
- 13.Visus C, et al. Identification of human aldehyde dehydrogenase 1 family member A1 as a novel CD8+ T-cell-defined tumor antigen in squamous cell carcinoma of the head and neck. Cancer Res. 2007;67(21):10538–10545. doi: 10.1158/0008-5472.CAN-07-1346. [DOI] [PubMed] [Google Scholar]
- 14.Khoury T, et al. Aldehyde dehydrogenase 1A1 expression in breast cancer is associated with stage, triple negativity, and outcome to neoadjuvant chemotherapy. Mod Pathol. 2012;25(3):388–397. doi: 10.1038/modpathol.2011.172. [DOI] [PMC free article] [PubMed] [Google Scholar]
- 15.Clarke MF, Fuller M. Stem cells and cancer: two faces of eve. Cell. 2006;124(6):1111–1115. doi: 10.1016/j.cell.2006.03.011. [DOI] [PubMed] [Google Scholar]
- 16.Visvader JE, Lindeman GJ. Cancer stem cells in solid tumours: accumulating evidence and unresolved questions. Nat Rev Cancer. 2008;8(10):755–768. doi: 10.1038/nrc2499. [DOI] [PubMed] [Google Scholar]
- 17.Artavanis-Tsakonas S, Rand MD, Lake RJ. Notch signaling: cell fate control and signal integration in development. Science. 1999;284(5415):770–776. doi: 10.1126/science.284.5415.770. [DOI] [PubMed] [Google Scholar]
- 18.Bray SJ. Notch signalling: a simple pathway becomes complex. Nat Rev Mol Cell Biol. 2006;7(9):678–689. doi: 10.1038/nrm2009. [DOI] [PubMed] [Google Scholar]
- 19.Radtke F, Raj K. The role of Notch in tumorigenesis: oncogene or tumour suppressor? Nat Rev Cancer. 2003;3(10):756–767. doi: 10.1038/nrc1186. [DOI] [PubMed] [Google Scholar]
- 20.Ellisen LW, et al. TAN-1, the human homolog of the Drosophila notch gene, is broken by chromosomal translocations in T lymphoblastic neoplasms. Cell. 1991;66(4):649–661. doi: 10.1016/0092-8674(91)90111-B. [DOI] [PubMed] [Google Scholar]
- 21.Pear WS, et al. Exclusive development of T cell neoplasms in mice transplanted with bone marrow expressing activated Notch alleles. J Exp Med. 1996;183(5):2283–2291. doi: 10.1084/jem.183.5.2283. [DOI] [PMC free article] [PubMed] [Google Scholar]
- 22.Dievart A, Beaulieu N, Jolicoeur P. Involvement of Notch1 in the development of mouse mammary tumors. Oncogene. 1999;18(44):5973–5981. doi: 10.1038/sj.onc.1202991. [DOI] [PubMed] [Google Scholar]
- 23.Bouras T, et al. Notch signaling regulates mammary stem cell function and luminal cell-fate commitment. Cell Stem Cell. 2008;3(4):429–441. doi: 10.1016/j.stem.2008.08.001. [DOI] [PubMed] [Google Scholar]
- 24.Hoey T, et al. DLL4 blockade inhibits tumor growth and reduces tumor-initiating cell frequency. Cell Stem Cell. 2009;5(2):168–177. doi: 10.1016/j.stem.2009.05.019. [DOI] [PubMed] [Google Scholar]
- 25.Harrison H, et al. Regulation of breast cancer stem cell activity by signaling through the Notch4 receptor. Cancer Res. 2010;70(2):709–718. doi: 10.1158/0008-5472.CAN-09-1681. [DOI] [PMC free article] [PubMed] [Google Scholar]
- 26.Parr C, Watkins G, Jiang WG. The possible correlation of Notch-1 and Notch-2 with clinical outcome and tumour clinicopathological parameters in human breast cancer. Int J Mol Med. 2004;14(5):779–786. doi: 10.3892/ijmm.14.5.779. [DOI] [PubMed] [Google Scholar]
- 27.Choudhary C, et al. Lysine acetylation targets protein complexes and co-regulates major cellular functions. Science. 2009;325(5942):834–840. doi: 10.1126/science.1175371. [DOI] [PubMed] [Google Scholar]
- 28.Neumann H, et al. A method for genetically installing site-specific acetylation in recombinant histones defines the effects of H3 K56 acetylation. Mol Cell. 2009;36(1):153–163. doi: 10.1016/j.molcel.2009.07.027. [DOI] [PMC free article] [PubMed] [Google Scholar]
- 29.Neumann H, Peak-Chew SY, Chin JW. Genetically encoding N(epsilon)-acetyllysine in recombinant proteins. Nat Chem Biol. 2008;4(4):232–234. doi: 10.1038/nchembio.73. [DOI] [PubMed] [Google Scholar]
- 30.Croker AK, et al. High aldehyde dehydrogenase and expression of cancer stem cell markers selects for breast cancer cells with enhanced malignant and metastatic ability. J Cell Mol Med. 2009;13(8):2236–2252. doi: 10.1111/j.1582-4934.2008.00455.x. [DOI] [PMC free article] [PubMed] [Google Scholar]
- 31.Al-Hajj MW, et al. Prospective identification of tumorigenic breast cancer cells. Proc Natl Acad Sci U S A. 2003;100(7):3983–3988. doi: 10.1073/pnas.0530291100. [DOI] [PMC free article] [PubMed] [Google Scholar]
- 32.Kim HS, et al. SIRT2 maintains genome integrity and suppresses tumorigenesis through regulating APC/C activity. Cancer Cell. 2011;20(4):487–499. doi: 10.1016/j.ccr.2011.09.004. [DOI] [PMC free article] [PubMed] [Google Scholar]
- 33.Bard-Chapeau EA, et al. Ptpn11/Shp2 acts as a tumor suppressor in hepatocellular carcinogenesis. Cancer Cell. 2011;19(5):629–639. doi: 10.1016/j.ccr.2011.03.023. [DOI] [PMC free article] [PubMed] [Google Scholar]
- 34.Chan RJ, Feng GS. PTPN11 is the first identified proto-oncogene that encodes a tyrosine phosphatase. Blood. 2007;109(3):862–867. doi: 10.1182/blood-2006-07-028829. [DOI] [PMC free article] [PubMed] [Google Scholar]
- 35.Tartaglia M, et al. Somatic mutations in PTPN11 in juvenile myelomonocytic leukemia, myelodysplastic syndromes and acute myeloid leukemia. Nat Genet. 2003;34(2):148–150. doi: 10.1038/ng1156. [DOI] [PubMed] [Google Scholar]
- 36.McCaffrey LM, Montalbano J, Mihai C, Macara IG. Loss of the Par3 polarity protein promotes breast tumorigenesis and metastasis. Cancer Cell. 2012;22(5):601–614. doi: 10.1016/j.ccr.2012.10.003. [DOI] [PMC free article] [PubMed] [Google Scholar]
- 37.Iden S, et al. Tumor type-dependent function of the par3 polarity protein in skin tumorigenesis. Cancer Cell. 2012;22(3):389–403. doi: 10.1016/j.ccr.2012.08.004. [DOI] [PubMed] [Google Scholar]
- 38.Zhao D, et al. Lysine-5 acetylation negatively regulates lactate dehydrogenase A and is decreased in pancreatic cancer. Cancer Cell. 2013;23(4):464–476. doi: 10.1016/j.ccr.2013.02.005. [DOI] [PMC free article] [PubMed] [Google Scholar]
- 39.Lan F. A histone H3 lysine 27 demethylase regulates animal posterior development. Nature. 2007;449(7163):689–694. doi: 10.1038/nature06192. [DOI] [PubMed] [Google Scholar]
- 40.Jain RK, Munn LL, Fukumura D. Mammary fat pad tumor preparation in mice. Cold Spring Harb Protoc. 2012;2012(10):1115–1116. doi: 10.1101/pdb.prot071514. [DOI] [PubMed] [Google Scholar]
Associated Data
This section collects any data citations, data availability statements, or supplementary materials included in this article.