Abstract
Metastasis is associated with poor prognosis in breast cancer patients. Not all cancer cells within a tumor are capable of metastasizing. The microRNA-200 (miR-200) family, which regulates the mesenchymal-to-epithelial transition, is enriched in the serum of patients with metastatic cancers. Ectopic expression of miR-200 can confer metastatic ability to poorly metastatic tumor cells in some settings. Here, we investigated whether metastatic capability could be transferred between metastatic and nonmetastatic cancer cells via extracellular vesicles. miR-200 was secreted in extracellular vesicles from metastatic murine and human breast cancer cell lines, and miR-200 levels were increased in sera of mice bearing metastatic tumors. In culture, murine and human metastatic breast cancer cell extracellular vesicles transferred miR-200 microRNAs to nonmetastatic cells, altering gene expression and promoting mesenchymal-to-epithelial transition. In murine cancer and human xenograft models, miR-200–expressing tumors and extracellular vesicles from these tumors promoted metastasis of otherwise weakly metastatic cells either nearby or at distant sites and conferred to these cells the ability to colonize distant tissues in a miR-200–dependent manner. Together, our results demonstrate that metastatic capability can be transferred by the uptake of extracellular vesicles.
Introduction
Metastasis is the major cause of breast cancer mortality (1). Metastasis involves multiple steps — local tissue invasion, intravasation, survival in the circulation, extravasation, seeding of distant tissues, and colonization at the distant sites. The ability of tumor cells to complete each step of the invasion-metastasis cascade is determined by genetic and epigenetic alterations that tumor cells acquire during tumorigenesis. Colonization of distant organs is the rate-limiting process that most disseminated cancer cells are unable to achieve. Indeed, breast cancer cells can form latent micrometastases that do not expand and take over host tissues for years or even decades. It is not known whether metastatic traits can be propagated between tumor cells.
For some epithelial tumors, the first steps in metastasis may be enhanced by mesenchymal changes. The invasive edges of some tumors express mesenchymal genes that enhance motility and invasivity (1). However, in other tumors, including breast cancers, invasion may be mediated by basal epithelial cells (2). To be able to expand in distant tissues to form macroscopic colonies, invading tumor cells may need to have epithelial traits (3). In fact, most metastases display the epithelial properties of the primary tumor. A master regulator of the epithelial-to-mesenchymal transition (EMT) is the microRNA-200 (miR-200) family of miRNAs. Members of the miR-200 family (miR-200a, miR-200b, miR-200c, miR-429, miR-141), which share the same seed sequence and the same targets, suppress the EMT and enhance the reverse process, mesenchymal-to-epithelial transition (MET). This is accomplished in large part by inhibiting the expression of Zeb1 and Zeb2, transcriptional repressors of many epithelial genes (4).
The isogenic mouse triple-negative breast cancer (TNBC) cell lines, 67NR, 168FARN, 4TO7, and 4T1, derived from a single spontaneous mammary tumor in BALB/c mice (5), have different metastatic capabilities and are an appropriate system for studying molecular requirements for metastasis. When implanted in the mammary fat pad, 67NR cells do not leave the primary tumor, 168FARN cells metastasize to draining lymph nodes, and 4TO7 cells disseminate from the blood into the lungs, but are unable to colonize distant tissues. Only 4T1 cells colonize and form macrometastases. Upregulation of the miR-200 family is a salient feature that distinguishes 4T1 from the other cells in this series (6). In fact, ectopic expression of the miR-200c/miR-141 cluster in 4TO7 cells enables them to colonize the lungs (6, 7). Overexpression of miR-200 also promotes the colonization of certain human breast cancer cell-line xenografts (8, 9).
Tumor cells release a large amount of extracellular vesicles (EVs). These include exosomes, which are small vesicles (30–100 nm) derived from multivesicular bodies, and ectosomes, which are large vesicles (100–1000 nm) that bud from the cellular membrane (10). Tumor EVs deliver bioactive molecules, including miRNAs, to other cells in their surroundings or to distant sites; these bioactive molecules can promote tumorigenesis. Tumor cell–derived EVs can transform benign cells, suppress immune responses to tumors, cause stromal differentiation of fibroblasts and angiogenesis, and help establish a premetastatic niche (10). Blocking exosome release by silencing Rab27a/b or nSMase2 impairs tumor growth and metastasis (11). Highly malignant tumor cells can transfer EVs to less aggressive tumor cells to promote proliferation and in vitro invasion and migration (10). It is not known whether tumor EVs can confer metastatic capacity to poorly metastatic cells in vivo.
Extracellular fluids contain miRNA-bearing EVs (12). miRNA levels in the blood correlate with the clinical classification and prognosis of certain cancers and may be useful cancer biomarkers. miRNAs within EVs are protected from serum RNases and hence are particularly stable. They can be transferred between cells. Some miRNAs, including miR-9, miR-21, miR-29a, miR-92a, miR-150, and miR-210, secreted in EVs by tumor cells, are delivered to endothelial cells or macrophages to promote angiogenesis and prometastatic inflammatory responses. However, it is unclear whether EV-delivered miRNAs can transfer metastatic traits to other tumor cells in vivo.
The miR-200 family is elevated in the circulation of ovarian, prostate, pancreatic, and metastatic colorectal cancer patients (13–16). miR-200 family abundance correlates with metastasis and relapse in breast cancer (7, 17). Moreover, miR-200s are enriched in the serum of metastatic breast cancer patients with circulating tumor cells and in the cerebrospinal fluid of breast cancer patients with brain metastases (18, 19). Although these studies suggest that extracellular miR-200s are associated with breast cancer metastasis, they do not show that circulating miR-200 miRNAs are functional.
Here, we show that metastatic 4T1 cells, but not poorly metastatic 4TO7 cells, secrete miR-200 in EVs. We then show that both nearby and distant poorly metastatic 4TO7 cells take up miR-200 from 4T1 EVs and become metastatic in a miR-200–dependent manner. Furthermore, the same phenomenon occurs in human breast cancer cells — EVs from highly metastatic HER2+ MCF10CA1a and basal-A TNBC BPLER cells deliver miR-200s to poorly metastatic basal-B TNBC MDA–MB-231 cells to promote lung colonization in immunocompromised mice. Thus, circulating miRNAs are not just biomarkers of malignancy, but function in vivo to promote metastasis.
Results
miR-200 miRNAs are secreted in EVs by metastatic mouse cancer cells.
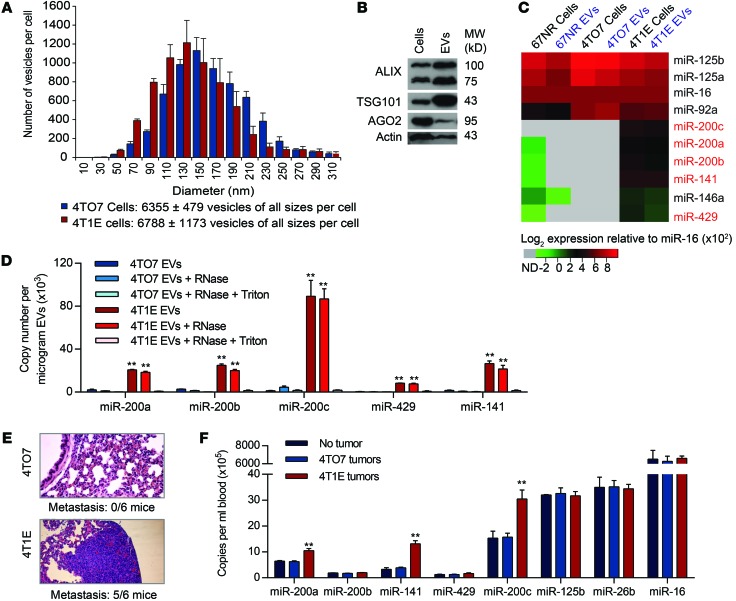
An epithelial subclone of 4T1 (4T1E), selected for high E-cadherin expression, is especially malignant, uniformly forming tumors that metastasize to the lungs (20). To compare EVs secreted by 4TO7 and 4T1E, EVs in the supernatants of 2-day subconfluent cultures were analyzed by the NanoSight particle-tracking system (Figure 1A). On average, each 4T1E cell released 6,788 EVs in 48 hours. The number of 4TO7 EVs was similar. EVs from both cells had a similar size distribution, with diameters of 50 to 310 nm that suggest secretion of both exosomes and ectosomes (Figure 1A). 4T1E EVs, purified by ultracentrifugation, were enriched for EV markers TSG101 and ALIX relative to their levels in total cell lysates (Figure 1B). AGO2, associated with mature miRNAs within cells, was also detected in 4T1E EVs, although it was underrepresented in EVs compared with cell lysates. The level of selected miRNAs, including the miR-200 family, was compared using the Firefly Cellular miRNA Assay in EVs and cell lysates of 4T1E, 4TO7, and 67NR cells (Figure 1C). miRNA levels for each sample were normalized to the level of the abundant miRNA miR-16, expressed similarly in the 3 cell lines (6). All miR-200 family members (miR-200a, miR-200b, miR-200c, miR-429, and miR-141) were enriched in 4T1E, compared with 67NR and 4TO7, in both vesicles and cells. The level of each miR-200 miRNA in EVs paralleled its abundance in the host cell. Other abundant miRNAs, miR-92a, miR-125a, and miR-125b, were expressed similarly in the 3 cell lines and secreted at levels that corresponded to their cellular abundance (Figure 1C). Hence, the secretion of miRNAs into EVs reflects cellular miRNA levels and does not appear to be selective. Consistent results were obtained in 4 independent cell passages (Supplemental Figure 1A; supplemental material available online with this article; doi:10.1172/JCI75695DS1).
Figure 1. miR-200 microRNAs are secreted in EVs from 4T1E cells.
(A) Size distribution of EVs released by 4TO7 and 4T1E cells in 48-hour culture supernatants (3 experiments). (B) Immunoblot of proteins in 4T1E cells and their EVs (repeated twice). (C) Relative expression (log2) of miRNAs quantified by Firefly Cellular miRNA Assay and normalized using miR-16. Each value is an average of 4 independent experiments with values presented from low (green) to high (red). Undetected miRNAs (ND) are gray. (D) miR-200 copy number in 4T1E or 4TO7 EVs from cells, untreated or treated with RNase A and/or Triton X-100, quantified by TaqMan assay (3 experiments). (E) Representative images of lung sections, stained with H&E, from mice bearing 4TO7 or 4T1E mammary tumors (n = 6 mice). The number of mice with lung metastases is indicated below the images. Original magnification, ×10. (F) miRNA copy number in EVs in the circulation of tumor-free mice or mice bearing 4TO7 or 4T1E tumors. Blood was collected when primary tumors reached 15 mm in diameter. EVs were purified from the serum, and miRNAs were quantified by TaqMan assay (3 experiments). **P < 0.01, Student’s t test.
The enrichment of miR-200 family miRNAs in 4T1E EVs was confirmed using quantitative reverse-transcription PCR (qRT-PCR) (Figure 1D). All miR-200 family members were detected in 4T1E, but not 4TO7, EVs. miR-200c was the most abundant, with approximately 90,000 copies/μg of 4T1E EVs. To test whether the enriched miRNAs were derived from intact EVs, samples were treated with RNase A in the presence or absence of Triton X-100. RNase treatment did not substantially alter miR-200 family levels unless Triton X-100 was present, indicating that the secreted miRNAs were encapsulated within a membrane. RNA was also analyzed separately from EVs that were small (20–200 nm) and large (200–800 nm), the approximate sizes of exosomes and ectosomes, respectively. miR-200 miRNAs were contained in both types of EVs at similar levels, but only in those from 4T1E (Supplemental Figure 1B).
miR-200 miRNAs are enriched in the circulation of mice bearing 4T1E tumors.
To determine whether miR-200 miRNAs are secreted from 4T1E cells in vivo, miRNA abundance was assessed by qRT-PCR in EVs purified from the serum of control mice without tumors or mice bearing mammary fat-pad 4TO7 and 4T1E tumors, sacrificed when the tumors approached 15 mm in diameter. At that time, 5 of 6 mice bearing 4T1E tumors, but none of 6 4TO7 tumor–bearing mice, developed lung metastases (Figure 1E). miR-200a, miR-200c, and miR-141 were increased by 2- to 4-fold in the serum of 4T1E tumor–bearing mice compared with uninjected control mice or mice harboring 4TO7 tumors (Figure 1F). The levels of control miRNAs were similar in all mice. Thus, 4T1E cells secrete miR-200 family miRNAs in EVs both in vitro and in vivo.
miR-200 miRNAs are transferred from 4T1E to 4TO7 cells.
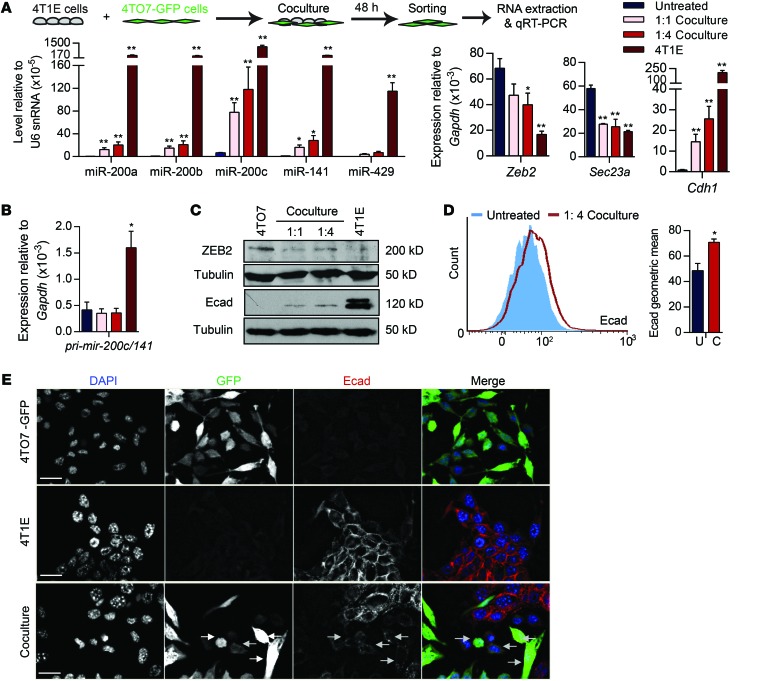
To test whether miR-200 miRNAs are transferred from 4T1E to 4TO7 cells, we cocultured the cell lines at 1:1 or 1:4 (4TO7:4T1E) ratios. 4TO7 cells stably expressing GFP (4TO7-GFP) were used to sort each cell line. After 48 hours, the levels of all miR-200s, especially miR-200c, in 4TO7 cells increased (Figure 2A). Zeb2 and Sec23a, the direct target genes of miR-200s, were downregulated in cocultured 4TO7 cells, whereas Cdh1 (the E-cadherin gene, transcriptionally repressed by Zeb2) was upregulated. Changes in the miR-200 family, Zeb2, Sec23a, and Cdh1 were greater when more 4T1E cells were added. 4TO7 expression of pri–mir-200c/141 was not affected by the coculture (Figure 2B). E-cadherin protein correspondingly increased and Zeb2 decreased in sorted 4TO7-GFP cells analyzed by immunoblot after 1 week of 4T1E coculture in a 1:4 ratio (Figure 2C). E-cadherin immunostaining of 4TO7-GFP cells by flow cytometry also significantly increased after 4T1E coculture (Figure 2D). E-cadherin was not detected by fluorescence microscopy in untreated 4TO7 cells, but became weakly detectable after 4T1E coculture (Figure 2E). Thus, 4TO7 cells took up miR-200s from 4T1E cells, which led to miR-200 target downregulation and E-cadherin upregulation.
Figure 2. miR-200 miRNAs are transferred from metastatic 4T1E cells to poorly metastatic 4TO7 cells.
(A and B) miRNA and mRNA levels in 4T1E cells, untreated 4TO7 cells, and 4TO7-GFP cells sorted after 48-hour coculture with 4T1E cells in a 1:1 or 1:4 (4TO7/4T1E) ratio. miRNAs and mRNAs were quantified by TaqMan assay and SsoFast EvaGreen qRT-PCR, respectively (3 experiments). *P < 0.05; **P < 0.01, Student’s t test. (C) Western blot analysis in 4T1E and 4TO7-GFP cells that were untreated or cocultured with 4T1E cells for 1 week. (D) Flow cytometry analysis of E-cadherin (Ecad) staining in 4TO7-GFP cells that were untreated (U) or cocultured (C) with 4T1E cells at a 1:4 ratio for 1 week, gated on GFP+ single viable cells (3 experiments). *P < 0.05, Student’s t test. (E) E-cadherin staining (red) of 4T1E cells, 4TO7-GFP cells (green), and after 1 week, coculture of the 2 cell lines at a 1:4 ratio. DAPI (blue) marks nuclei. Scale bars: 10 μm.
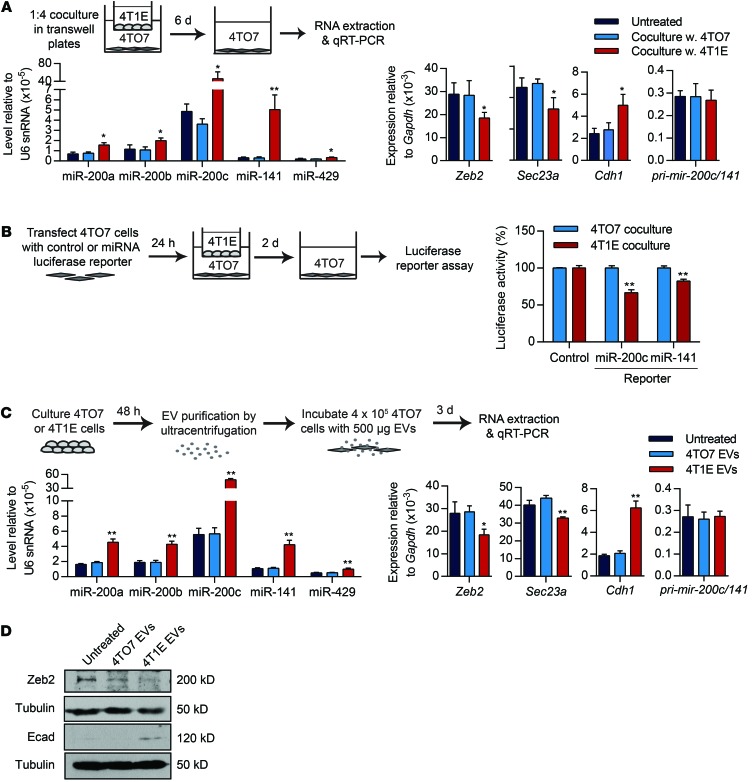
To examine whether miR-200 transfer requires direct cell contact, we set up Transwells in which 4T1E cells (or 4TO7 as control) were separated by a porous 3-μm membrane from 4TO7 cells (Figure 3A). EVs and other soluble factors, but not cells, can migrate across these membranes. Six days later, 4TO7 cells in the bottom chamber were analyzed. As in the direct coculture, all miR-200 family members and Cdh1 mRNAs increased and the miR-200 targets, Zeb2 and Sec23a, decreased when 4T1E cells were placed in the upper chamber. However, the magnitude of these changes in the Transwell experiments was substantially reduced compared with the direct cell cocultures (compare Figure 2A and Figure 3A). As expected, pri–mir-200c/141 levels in 4TO7 cells did not change. Hence, miR-200 transfer and subsequent alterations in gene expression did not require direct cell-cell contact, but were enhanced by direct cell contact. To test further whether transferred miR-200s were functional, 4TO7 cells were transfected with a luciferase reporter plasmid containing 2 miR-200c or miR-141 3′ UTR binding sites or a control reporter. Transfected 4TO7 cells were placed in the bottom Transwell chambers and were incubated for 2 days with 4T1E or 4TO7 cells in the upper chamber and assessed for luciferase activity (Figure 3B). Coculture with 4T1E, but not 4TO7, suppressed the luciferase activity of the miR-200c and miR-141 reporters in 4TO7 cells; the activity of the control luciferase reporter was unaffected. Thus, 4T1E-derived miR-200c and miR-141 were able to repress target gene expression in recipient 4TO7 cells. We also used flow cytometry to assess miR-200 uptake by 4TO7 cells cocultured in Transwells for 48 hours with 4T1E cells transfected with Cy5-labeled miR-200c mimics. Cy5 was detected in some 4TO7 cells only after incubation with transfected 4T1E cells (Supplemental Figure 2A).
Figure 3. miR-200 miRNAs are transferred across a Transwell or by EVs.
(A) miRNA and mRNA levels in 4TO7 cells, untreated or cocultured for 6 days with 4TO7 or 4T1E cells at a 1:4 ratio separated by Transwell. (B) Luciferase reporter assay of 4TO7 cells, transfected with an empty vector (control) or a miRNA reporter for miR-200c or miR-141, and cocultured with 4TO7 or 4T1E cells at a 1:4 ratio in a Transwell plate for 2 days. Renilla luciferase activity, normalized to firefly luciferase, is presented as percentage relative to the control 4TO7 coculture. (C) miRNA and mRNA levels in 4TO7 cells untreated or treated for 3 days with EVs from the culture supernatants of 4TO7 or 4T1E cells. (D) Protein expression in 4TO7 cells untreated or treated as in C. In all panels, 3 experiments are represented. *P < 0.05; **P < 0.01, Student’s t test.
To verify that alterations in cellular and molecular properties are indeed imparted by EVs, we analyzed miR-200 and target expression in 4TO7 cells incubated for 3 days with 4TO7 or 4T1E EVs (Figure 3C). 4T1E, but not 4TO7, EVs transferred miR-200s to 4TO7 cells, thereby downregulating Zeb2 and Sec23a and upregulating Cdh1, but did not change levels of pri–mir-200c/141. Thus, the increase in mature miR-200s in 4TO7 cells following coculture or EV incubation was not due to miR-200 transcription. ZEB2 protein was also downregulated, and E-cadherin protein was upregulated in 4TO7 cells after treatment with 4T1E EVs (Figure 3D). To verify EV uptake, we labeled 4T1E EVs with PKH-67 membrane dye and added these EVs or the second wash buffer of the labeled EVs to 4TO7 cells. All 4TO7 cells were stained with PKH-67 after 24-hour incubation with labeled EVs (Supplemental Figure 2B). Thus, 4T1E EVs deliver miR-200 miRNAs to 4TO7 cells that function in the recipient cell to alter its gene expression.
Transferred miR-200 colocalizes with donor cell CD63 and Ago2.
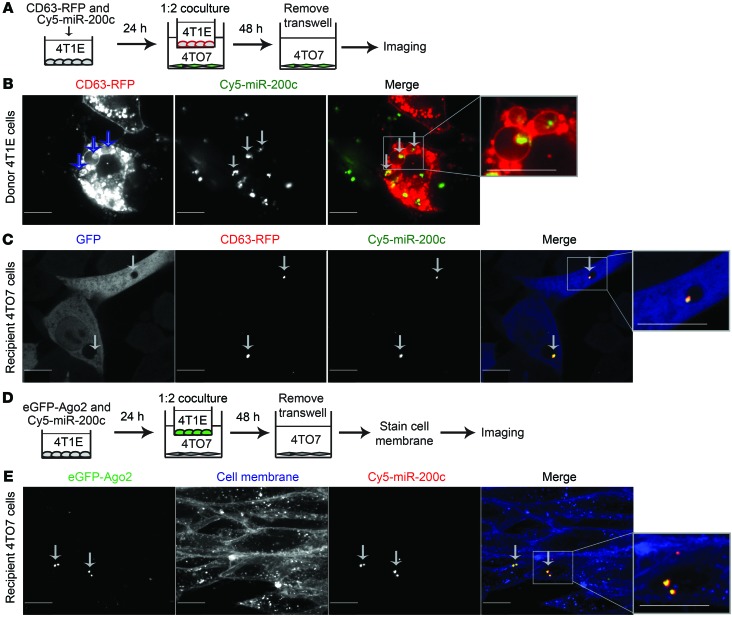
To visualize the uptake of miR-200s in live cells, we transfected Cy5-labeled miR-200c and a plasmid encoding the exosome marker CD63 fused to red fluorescent protein (RFP) into 4T1E cells, cocultured these cells for 2 days with 4TO7-GFP cells in Transwells, and then removed the Transwell inserts and imaged both the transfected 4T1E cells and the cocultured 4TO7-GFP cells using confocal microscopy (Figure 4A). In 4T1E, much of the transfected fluorescent miR-200c colocalized with CD63-RFP in small vesicles within larger vesicles that morphologically resembled multivesicular bodies (Figure 4B and Supplemental Video 1). Cy5–miR-200c and CD63-RFP also colocalized in the recipient 4TO7 cells (Figure 4C and Supplemental Video 2). These data confirm that miR-200s were secreted in CD63+ vesicles and taken up with CD63 into 4TO7 cells. To determine whether miR-200 was transferred with donor cell Ago2, we also cocultured 4TO7 cells in Transwell plates with 4T1E cells cotransfected with Cy5–miR-200c and enhanced GFP–Ago2 (eGFP-Ago2) plasmid (Figure 4, D and E, and Supplemental Video 3). Cy5–miR-200c also colocalized in recipient 4TO7 cells with eGFP-Ago2 from the donor 4T1E cell. These results, together with our detecting endogenous Ago2 in 4T1E EVs (Figure 1B), suggest that some miR-200s may be transferred in a functional complex with Ago2.
Figure 4. Transferred miR-200c associates with donor CD63 and AGO2.
(A) Schema of 4T1E cells transfected with CD63-RFP plasmid and Cy5–miR-200c and cocultured with 4TO7-GFP cells. (B) A representative image of donor 4T1E cells expressing CD63-RFP (red) and Cy5–miR-200c (green) 24 hours after transfection. (C) A representative image of 4TO7-GFP cells (blue) that internalized CD63-RFP (red) and Cy5–miR-200c (green) after coculture with 4T1E cells. Green and blue channels were swapped for easy visualization. (D) Schema of 4T1E cells, cotransfected with eGFP-AGO2 plasmid and Cy5–miR-200c and cocultured with 4TO7 cells. After 48 hours, recipient 4TO7 cells were stained with CellMask Membrane Dye and imaged. (E) A representative image of 4TO7 cells with blue membrane and internalized eGFP-AGO2 (green) and Cy5–miR-200c (red) after coculture. Arrows and insets (×2.4) highlight colocalization. Scale bars: 10 μm. Each experiment was repeated twice.
Incubation with 4T1E EVs enhances 4TO7 cell colonization.
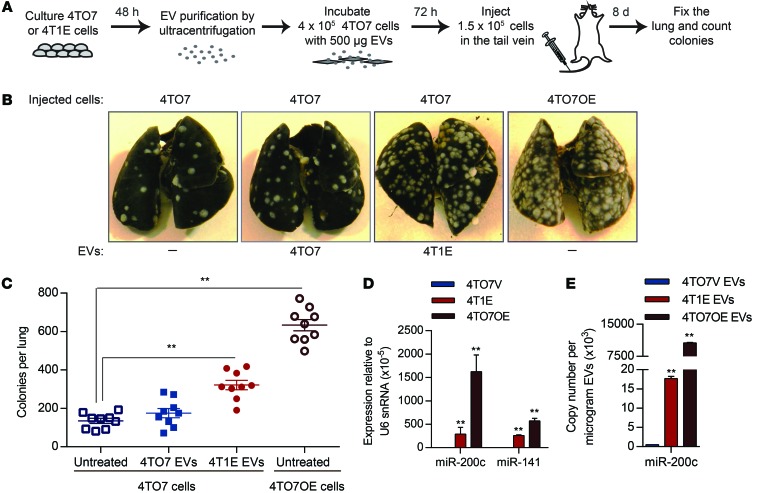
Since ectopic miR-200 expression in 4TO7 cells increases metastasis, we wondered whether 4T1E-derived EVs would enhance 4TO7 cell lung colonization. Mice injected into the tail vein with 4TO7 cells that were preincubated with 4TO7 or 4T1E EVs for 72 hours were sacrificed 8 days later, and their lungs were analyzed by India ink staining for macroscopic metastases (Figure 5A). Lung macrometastases formed by 4TO7 cells increased about 3-fold after incubation with 4T1E EVs, but did not change significantly after incubation with 4TO7 EVs (Figure 5, B and C). The number of lung metastases of EV-incubated 4TO7 cells was also compared with those formed by 4TO7 cells stably overexpressing pri–miR-200c/141 (4TO7OE cells). Tail-vein injection of 4TO7OE cells led to about twice as many macrometastatic nodules in the lung as injection of 4T1E-EV–incubated cells. The expression of miR-200c and miR-141 in 4TO7OE cells was 5.6 and 2.2 times higher, respectively, than their endogenous expression in 4T1E cells (Figure 5D), which likely contributed to their greater ability to form lung nodules. Thus, miR-200 uptake from EVs or ectopic expression enhances lung colonization.
Figure 5. EVs containing miR-200 miRNAs promote colonization of 4TO7 cells in the lung.
(A) Schema of in vivo colony assay. 4TO7 cells were incubated for 3 days with 500 μg EVs purified from culture supernatants of 4TO7 or 4T1E cells and then injected into the tail vein of BALB/c mice. Lungs were fixed 8 days later. (B) Representative photographs of the lungs. 4TO7 cells overexpressing miR-200c and miR-141 (4TO7OE cells) were used as a positive control for metastasis. (C) Average number of tumor colonies in the lungs (n = 9 mice). (D) Expression of miR-200c and miR-141 in 4T1E cells, 4TO7OE cells, and empty vector–control 4TO7 cells (4TO7V) relative to U6 snRNA (3 experiments), determined by TaqMan assay. (E) miR-200c copy number in EVs released from 4TO7 cells, 4T1E cells, and 4TO7OE cells (3 experiments), determined by TaqMan assay. **P < 0.01, Student’s t test (C–E).
Antagonizing miR-200 in recipient or donor cells inhibits the prometastatic effect of metastatic cell EVs.
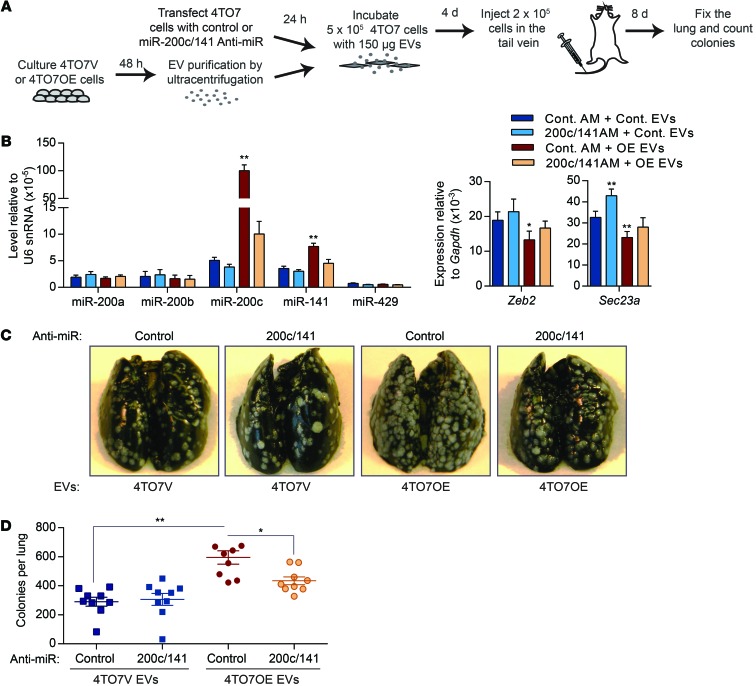
4TO7OE cells produce EVs with much more miR-200c than 4TO7 cells stably infected with the empty lentiviral vector (4TO7V) or 4T1E cells (Figure 5E). To confirm the contribution of miR-200 transfer in EVs to metastatic nodule formation, recipient 4TO7 cells were transfected with antagonistic oligonucleotides that block miR-200c and miR-141 or control oligonucleotides before incubation with 4TO7V or 4TO7OE EVs (Figure 6A). Incubation of 4TO7 cells with 150 μg of 4TO7OE EVs increased miR-200c and miR-141 levels more than 20- and 2-fold, respectively, compared with incubation with 4TO7V EVs (Figure 6B). 4TO7OE EVs significantly decreased Zeb2 and Sec23a and increased Cdh1 mRNAs. Anti–miR-200/141 oligonucleotides depleted 50% to 90% of miR-141 and miR-200c in 4TO7 cells treated with 4TO7OE EVs, restoring Zeb2 and Sec23a mRNAs and reducing Cdh1 expression to levels similar to those in 4TO7 cells treated with 4TO7V EVs (Figure 6B). In contrast, the control anti-miR did not alter miR-200s and their regulated mRNAs. To test the impact of inhibiting miR-200c/141 on metastasis, we compared the number of lung nodules formed after i.v. injection of 4TO7 cells that were pretreated with anti-miR oligonucleotides and 4TO7V or 4TO7OE EVs. In control anti-miR–treated cells, incubation of 4TO7 cells with 4TO7OE EVs doubled the number of lung nodules, while 4TO7V EVs had no significant effect on metastasis. Prior blocking of miR-200c and miR-141 significantly reduced, by two-thirds, the increased number of 4TO7 lung nodules caused by 4TO7OE EV treatment (Figure 6, C and D). Thus, miR-200 transfer is largely responsible for the prometastatic effect of miR-200–containing EVs.
Figure 6. Inhibition of miR-200s in recipient cells reduces the prometastatic effect of EVs derived from metastatic cells.
(A) 4TO7 cells were transfected with control anti-miR (AM) or a combination of anti–miR-200c and anti–miR-141 (200c/141 anti-miR) and then incubated with 4TO7V or 4TO7OE EVs. Treated 4TO7 cells were injected into the tail vein of BALB/c mice, and the lungs were analyzed 8 days later. (B) Levels of miR-200 miRNAs and their targets in 4TO7 cells transfected with anti-miRs and treated with EVs (3 experiments). (C) Representative photographs of the lungs treated as in A. (D) Number of tumor colonies in the lungs (n = 9 mice). *P < 0.05; **P < 0.01, Student’s t test.
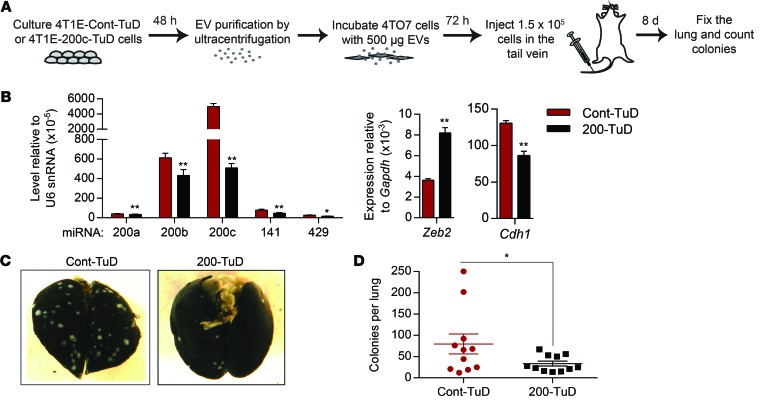
To test whether transfer of endogenous miR-200s contributes to the prometastatic effect of 4T1E EVs, we generated 4T1E cell lines stably expressing a control tough decoy (TuD) or a TuD with 2 complementary binding sites for miR-200c to antagonize miR-200 in the donor cells. Expression of the miR-200–TuD efficiently inhibited the miR-200 family, upregulated Zeb2, and downregulated Cdh1 in 4T1E cells (Figure 7, A and B). Inhibition of miR-200s by TuD expression in 4T1E cells significantly reduced the effect of 4T1E-derived EVs on 4TO7 metastasis (Figure 7, C and D). The mean number of lung metastatic colonies in mice injected with tumor cells treated with EVs from miR-200–TuD–expressing cells was only half that of mice injected with tumor cells treated with control TuD–expressing cell EVs. Hence, endogenous miR-200 in 4T1E EVs promotes colonization of poorly metastatic 4TO7 cells.
Figure 7. Endogenous miR-200s secreted by metastatic cells mediate the prometastatic effect of EVs.
(A) 4TO7 cells were incubated with EVs purified from 4T1E stably expressing a control (Cont-TuD) or anti–miR-200–TuD (200-TuD). (B) Levels of miR-200s and their targets in 4T1E cells expressing TuD (3 experiments). (C) Representative photographs of the lungs treated as in A. (D) Number of tumor colonies in the lungs (n = 11 mice). *P < 0.05; **P < 0.01, Student’s t test.
miR-200 overexpression in mammary tumors promotes colonization of circulating 4TO7 cells.
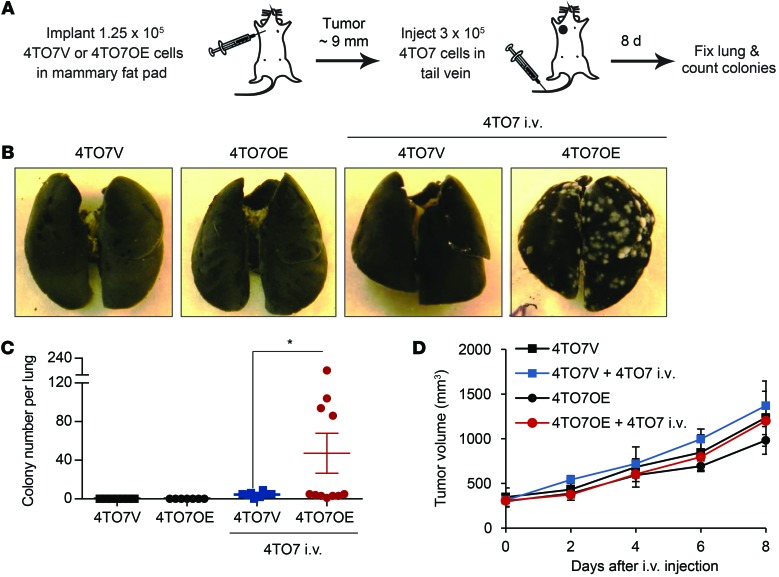
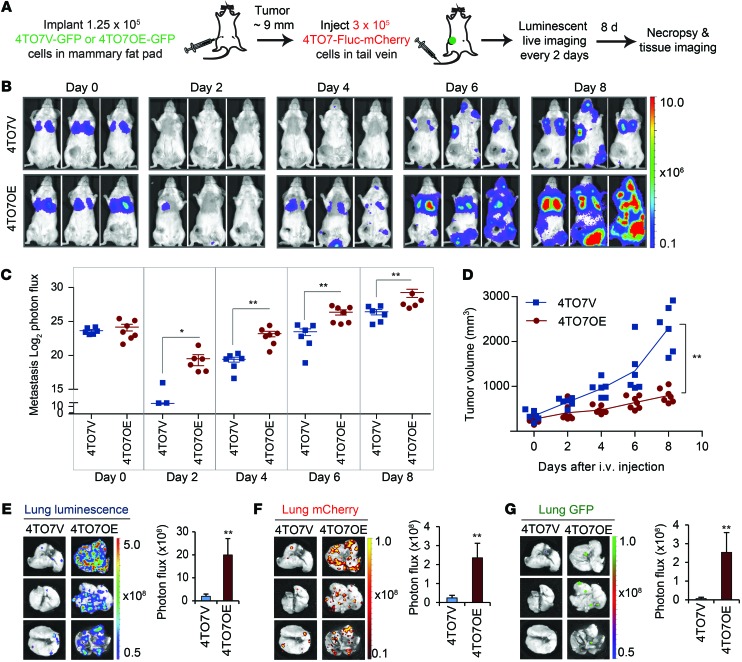
To assess whether tumor-secreted miRNAs could be taken up by circulating cancer cells to enhance metastasis, we implanted 4TO7V or 4TO7OE cells in the mammary fat pads of mice and, after the tumors reached approximately 9 mm in diameter, injected either saline or 4TO7 cells in the tail vein (Figure 8A). The fat-pad–engrafted tumors on their own, even if they overexpressed miR-200, had not formed any macroscopic lung metastases at the time of sacrifice (Figure 8, B and C). Tail-vein–injected 4TO7 cells in 4TO7OE tumor–bearing mice developed significantly more lung metastases than those in 4TO7V tumor–bearing mice. The primary fat-pad 4TO7OE and 4TO7V tumors were not significantly different in size, and the i.v. injected tumor cells did not affect the growth of the primary tumor (Figure 8D). Thus, secreted miR-200–containing EVs from an orthotopic tumor can promote macrometastasis of otherwise weakly metastatic circulating cancer cells.
Figure 8. miR-200 overexpression in mammary fat-pad tumors promotes lung colonization by circulating 4TO7 cells.
(A) Schema of in vivo metastasis assay. 4TO7V or 4TO7OE cells were injected into the mammary fat pad of BALB/c mice, and 10 days later, when the tumor diameter approached 9 mm, 4TO7 cells were injected into the tail vein. Macroscopic lung colonies were counted 8 days later. (B) Representative photographs of the lungs. (C) Colony number per lung. Seven mice in each control group did not receive tail-vein injection; 8 mice bearing 4TO7V tumors and 11 mice bearing 4TO7OE tumors were injected with 4TO7 cells by tail vein. *P < 0.05, Student’s t test. (D) Mammary tumor volume as measured by calipers.
To distinguish tail-vein–injected cells from cells that disseminated from the primary tumor and to improve the sensitivity of detecting metastatic cells, stable 4TO7V, 4TO7OE, and 4T1E cell lines expressing luciferase, GFP, or mCherry were generated. However, when these cells were implanted in the mammary fat pad, tumors that began to form soon regressed. This observation was consistent with previous reports that ectopic expression of luciferase or fluorescent proteins triggers immune rejection (21). To continue these experiments, we therefore switched to BALB/c SCID mice.
GFP-expressing 4TO7V or 4TO7OE cells were orthotopically implanted in BALB/c SCID mice, and 10 to 14 days later, when each mammary fat-pad tumor approached 9 mm in diameter, 4TO7 cells expressing firefly luciferase and mCherry (4TO7-Fluc-mCherry) were injected into the tail vein (Figure 9A). Mice were imaged for luciferase activity every 2 days for a week after tail-vein injection. Immediately after the tail-vein injection, the luminescent tumor signal concentrated in the lung and was comparable in mice bearing 4TO7V and 4TO7OE orthotopic tumors (Figure 9B). Luminescence was radically reduced on day 2, as most tail-vein–injected cells did not survive, but the signal in 4TO7OE-implanted mice was significantly higher. Luminescence increased exponentially as tumor cells proliferated in the lung and metastases became detectable outside the lungs. 4TO7-Fluc-mCherry cell colonization of the lung and elsewhere was significantly greater in 4TO7OE tumor–bearing mice than in 4TO7V tumor–bearing mice (Figure 9, B and C), even though the orthotopic GFP+ 4TO7OE tumors grew less well than control 4TO7V tumors (Figure 9D). Mice were sacrificed 8 days after the tail-vein injection, and the lungs were harvested and analyzed for luciferase, mCherry, and GFP (Figure 9, E–G). The lungs from mice bearing 4TO7OE orthotopic tumors contained many more lung nodules, most of which were derived from the tail-vein–injected cells, but with a small number derived from the mammary fat-pad graft. mCherry+ and GFP+ nodules did not overlap, suggesting that each nodule was derived from either tail-vein–injected cells or from the orthotopic tumor. Thus, the colonization-enhancing effect of 4TO7OE cells was likely exerted at a distance rather than locally at preestablished metastatic niches seeded by metastatic 4TO7OE cells. The average lung luminescent and mCherry signals in 4TO7OE tumor–bearing mice and numbers of nodules were dramatically and significantly higher than in 4TO7V-bearing tumors. Most of the mice in the 4TO7OE group, but none in the control group, had GFP colonies in the lung (Figure 9G), confirming that overexpression of miR-200c and miR-141 in 4TO7 cells promotes metastasis. These data suggest that weakly metastatic cancer cells can acquire metastatic capability from circulating factors, such as miR-200–enriched EVs secreted by more aggressive tumor cells.
Figure 9. Circulating 4TO7 cells acquire colonization capability from primary tumors expressing miR-200.
(A) Schema for imaging of lung colonization. When mammary fat-pad tumors of 4TO7V-GFP or 4TO7OE-GFP cells in BALB/c SCID mice approached 9 mm in diameter, 4TO7-Fluc-mCherry cells were injected into the tail vein and luminescence was imaged every 2 days until sacrifice on day 8. (B) Representative luminescent images of mice after tail-vein injection. The type of mammary fat-pad tumor is indicated at left. (C) log2 luminescent photon flux (photons/s) of the whole body captured at the indicated times after the tail-vein injection, including 6 mice bearing 4TO7V tumors and 7 mice bearing 4TO7OE tumors. (D) Orthotopic tumor volume measured by calipers. (E) Representative lung luminescent images (left) and the average lung luminescent photon flux, 8 days after the i.v. injection (right). (F) Representative lung mCherry images (left) and the average mCherry photon flux (right). (G) Representative GFP images (left) and the average GFP photon flux (right). *P < 0.05; **P < 0.01, Mann-Whitney U test.
miR-200 transfer between cancer cells within a single orthotopic tumor promotes metastasis of poorly metastatic cells.
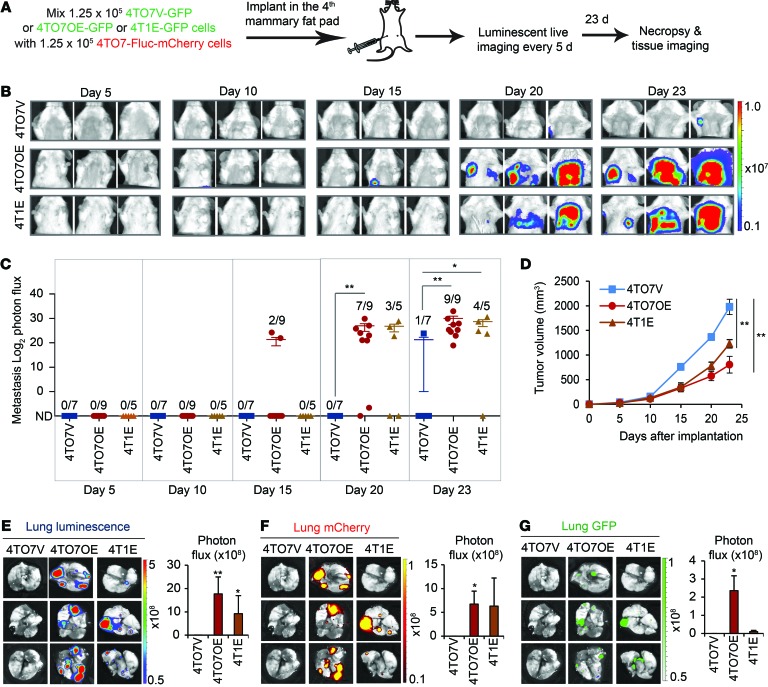
Primary tumors are heterogeneous and contain mixtures of cancer cells with different metastatic abilities. Hence, EVs could transfer metastatic traits between cells within the same primary tumor. To recapitulate the interaction of metastatic cells with poorly metastatic cells in a heterogeneous tumor, we injected an equal mixture of 4TO7-Fluc-mCherry cells and 4T1E-GFP, 4TO7OE-GFP, or 4TO7V-GFP cells in the fourth mammary fat pad of BALB/c SCID mice and measured thoracic luminescence over 23 days to assess lung metastases of luciferase+ 4TO7 cells (Figure 10, A–C). The 4TO7-Fluc-mCherry cells in 2 of 9 4TO7OE-GFP tumor–bearing mice had metastasized with clear-cut lung luminescence by 2 weeks, while none of the other mice had detectable lung luminescent signal above background (Figure 10C). By 3 weeks, all of the 4TO7OE tumor–bearing mice and 4 of 5 mice bearing 4T1E-GFP tumors developed detectable metastases, while only 1 of 7 mice bearing control 4TO7V-GFP tumors had detectable metastases, even though 4TO7V tumors grew faster than 4T1E and 4TO7OE tumors (Figure 10, B–D). Thus, the rapidity and extent of metastasis of the poorly metastatic luminescent 4TO7 cells increased with the level of miR-200 expression in the admixed tumor cells (Figure 5D). These results were confirmed by imaging the dissected lungs when animals were sacrificed on day 23 (Figure 10, E and F). Lung colonization of 4TO7-Fluc-mCherry cells was not detected in any of the mice coimplanted with 4TO7V-GFP cells and was greatest after coimplantation with 4TO7OE-GFP cells. Thus, metastatic cells expressing miR-200 within a primary tumor can drive spontaneous metastasis of less aggressive cells.
Figure 10. miR-200 expression in mammary fat-pad tumor cells promotes spontaneous metastasis of neighboring tumor cells.
(A) BALB/c SCID mice were injected into the fourth right mammary fat pad with an equal mixture of 4TO7-Fluc-mCherry cells and 4T1E-GFP, 4TO7OE-GFP, or 4TO7V-GFP cells. Luminescent images were taken every 5 days, and mice were sacrificed on day 23. (B) Representative luminescent images. The type of coimplanted GFP cell is indicated at left. (C) log2 luminescent photon flux of metastases in the anterior halves of the mice after tumor cell implantation. The number of mice with metastases is shown in each condition. (D) Tumor volume as measured by calipers. Asterisks indicate differences at day 23. (E) Representative lung luminescent images (left) and the average lung luminescent photon flux on day 23 (right). (F) Representative lung mCherry images (left) and the average mCherry photon flux (right). (G) Representative lung GFP images (left) and the average GFP photon flux (right). *P < 0.05; **P < 0.01, Mann-Whitney U test.
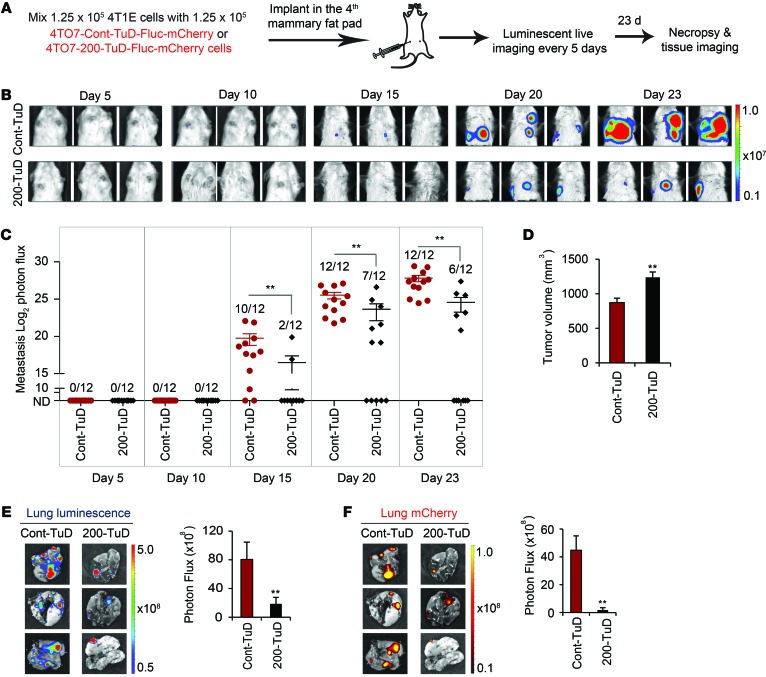
To test whether transfer of metastatic traits from 4T1E to neighboring 4TO7 cells was due to miR-200 uptake, we created 4TO7-Fluc-mCherry recipient cell lines stably expressing a control or anti–miR-200–TuD. These cells were coinjected with an equal number of unlabeled 4T1E cells in the mammary fat pads, and mice were imaged every 5 days (Figure 11A). After 15 days, 10 of 12 mice coinjected with 4T1E and control TuD–4TO7 cells had thoracic metastases, whereas only 2 of 12 mice with tumors containing 4T1E and 200-TuD-4TO7 cells had detectable metastases (Figure 11, B and C). Tumors containing control TuD–4TO7 cells were significantly more likely to metastasize and produced significantly larger metastases than tumors containing 200-TuD-4TO7 cells, measured on day 20 and day 23, even though the primary tumors were smaller (Figure 11D). The lungs of mice bearing 4T1E and control TuD–4TO7 tumors, harvested at the time of sacrifice (day 23), contained more metastases, quantified by both luminescent and mCherry measurements, than the lungs of mice bearing 4T1E and 200-TuD-4TO7 tumors (Figure 11, E and F). Hence, transfer of endogenous miR-200s from 4T1E cells promotes metastasis of 4TO7 cells in the same tumor.
Figure 11. Mammary fat-pad tumor 4T1E cells promote spontaneous metastasis of neighboring tumor cells in a miR-200–dependent manner.
(A) BALB/c SCID mice were injected into the fourth right mammary fat pad with an equal mixture of 4T1E cells and 4TO7-Fluc-mCherry expressing a control or anti–miR-200 TuD (Cont-TuD or 200-TuD). Luminescent images were taken every 5 days, and mice were sacrificed on day 23. (B) Representative luminescent images. The type of coimplanted 4TO7 cells is indicated at left. (C) log2 luminescent photon flux of metastases in the anterior halves of the mice after tumor cell implantation. The number of mice with metastases is shown. (D) Tumor volume on day 23 as measured by calipers. (E) Representative lung luminescent images (left) and the average luminescent photon flux at time of sacrifice (right). (F) Representative lung mCherry images (left) and the average mCherry photon flux (right). **P < 0.01 by Mann-Whitney U test.
Poorly metastatic 4TO7 orthotopic tumors acquire metastatic capability from distal metastatic tumors in a miR-200–dependent manner.
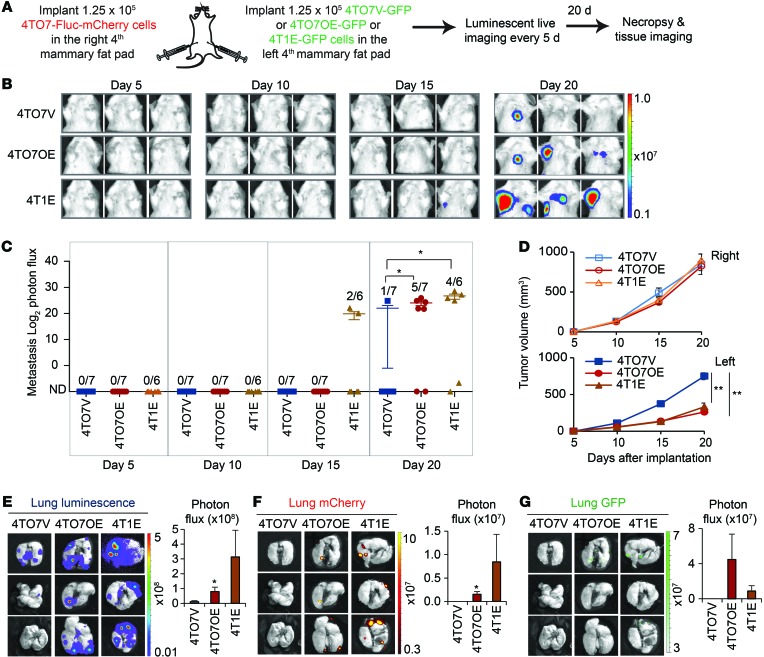
To test whether metastatic capability can be transferred from a metastatic tumor to a poorly metastatic tumor at a distance, we implanted 4TO7-Fluc-mCherry cells into the right fourth mammary fat pad and an equal number of 4T1E-GFP, 4TO7OE-GFP, or 4TO7V-GFP cells into the right fourth mammary fat pad of each mouse and measured lung metastasis over 3 weeks (Figure 12, A–C). As in the coimplantation experiment, spontaneous metastasis of the 4TO7-Fluc-mCherry cells significantly increased in mice bearing 4TO7OE tumors or 4T1E tumors in the contralateral fat pad. The 4TO7-Fluc-mCherry orthotopic tumors grew at a similar rate in the 3 groups of mice, but GFP+ 4TO7OE and 4T1E tumors grew more slowly than GFP+ 4TO7V tumors, consistent with previous results (Figure 12D). When mice were sacrificed 3 weeks after implantation, more luminescent/mCherry and GFP metastases were detected in the lungs of mice bearing 4TO7OE and 4T1E tumors than in those bearing control 4TO7V tumors (Figure 12, E–G). Thus, miR-200–expressing cells in a mammary fat-pad tumor conferred metastatic traits to distant fat-pad tumors.
Figure 12. Poorly metastatic 4TO7 orthotopic tumors acquire metastatic capability from distal metastatic tumors expressing miR-200s.
(A) BALB/c SCID mice were injected with 4TO7-Fluc-mCherry cells in the right fourth mammary fat pads and an equal number of GFP+ 4TO7V, 4TO7OE, or 4T1E cells in the left fourth mammary fat pads. Luminescent images were taken every 5 days, and the mice were sacrificed on day 20. (B) Representative luminescent images. The type of GFP+ cells implanted in the right mammary fad pads is indicated at left. (C) log2 luminescent photon flux of metastases in the anterior halves of the mice measured after implantation. Number of mice with metastasis versus the total is indicated. (D) Volume of the mCherry tumors in the right mammary fat pad and GFP+ tumors in the left mammary fat pad measured by calipers in mice that received different types of GFP+ cells, as indicated. Asterisks indicate differences at day 20. (E) Representative lung luminescent images (left) and the average lung luminescent photon flux (right). (F) Representative lung mCherry images (left) and the average mCherry photon flux (right). (G) Representative lung GFP images (left) and the average GFP photon flux (right). *P < 0.05; **P < 0.01, Mann-Whitney U test.
miR-200 family miRNAs are secreted in EVs by human metastatic breast cancer cells.
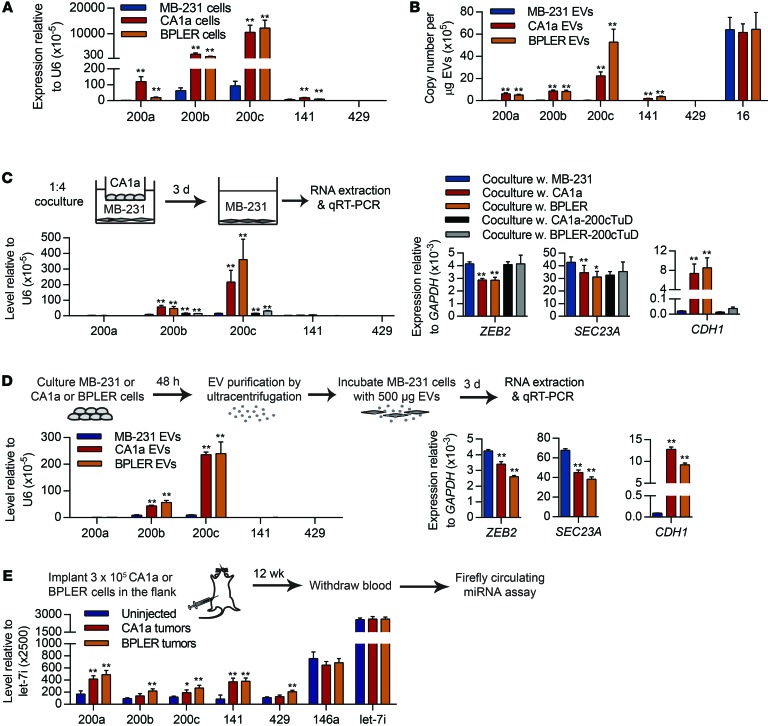
miR-200 overexpression in mesenchymal (basal-B) human TNBC cells, such as MDA–MB-231 (MB-231), promotes their colonization in mouse xenografts (8). miR-200a, miR-200b, miR-200c, and miR-141 were abundantly expressed in 2 human breast cancer cell lines, MCF10CA1a (CA1a) and BPLER, compared with MB-231 (Figure 13A). Both CA1a and BPLER cells are epithelial with high CDH1 and low ZEB2 and SEC23A expression (Supplemental Figure 3A). E-cadherin was abundant and vimentin was not detected in CA1a and BPLER cells, while MB-231 had the opposite expression pattern (Supplemental Figure 3B). The HER2+ CA1a cell line is the most malignant and metastatic line in the isogenic series of MCF10CA1 clones (22). BPLER cells, transformed from normal mammary epithelial cells, are also highly tumorigenic and metastatic (20, 23). MB-231 cells are malignant, but poorly metastatic (24).
Figure 13. miR-200 miRNAs are secreted by human metastatic breast cancer cells and transferred to poorly metastatic cells.
(A) Expression of miR-200s in human poorly metastatic MB-231 cells and highly metastatic CA1a and BPLER cells. (B) miRNA copy number in EVs purified from the supernatants of MB-231, CA1a, and BPLER cells. (C) miRNA and mRNA levels in MB-231 cells, cocultured for 3 days separated by a Transwell with MB-231, CA1a, or BPLER cells in which miR-200 was inhibited or not by TuD. (D) miRNA and mRNA levels in MB-231 cells treated for 3 days with EVs purified from the supernatants of MB-231, CA1a, or BPLER cells. In A–D, miRNAs and mRNAs were quantified by TaqMan and Ssofast Evagreen qRT-PCR, respectively (3 experiments). (E) miRNA levels in the sera of mice uninjected (n = 6) or injected with CA1a (n = 6) or BPLER tumors (n = 8) 12 weeks after implantation, determined using the Firefly Circulating miRNA Assay. *P < 0.05; **P < 0.01, Student’s t test.
miR-200 miRNAs were much more abundant in CA1a and BPLER EVs than in MB-231 EVs (Figure 13B). CA1a and BPLER EVs contained 2.5 to 5 times more miR-200c per μg than 4T1E EVs (Figure 1D) and 100 to 150 times more miR-200s than MB-231 EVs. All 3 human cell lines secreted similar amounts of miR-16 (Figure 13B). We therefore chose to use these 3 human breast cancer cell lines to investigate whether our findings in the mouse 4TO7/4T1 system apply to human breast cancer lines.
miR-200s are transferred in EVs from human metastatic breast cancer cells to poorly metastatic breast cancer cells.
To test whether miR-200s can be transferred from CA1a and BPLER cells to MB-231 cells, we cocultured MB-231 recipient cells in the lower chamber of Transwells with CA1a or BPLER donor cells in the upper chamber at a ratio of 1:4 (recipient/donor) (Figure 13C). After 3 days, miR-200s, particularly miR-200b and miR-200c, were significantly increased in MB-231 cells compared with the control coculture, with MB-231 cells in both Transwell chambers. Coculture with CA1a or BPLER cells also downregulated ZEB2 and SEC23A and upregulated CDH1 in MB-231 cells. The primary miR-200 transcript was undetectable in MB-231 cells, even after coculture (not shown). Stable expression of the miR-200–TuD in donor CA1a or BPLER cells greatly reduced the accumulation of miR-200s in cocultured MB-231 cells, restored ZEB2 expression, and reduced CDH1 expression to control levels (Figure 13C). Thus, miR-200s can be transferred from highly metastatic cells to poorly metastatic cells in human breast cancer.
To confirm that miR-200s were transferred by EVs, we incubated MB-231 cells with 500 μg EVs purified from the culture supernatants of MB-231, CA1a, or BPLER cells (Figure 13D). After 3 days, miR-200b and miR-200c were increased by treatment with CA1a or BPLER EVs compared with MB-231 EVs. Treatment with CA1a or BPLER EVs also downregulated ZEB2 and SEC23a and upregulated CDH1. The effect of coculture with EVs was similar in magnitude to that of the Transwell coculture (compare Figure 13, C and D). Therefore, CA1a and BPLER EVs are taken up by MB-231 cells, deliver miR-200s to them, and alter gene expression.
miR-200s increase in the circulation of mice bearing human xenografts.
To determine whether miR-200s are secreted from miR-200–expressing human tumors in vivo, we implanted 3 × 10⁵ CA1a or BPLER cells in the flanks of nude mice and measured circulating miRNAs in the serum using the Firefly Circulating miRNA Assay 12 weeks later (Figure 13E). After 12 weeks, both CA1a and BPLER cell lines formed similarly sized tumors (18–20 mm diameter). However, when the same number of MB-231 cells was injected into the flanks of nude mice, no tumors formed. All miR-200 family members were upregulated in the sera of mice bearing CA1a and BPLER tumors compared with control untreated mice with no tumors. The control miRNAs, miR-146a and let-7i, were unchanged in tumor-bearing mice.
EVs from human metastatic breast cancer cells promote lung colonization of poorly metastatic breast cancer cells.
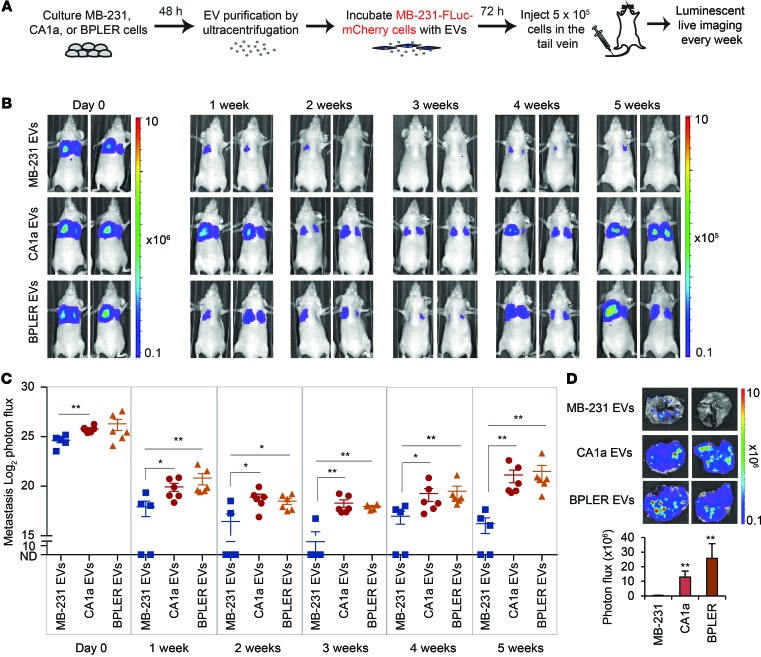
To investigate the functional consequences of miR-200 transfer between human cells, we first injected MB-231–Fluc–mCherry cells incubated ex vivo with CA1a, BPLER, or MB-231 EVs into the tail veins of nude mice (Figure 14A). Luminescence was quantified every week. The i.v. injected cells accumulated in the lung immediately after tail-vein injection, but only a fraction of cells persisted as metastatic colonies (Figure 14B). All the mice treated with CA1a or BPLER EV–treated MB-231 cells (6 mice/group) had lung metastases, but only 3 of 5 mice injected with MB-231 EV–treated MB-231 cells formed metastases, and their metastases were significantly smaller (Figure 14C). Greater colonization of MB-231 cells treated with CA1a and BPLER EVs was confirmed by higher luminescence from lungs excised 5 weeks later (Figure 14D). Thus, CA1a and BPLER EVs promote MB-231 lung colonization.
Figure 14. EVs from human metastatic CA1a and BPLER cells promote colonization of MB-231 cells in the lung.
(A) Schema for imaging lung colonization. MB-231–Fluc–mCherry cells treated with EVs purified from the culture supernatants of MB-231, CA1a, or BPLER cells for 3 days were injected into the tail vein of nude mice. Luminescence was imaged every week until sacrifice at 5 weeks. (B) Representative luminescent images of mice at indicated times after tail-vein injection. (C) log2 luminescent photon flux (photons/s) of the whole body captured at the indicated times after the tail-vein injection, including 5 mice in the MB-231 EV group, 6 mice in the CA1a EV group, and 6 mice in the BPLER EV group. (D) Representative lung luminescent images (top) and the average lung luminescent photon flux 5 weeks after i.v. injection (bottom). *P < 0.05; **P < 0.01, Mann-Whitney U test.
Circulating human breast cancer cells acquire colonization capability from the primary tumor in a miR-200–dependent manner.
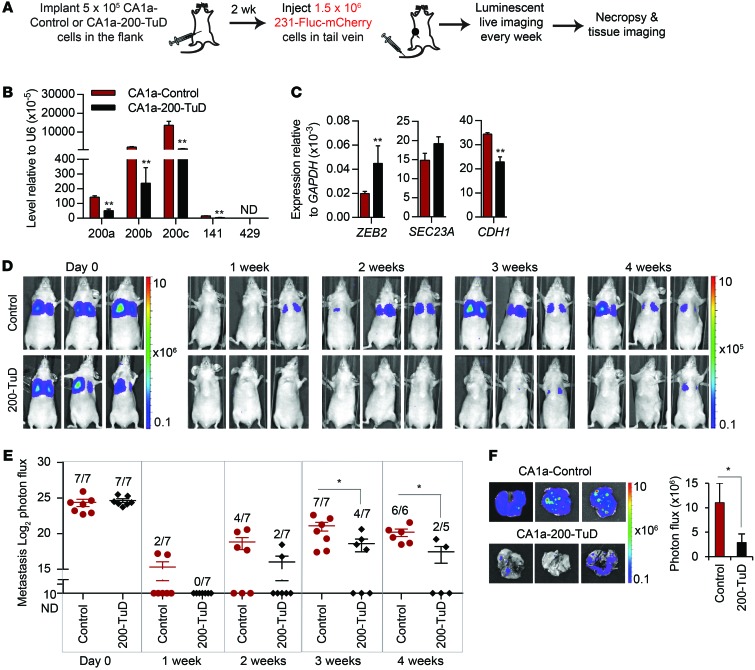
We next tested whether CA1a flank tumors that secrete miR-200s in the circulation promote colonization of i.v. injected MB-231 cells in a miR-200–dependent manner (Figure 15A). The contribution of miR-200 was assessed by comparing flank tumors produced by CA1a cells stably expressing a control TuD or miR-200–TuD. Stable expression of miR-200–TuD significantly suppressed the expression of miR-200s, upregulated ZEB2, and downregulated CDH1 in the in vitro–cultured cell line (Figure 15B). However, miR-200 antagonism did not alter growth of the primary tumors (Figure 15C). Two weeks after flank implantation, when the tumor diameters were 7 to 9 mm, we injected MB-231–Fluc–mCherry cells in the tail vein and then imaged the mice every week. Luminescence was undetectable in the lung in most mice after 1 week, but became detectable within 2 to 3 weeks (Figure 15, D and E). Within 3 weeks, all 7 mice bearing CA1a control tumors developed lung metastases, but only 4 of 7 mice bearing CA1a–miR-200–TuD tumors had detectable lung metastases. Moreover, the luminescence of tail-vein–injected MB-231 cells in the mice that had metastases was significantly lower in mice bearing CA1a-200-TuD tumors (Figure 15, D and E). When lungs were harvested 4 weeks after the i.v. injection, MB-231 luminescence was significantly higher in mice bearing CA1a–control TuD tumors compared with those with CA1a-200-TuD tumors (Figure 15F). Thus, miR-200s secreted by CA1a cell primary tumors promote lung colonization of tail-vein–injected MB-231 cells.
Figure 15. Circulating MB-231 cells acquire colonization capability from primary tumor–expressing miR-200.
(A) Schema for imaging lung colonization. Two weeks after CA1a cells, untreated or transduced with anti–miR-200–TuD vector, were injected into the flanks of nude mice, MB-231–Fluc–mCherry cells were injected into the tail vein. Luminescence was imaged every week until the mice were sacrificed when tumor diameter approached 20 mm (week 3 or 4). (B) Levels of miR-200 miRNAs and (C) their targets in CA1a-control and CA1a-200-TuD cells, as determined by TaqMan or Ssofast qPCR, respectively (3 experiments). (D) Representative luminescent images of the mice at indicated times after i.v. injection. The type of primary flank tumor is indicated at left for each group of mice. (E) log2 luminescent photon flux (photons/s) of the whole body. The number of mice in each group with detectable metastases is indicated. (F) Representative lung luminescent images (left) and the average lung luminescent photon flux at time of sacrifice (right). *P < 0.05; **P < 0.01, Student’s t test.
Discussion
Although circulating EVs secreted by tumor cells correlate with poor prognosis, the in vivo importance of EVs in tumor progression is less well established. Previous studies demonstrated that EV transfer from tumor cells to endothelial, hematopoietic, and stromal cells could promote tumor progression by facilitating angiogenesis, inflammation, and immune suppression and preparing a niche for metastatic cells. Here, we investigated, in a series of experiments of progressively increasing physiological relevance, whether EVs released from metastatic breast tumor cells could transfer metastatic capability when they are taken up by poorly metastatic tumor cells, either within the same tumor or at a distance. In a previous study, we found that miR-200 family expression distinguished a highly metastatic mouse TNBC clone from its poorly metastatic–related clones and that ectopic expression of miR-200 in the poorly metastatic clone converted it to a highly metastatic clone (6). Here, we found that EVs from only the highly metastatic 4T1E clone, not the poorly metastatic 4TO7 clone, contained miR-200 family miRNAs that were found in the circulation of 4T1E tumor–bearing mice. Incubation with EVs derived from miR-200–expressing cells could convert poorly metastatic 4TO7 cells to highly metastatic cells. Moreover, 4T1E or 4TO7OE tumors could transfer the ability to colonize the lungs and form macroscopic metastases to 4TO7 cells that were injected into the tail vein, mixed within the same mammary tumor, or orthotopically implanted at a distant mammary site. Importantly, transfer of miR-200 mediated much of the increased metastasis, since antagonizing the miR-200 family in either the donor or recipient tumor cells largely blocked the increase in metastases. Residual increased metastasis might have been due to incomplete antagonism of miR-200 or to transfer of other proteins or nucleic acids within the tumor EVs or even to uptake of EVs by nontumor cells to enhance tumor cell invasion of the local tissue and/or the tumor niches at sites of distant tumor extravasation. Our results suggest that it was unlikely that malignant 4T1E tumor cells were acting directly on less metastatic cells in the lung because lung metastases were almost exclusively formed by either the metastatic or poorly metastatic clone.
We then examined whether miR-200 transfer could promote metastasis of xenografted human breast cancer cells. miR-200s were highly expressed and secreted in EVs by metastatic epithelial CA1a and BPLER cells, but not by poorly metastatic mesenchymal MB-231 cells. Although MB-231 cells are unrelated to CA1a and BPLER, they took up miR-200s in EVs from CA1a and BPLER cells and became more metastatic in xenograft models. Our results are consistent with a study that found that miR-200a overexpression in MB-231 cells enhances colonization (8). We did not test the transfer of miR-200s to human cell lines with genetic background similar to that of CA1a and BPLER cells (such as CA1h and HMLER cells, respectively) because these cells also express high levels of miR-200s and have epithelial morphology. However, primary tumors in breast cancer patients are often more heterogenous than cell lines. Primary tumors may contain both epithelial miR-200–expressing cells and mesenchymal cells that do not express miR-200 that could communicate with each other through EVs.
Our original observation that miR-200 expression, which suppresses EMT and enhances MET, improved metastases in the 4TO7/4T1E system was initially greeted with skepticism because the prevailing model at the time was that EMT was the critical step in metastasis (6). In fact, for some cancers, ectopic miR-200 expression reduces metastases (25). However, our results proposing prometastatic properties of miR-200s in breast cancer cells were later confirmed (7–9) and are further bolstered by our findings here. Moreover, the correlation between miR-200 expression and human breast cancer metastasis and relapse (7, 17) and our results using human breast cancer cell lines in Figures 13–15 suggest that our results in the mouse model are not an aberration. miR-200’s action is multifactorial — it not only enhances epithelial traits, but also suppresses the secretion of antimetastatic factors (7). Although the early steps of metastasis (invasion through the basement membrane, intravasation, and extravasation into other tissues) in some tumors are facilitated by mesenchymal gene expression that promotes invasivity and motility, the rate-limiting step of forming tumors in distal sites is facilitated by epithelial gene expression. The successful metastatic tumor cell may coexpress both epithelial and mesenchymal genes (for example, 4T1E cells express both vimentin and E-cadherin; ref. 6), and their ratios may be plastic, changing according to the strength of environmental signals at different sites or selection for survival/proliferation at different locations (2).
A biphasic role of miR-200 is also supported by other studies that show that primary cancer cells downregulate miR-200 expression at the invasive front where they undergo EMT and upregulate miR-200s in the resulting metastasis where MET facilitates colonization of a distant tissue (9, 26, 27). Given the observed transfer of miR-200s from aggressive to less-aggressive cancer cells, it is possible that cancer cells within the primary tumor may initially release miR-200s in EVs to activate an EMT program for invasion and dissemination and then reacquire these EVs or reexpress miR-200 at the metastatic site to undergo MET for colonization.
One unresolved question is whether miRNA secretion in EVs is random, reflecting miRNA cellular expression, or selective, reflecting an active sorting of specific miRNAs. Here, we found that the distribution of miRNAs in EVs paralleled their abundance in the cell of origin. These results suggest the absence of a selective mechanism. Our data also showed that some of the miRNAs in EVs are associated with Ago2. Therefore, some miRNAs within EVs are likely contained in RNA-induced silencing complexes (RISC) that may be immediately active in the recipient cell. Future studies should investigate what proportion of EV miRNAs are RISC bound and the kinetics of miRNA-mediated alterations in recipient cells. miR-200 uptake by poorly metastatic 4TO7 cells was greater after direct coculture than indirect Transwell coculture (Figures 2 and 3). This difference might be due to transfer of miR-200 through gap junctions in addition to EVs. In this study, we focused only on EV-mediated delivery of miR-200s to explore the effect of circulating miR-200 in metastasis.
In summary, we demonstrated in mouse and human breast cancer metastasis models that miR-200, which might be induced by environmental or epigenetic changes or by uptake of extracellular miR-200–containing vesicles, facilitates cancer cell colonization of distant tissues. miR-200 miRNAs can be transferred to other cells either locally or at a distance to propagate metastatic potential. The transfer might occur within the primary tumor, in the circulation as the malignant cells travel in the bloodstream, or at metastatic sites.
Methods
Cell culture.
4T1, 4TO7, 67NR, and MCF10CA1a cells were provided by Fred Miller (Wayne State University, Detroit, Michigan, USA). MDA–MB-231 cells were obtained from ATCC. BPLER cells were provided by Tan Ince (University of Miami, Miami, Florida, USA). 4TO7V, 4TO7OE, and 4T1E cells were previously generated in our lab (6, 20). 4TO7 and MB-231 cells stably expressing firefly luciferase and mCherry were selected after infection with pLV-Fluc-mCherry-Puro lentivirus (provided by Andrew Kung, Columbia University, New York, New York, USA). 4T1E, 4TO7OE, and 4TO7V cells stably expressing eGFP were generated with pCAG-eGFP lentiviral plasmid (Addgene). 4T1E, 4TO7, BPLER, and CA1a cells were transduced with control or anti–miR-200–TuD lentivirus using the TuD plasmids provided by Hideo Iba (University of Tokyo, Tokyo, Japan; ref. 28). All cell lines were maintained in DMEM (Gibco; Invitrogen) with 10% FBS, 1 mM l-glutamine, and penicillin/streptomycin (Gibco; Invitrogen), except BPLER cells, which were maintained in WIT-T medium (Stemgent).
EV size analysis and purification.
Cells were plated at 106 cells/5 cm2 and cultured for 48 hours in EV-free medium. To purify EVs from culture supernatants, dead cells and debris were removed by centrifugation at 300 g for 10 minutes, 820 g for 15 minutes, and 4,060 g for 5 minutes at 4°C and passage through an 8-μm syringe filter. EVs were pelleted by ultracentrifugation at 110,000 g for 90 minutes at 4°C using an SW28 rotor (Beckman). EVs were washed with PBS and ultracentrifuged again. Protein concentration in EVs was determined using BCA protein assay (ThermoScientific). The size distribution of EVs in culture supernatants was determined using a NanoSight Tracking Analysis LM10 System.
RNA extraction from culture-supernatant EVs and cells and RNA quantification.
Total RNA was extracted from EVs, untreated or treated with 0.1 mg/ml RNase A and 0.1% Triton X-100 (Sigma-Aldrich), by using Trizol LS (Life Technologies). The levels of miRNAs were quantified by either the multiplex Firefly Cellular miRNA Assay (Firefly BioWorks) or individually using TaqMan miRNA assays (Life Technologies). For TaqMan assays, the copy number of each miRNA per microgram of EV protein was calculated based on a standard curve of Ct obtained with a synthetic miR-200c. Expression of cellular miRNAs was quantified by TaqMan miRNA assays and normalized to the expression of U6 snRNA. To measure miRNAs in small and large EVs separately, total RNA was extracted from EVs using the ExoMir Kit (Bioo Scientific) before TaqMan miRNA assay. qRT-PCR analysis of primary miRNA transcripts and mRNAs used the Ssofast Evagreen qPCR assay (Bio-Rad). Primers were designed as previously described (6, 7).
miRNA quantification in sera of tumor-bearing mice.
4TO7 or 4T1E cells (1.25 × 10⁵) were implanted in the right first mammary fat pads of 8-week-old female BALB/c mice (Jackson Laboratory). When the tumor diameter approached 15 mm, blood was obtained by cardiac puncture. Serum was isolated by centrifugation at 3,000 g for 15 minutes. EVs were purified from the serum by overnight incubation with ExoQuick precipitation reagent (System Biosciences) at 4°C, pelleted by centrifugation at 1,500 g for 15 minutes, resuspended in RNase-free water, and mixed with Trizol LS for RNA extraction and TaqMan miRNA assays (sera from 2 mice were combined for each sample). To detect metastases, lungs excised from tumor-bearing mice were sectioned and stained with H&E.
CA1a or BPLER cells (3 × 10⁵) were implanted in the flanks of 8-week-old female nude mice. When the tumor diameter approached 20 mm (12 weeks after implantation), blood was obtained by cardiac puncture. Serum was isolated by centrifugation at 4,000 g for 1 minute, and 40 μl was used directly in the firefly circulating miRNA assay.
Coculture of breast cancer cells.
4TO7-GFP cells were mixed with 4T1E cells in a 1:1 or 1:4 ratio. After 48 hours, 4TO7-GFP cells were sorted by flow cytometry based on GFP. For Transwell coculture, 4T1E cells were plated in 3-μm porous Transwell inserts (Corning) hanging above 4TO7 cells plated at a 1:4 (4TO7:4T1E) ratio and cocultured for 6 days. In control wells with only 4T1E cells in the Transwell inserts, no cells were detected at the bottom of the well after 6 days, confirming that 4T1E cells were unable to cross the Transwell membrane. Similarly, CA1a or BPLER cells were plated in the Transwell inserts hanging above MB-231 cells at a 1:4 ratio and cocultured for 3 days.
Western blot analysis.
Total cell lysates were extracted from EVs or cells by incubating with RIPA buffer supplemented with protease inhibitors (Roche). Proteins were separated on 10% polyacrylamide gels and transferred to a nitrocellulose membrane (GE Healthcare). Membranes were incubated with primary antibodies, mouse anti-ALIX (Santa Cruz Biotechnology Inc.), mouse anti-TSG101 (Santa Cruz Biotechnology Inc.), mouse anti-AGO2 (Abcam), rabbit anti-ZEB2 (Abcam), and mouse anti–E-cadherin (BD Biosciences), then with HRP-conjugated secondary antibodies (Santa Cruz Biotechnology Inc.).
Immunostaining of E-cadherin.
4TO7 and 4T1E cells, grown separately or cocultured on 18-mm cover slips in 12-well plates for 1 week, were fixed in 4% paraformaldehyde, blocked with 5% goat serum, permeabilized with 0.2% Triton X-100, and incubated with mouse anti–E-cadherin (BD Biosciences), then with AF647-conjugated secondary antibodies (Molecular Probes). The cover slips were mounted on glass slides using Vectashield mounting medium with DAPI (Vector Labs) and imaged with an Axiovert 200M microscope (Zeiss).
Luciferase reporter assay.
Two perfect complementary binding sites for miR-200c or miR-141 and a 12-nucleotide spacer were cloned into the psiCHECK-2 vector (Promega) immediately 3′ of the renilla luciferase gene. 50 ng of reporter plasmid was transfected into 4TO7 cells, using Lipofectamine 2000 (Life Technologies). Twenty-four hours after transfection, 4TO7 cells were washed twice and cocultured with untransfected 4TO7 or 4T1E cells in Transwell plates at a 1:4 ratio. After 48 hours of coculture, the Transwell inserts were removed and lysates were obtained from transfected 4TO7 cells. Firefly and renilla luciferase activities were measured with the Dual-Luciferase Reporter System (Promega).
Live cell imaging.
2 μg CD63-RFP plasmid (provided by Jatin Vyas, Whitehead Institute, Cambridge, Massachusetts, USA; ref. 29) or 4 μg eGFP-AGO2 plasmid (provided by Nancy Kedersha, Harvard Medical School) were cotransfected with 100 pmol Cy5–miR-200c mimics (Sigma-Aldrich) into 4T1E cells using Lipofectamine 2000. After 24 hours, 4T1E cells were trypsinized, washed with PBS, and plated in Transwell inserts. 4TO7 or 4TO7-GFP cells were plated on cover slips below the Transwell inserts in 6-well plates. The Transwell inserts were removed after 48 hours of 1:2 coculture. 4TO7 cells were stained with CellMask Orange plasma membrane dye (Life Technologies). Cover slips with 4TO7 cells were transferred to live cell–imaging chambers. Images were obtained using a Spinning Disk confocal microscope (Carl Zeiss Microimaging).
EV treatment and in vivo lung colony assay.
4TO7 cells (4 × 10⁵) were treated with 500 μg EVs purified from the culture supernatants of 4TO7 or 4T1E cells (in some cases expressing control/anti–miR-200–TuD) and culture cultured for 3 days in EV-free medium. Alternatively, 4TO7 cells were transfected with a mixture of 100 pmol anti–miR-200c and 100 pmol anti–miR-141 or with 200 pmol negative control anti-miR (Life Technologies). Twenty-four hours after transfection, 5 × 10⁵ anti-miR–transfected 4TO7 cells were incubated with 150 μg EVs purified from the supernatants of 4TO7V or 4TO7OE cells for 4 days. Following EV treatment, 1.5 × 10⁵ untransfected cells or 2 × 10⁵ anti-miR–transfected cells were injected i.v. in the tail veins of 8-week-old female BALB/c mice. Eight days later, the mice were sacrificed and the lungs were injected intratracheally with India ink and fixed in Fekete’s solution overnight. Metastasis was quantified by counting the number of white colonies on the lung surface. To evaluate the effect of in vivo–secreted EVs, 1.25 × 10⁵ 4TO7V or 4TO7OE cells were injected into the right first mammary fat pads of 8-week-old female BALB/c mice. After 10 days, when the tumor diameter approached 9 mm, 3 × 10⁵ untreated 4TO7 cells were injected into the tail vein. Lung colonies were counted 8 days later.
Metastasis analysis by luminescent in vivo imaging.
4TO7V-GFP cells or 4TO7OE-GFP cells (1.25 × 10⁵) were injected into the right fourth mammary fat pads of 9-week-old female BALB/c SCID mice. When the tumor diameter reached 9 mm, 3 × 10⁵ 4TO7-Fluc-mCherry cells were injected into the tail vein. Luminescent images of the whole body were taken every 2 days using the IVIS Lumina II System (Caliper Life Sciences) following i.p. injection of 150 mg/kg d-luciferin (Caliper Life Sciences). On day 8, mice were sacrificed and the lungs were excised and imaged for luminescence, mCherry, and GFP.
To test the interaction of metastatic and nonmetastatic cells in the same tumor or between 2 orthotopic tumors, 9-week-old female BALB/c SCID mice were injected with 1.25 × 10⁵ 4TO7-Fluc-mCherry cells with or without TuD and the same number of 4T1E-GFP, 4TO7OE-GFP, or 4TO7V-GFP cells together in the right fourth mammary fat pads or separately in the left and right fourth mammary fat pads. Luminescent images were taken every 5 days. On day 20 (for the bilateral fat-pad injection) or day 23 (for the single fat-pad injection), mice were sacrificed and lungs were excised for imaging. Tumor dimensions were also measured by digital calipers.
MB-231–Fluc–mCherry cells were incubated with 500 μg EVs purified from the culture supernatants of unlabeled MB-231, CA1a, or BPLER cells. After 3 days, 5 × 105 MB-231–Fluc–mCherry cells were injected into the tail veins of 8-week-old female nude mice. Luminescent images were taken every week. After 5 weeks, the lungs were excised and lung luminescence was compared.
CA1a cells stably expressing anti–miR-200 or control TuD (5 × 10⁵) were implanted in the flanks of 8-week-old female nude mice. After 2 weeks, when the tumors reached 7 to 9 mm, 1.5 × 106 MB-231–Fluc–mCherry cells were injected into the tail vein. Luminescent images were taken every week. After 3 or 4 weeks, when the primary tumors approached 20 mm, the lungs were excised and lung luminescence was compared.
All luminescent and fluorescent images were acquired and analyzed using Living Image software (Caliper Life Sciences).
Statistics.
Student’s t tests, computed using Microsoft Excel, were used to analyze the significance between the treated samples and the controls where the test type was set to 1-tail distribution and 2-sample equal variance. The Mann-Whitney U test, performed using GraphPad Prism 6, was used to calculate the significance when the data did not follow a normal distribution. P ≤ 0.05 was considered significant. In all bar graphs, data are presented as average ± SEM.
Study approval.
All animal procedures were approved by the Harvard Medical School and Boston Children’s Hospital Animal Care and Use Committees.
Supplementary Material
Acknowledgments
This work was supported by the Jane Coffin Childs Fund (project no. 61-1465 to M.T.N. Le), a Fulbright Visiting Scholar grant (1213204 to P. Hamar), and a Portuguese Ministry of Science and Technology Ph.D. fellowship (SFRH/BD/37188/2007 to R. Perdigão-Henriques). The authors thank members of the Lieberman and Breakefield labs, Daniel Pregibon (Firefly BioWorks), Wai Leong Tam (Whitehead Institute), Andrew Kung (Columbia University), and Pierre-Yves Mantel (Harvard School of Public Health) for helpful suggestions.
Footnotes
Conflict of interest: The authors have declared that no conflict of interest exists.
Reference information:J Clin Invest. 2014;124(12):5109–5128. doi:10.1172/JCI75695.
See the related Commentary beginning on page 5107.
References
- 1.Vanharanta S, Massagué J. Origins of metastatic traits. Cancer Cell. 2013;24(4):410–421. doi: 10.1016/j.ccr.2013.09.007. [DOI] [PMC free article] [PubMed] [Google Scholar]
- 2.Cheung KJ, Gabrielson E, Werb Z, Ewald AJ. Collective invasion in breast cancer requires a conserved basal epithelial program. Cell. 2013;155(7):1639–1651. doi: 10.1016/j.cell.2013.11.029. [DOI] [PMC free article] [PubMed] [Google Scholar]
- 3.Tsai JH, Donaher JL, Murphy DA, Chau S, Yang J. Spatiotemporal regulation of epithelial-mesenchymal transition is essential for squamous cell carcinoma metastasis. Cancer Cell. 2012;22(6):725–736. doi: 10.1016/j.ccr.2012.09.022. [DOI] [PMC free article] [PubMed] [Google Scholar]
- 4.Park S-M, Gaur AB, Lengyel E, Peter ME. The miR-200 family determines the epithelial phenotype of cancer cells by targeting the E-cadherin repressors ZEB1 and ZEB2. Genes Dev. 2008;22(7):894–907. doi: 10.1101/gad.1640608. [DOI] [PMC free article] [PubMed] [Google Scholar]
- 5.Aslakson CJ, Miller FR. Selective events in the metastatic process defined by analysis of the sequential dissemination of subpopulations of a mouse mammary tumor. Cancer Res. 1992;52(6):1399–1405. [PubMed] [Google Scholar]
- 6.Dykxhoorn DM, et al. miR-200 enhances mouse breast cancer cell colonization to form distant metastases. PLoS One. 2009;4(9):e7181. doi: 10.1371/journal.pone.0007181. [DOI] [PMC free article] [PubMed] [Google Scholar]
- 7.Korpal M, et al. Direct targeting of Sec23a by miR-200s influences cancer cell secretome and promotes metastatic colonization. Nat Med. 2011;17(9):1101–1108. doi: 10.1038/nm.2401. [DOI] [PMC free article] [PubMed] [Google Scholar]
- 8.Yu S-J, et al. MicroRNA-200a promotes anoikis resistance and metastasis by targeting YAP1 in human breast cancer. Clin Cancer Res Off J Am Assoc Cancer Res. 2013;19(6):1389–1399. doi: 10.1158/1078-0432.CCR-12-1959. [DOI] [PubMed] [Google Scholar]
- 9.Lussier YA, et al. MicroRNA expression characterizes oligometastasis(es). PLoS One. 2011;6(12):e28650. doi: 10.1371/journal.pone.0028650. [DOI] [PMC free article] [PubMed] [Google Scholar]
- 10.Martins VR, Dias MS, Hainaut P. Tumor-cell-derived microvesicles as carriers of molecular information in cancer. Curr Opin Oncol. 2013;25(1):66–75. doi: 10.1097/CCO.0b013e32835b7c81. [DOI] [PubMed] [Google Scholar]
- 11.Bobrie A, et al. Rab27a supports exosome-dependent and -independent mechanisms that modify the tumor microenvironment and can promote tumor progression. Cancer Res. 2012;72(19):4920–4930. doi: 10.1158/0008-5472.CAN-12-0925. [DOI] [PubMed] [Google Scholar]
- 12.Kosaka N, Iguchi H, Ochiya T. Circulating microRNA in body fluid: a new potential biomarker for cancer diagnosis and prognosis. Cancer Sci. 2010;101(10):2087–2092. doi: 10.1111/j.1349-7006.2010.01650.x. [DOI] [PMC free article] [PubMed] [Google Scholar]
- 13.Li A, et al. Pancreatic cancers epigenetically silence SIP1 and hypomethylate and overexpress miR-200a/200b in association with elevated circulating miR-200a and miR-200b levels. Cancer Res. 2010;70(13):5226–5237. doi: 10.1158/0008-5472.CAN-09-4227. [DOI] [PMC free article] [PubMed] [Google Scholar]
- 14.Mitchell PS, et al. Circulating microRNAs as stable blood-based markers for cancer detection. Proc Natl Acad Sci U S A. 2008;105(30):10513–10518. doi: 10.1073/pnas.0804549105. [DOI] [PMC free article] [PubMed] [Google Scholar]
- 15.Taylor DD, Gercel-Taylor C. MicroRNA signatures of tumor-derived exosomes as diagnostic biomarkers of ovarian cancer. Gynecol Oncol. 2008;110(1):13–21. doi: 10.1016/j.ygyno.2008.04.033. [DOI] [PubMed] [Google Scholar]
- 16.Toiyama Y, et al. Serum miR-200c is a novel prognostic and metastasis-predictive biomarker in patients with colorectal cancer. Ann Surg. 2014;259(4):735–743. doi: 10.1097/SLA.0b013e3182a6909d. [DOI] [PMC free article] [PubMed] [Google Scholar]
- 17.Gravgaard KH, et al. The miRNA-200 family and miRNA-9 exhibit differential expression in primary versus corresponding metastatic tissue in breast cancer. Breast Cancer Res Treat. 2012;134(1):207–217. doi: 10.1007/s10549-012-1969-9. [DOI] [PubMed] [Google Scholar]
- 18.Madhavan D, et al. Circulating miRNAs as surrogate markers for circulating tumor cells and prognostic markers in metastatic breast cancer. Clin Cancer Res. 2012;18(21):5972–5982. doi: 10.1158/1078-0432.CCR-12-1407. [DOI] [PubMed] [Google Scholar]
- 19.Teplyuk NM, et al. MicroRNAs in cerebrospinal fluid identify glioblastoma and metastatic brain cancers and reflect disease activity. Neuro Oncol. 2012;14(6):689–700. doi: 10.1093/neuonc/nos074. [DOI] [PMC free article] [PubMed] [Google Scholar]
- 20.Petrocca F, et al. A genome-wide siRNA screen identifies proteasome addiction as a vulnerability of basal-like triple-negative breast cancer cells. Cancer Cell. 2013;24(2):182–196. doi: 10.1016/j.ccr.2013.07.008. [DOI] [PMC free article] [PubMed] [Google Scholar]
- 21.Tao K, Fang M, Alroy J, Sahagian GG. Imagable 4T1 model for the study of late stage breast cancer. BMC Cancer. 2008;8(1):228. doi: 10.1186/1471-2407-8-228. [DOI] [PMC free article] [PubMed] [Google Scholar]
- 22.Santner SJ, et al. Malignant MCF10CA1 cell lines derived from premalignant human breast epithelial MCF10AT cells. Breast Cancer Res Treat. 2001;65(2):101–110. doi: 10.1023/A:1006461422273. [DOI] [PubMed] [Google Scholar]
- 23.Ince TA, et al. Transformation of different human breast epithelial cell types leads to distinct tumor phenotypes. Cancer Cell. 2007;12(2):160–170. doi: 10.1016/j.ccr.2007.06.013. [DOI] [PubMed] [Google Scholar]
- 24.Price JE, Polyzos A, Zhang RD, Daniels LM. Tumorigenicity and metastasis of human breast carcinoma cell lines in nude mice. Cancer Res. 1990;50(3):717–721. [PubMed] [Google Scholar]
- 25.Pecot CV, et al. Tumour angiogenesis regulation by the miR-200 family. Nat Commun. 2013;4:2427. doi: 10.1038/ncomms3427. [DOI] [PMC free article] [PubMed] [Google Scholar]
- 26.Hur K, et al. MicroRNA-200c modulates epithelial-to-mesenchymal transition (EMT) in human colorectal cancer metastasis. Gut. 2012;62(9):1315–1326. doi: 10.1136/gutjnl-2011-301846. [DOI] [PMC free article] [PubMed] [Google Scholar]
- 27.Paterson EL, et al. Down-regulation of the miRNA-200 family at the invasive front of colorectal cancers with degraded basement membrane indicates EMT is involved in cancer progression. Neoplasia. 2013;15(2):180. doi: 10.1593/neo.121828. [DOI] [PMC free article] [PubMed] [Google Scholar]
- 28.Haraguchi T, et al. A potent 2′-O-methylated RNA-based microRNA inhibitor with unique secondary structures. Nucleic Acids Res. 2012;40(8):e58. doi: 10.1093/nar/gkr1317. [DOI] [PMC free article] [PubMed] [Google Scholar]
- 29.Artavanis-Tsakonas K, Love JC, Ploegh HL, Vyas JM. Recruitment of CD63 to Cryptococcus neoformans phagosomes requires acidification. Proc Natl Acad Sci U S A. 2006;103(43):15945–15950. doi: 10.1073/pnas.0607528103. [DOI] [PMC free article] [PubMed] [Google Scholar]
Associated Data
This section collects any data citations, data availability statements, or supplementary materials included in this article.


