

Abstract
Cerium dioxide nanoparticles (CeO2 NP) hold great therapeutic potential, but the in vivo effects of non-pulmonary exposure routes are unclear. The first aim was to determine whether microvascular function is impaired after intravenous and gastric CeO2 NP exposure. The second aim was to investigate the mechanism(s) of action underlying microvascular dysfunction following CeO2 NP exposure. Rats were exposed to CeO2 NP (primary diameter: 4 ± 1 nm, surface area: 81.36 m2/g) by intratracheal instillation, intravenous injection, or gastric gavage. Mesenteric arterioles were harvested 24 h post-exposure and vascular function was assessed using an isolated arteriole preparation. Endothelium-dependent and independent function and vascular smooth muscle (VSM) signaling (soluble guanylyl cyclase [sGC] and cyclic guanosine monophosphate [cGMP]) were assessed. Reactive oxygen species (ROS) generation and nitric oxide (NO) production were analyzed. Compared with controls, endothelium-dependent and independent dilation were impaired following intravenous injection (by 61% and 45%) and gastric gavage (by 63% and 49%). However, intravenous injection resulted in greater microvascular impairment (16% and 35%) compared with gastric gavage at an identical dose (100 µg). Furthermore, sGC activation and cGMP responsiveness were impaired following pulmonary, intravenous, and gastric CeO2 NP treatment. Finally, nanoparticle exposure resulted in route-dependent, increased ROS generation and decreased NO production. These results indicate that CeO2 NP exposure route differentially impairs microvascular function, which may be mechanistically linked to decreased NO production and subsequent VSM signaling. Fully understanding the mechanisms behind CeO2 NP in vivo effects is a critical step in the continued therapeutic development of this nanoparticle.
Keywords: cerium dioxide nanoparticles, microvascular function, nitric oxide, mesentery
Cerium dioxide nanoparticles (CeO2 NP) are an anthropogenic homogenous mixture of particles with one dimension less than or equal to 100 nm (Borm et al., 2006). Unique physical characteristics displayed at this size contribute to CeO2 NP diverse applications. Presently, CeO2 NP are widely used as a fuel additive because they increase the combustion efficiency of diesel engines (via enhanced catalytic activity) (Cassee et al., 2011). CeO2 NP may also potentially protect against tissue damage associated with radiation treatments and stroke in biomedical applications (Celardo et al., 2011). Tissue damage in these conditions is largely derived from increased reactive oxygen species (ROS) generation. CeO2 NP may prevent tissue damage from ROS due to their anti-oxidant capabilities (Kim et al., 2012). This anti-oxidant potential comes from the ability of CeO2 NP to react with ROS, which in turn alters its valence state (cycling between Ce4+ and Ce3+) (Heckert et al., 2008). The diverse and potentially widespread future applications mandate that the concept of intentional and unintentional CeO2 NP exposure (via multiple routes) be given full toxicological consideration.
Currently, the lungs are the most common CeO2 NP exposure route. This is largely due to the occupational inhalation risk associated with the manufacturing process where CeO2 NP are easily aerosolized (Department of Health and Human Services, 2009). Furthermore, the risk of environmental pulmonary exposures may increase due to the presence of CeO2 NP in diesel engine emissions. The lack of governmental regulations in Europe and the United States further elevates this exposure risk (Cassee et al., 2011). Pulmonary CeO2 NP exposure has been associated with inflammation and granuloma formation (Ma et al., 2011). These exposures have also resulted in extra-pulmonary biological effects including inflammation, organ toxicity, and vascular impairments (Minarchick et al., 2013; Nalabotu et al., 2011; Wingard et al., 2011). Although pulmonary CeO2 NP exposure is associated with several untoward biological outcomes, neither these effects nor their intensities have been extensively studied or compared when the nanoparticles are given by alternate exposure routes.
At this time, CeO2 NP exposure by non-pulmonary routes (intravenous and oral) is not an obvious risk. However, if CeO2 NP are to be fully developed for systemic therapeutic applications, the biological effects that follow CeO2 NP exposure by these clinically relevant exposure routes must be better understood. In vivo, studies investigating the outcomes of intravenous and oral CeO2 NP exposures have largely focused on long-term biological responses (1–3 months post-exposure), including organ distribution, and overt organ toxicity (Hirst et al., 2013; Yokel et al., 2012). Despite the fundamental role of the microcirculation in blood flow control, pressure regulation, and permeability in all tissues (Renkin, 1984; Zweifach, 1984), no investigation to date has analyzed the effects of intravenous and oral CeO2 NP exposures on normal microvascular function.
In the microcirculation, the arterioles respond to a variety of chemical and mechanical stimuli (Gewaltig and Kojda, 2002). Under normal conditions, nitric oxide (NO) diffuses freely from endothelial cells to vascular smooth muscle (VSM) cells. This initiates a signaling cascade that activates soluble guanylyl cyclase (sGC), increases cyclic guanosine monophosphate (cGMP), and stimulates cGMP-protein kinase (PKG) (Schlossmann et al., 2003; Taylor et al., 2004). This signaling cascade decreases intracellular calcium (Ca2+) and, ultimately, relaxes VSM (Taylor et al., 2004). Disruptions in VSM signaling may compromise microvascular function and, if unresolved, may contribute to the development of numerous pathological conditions (Li and Forstermann, 2000).
We have previously established that pulmonary CeO2 NP exposure results in systemic microvascular dysfunction (Minarchick et al., 2013). However, the presence of microvascular dysfunction following alternate exposure routes and the possible mechanism(s) of these impairments are currently unknown. Therefore, the aims of this study were two-fold. The first aim was to determine whether microvascular impairment followed intravenous injection and gastric gavage of CeO2 NP. The second aim was to provide mechanistic insight into the link between CeO2 NP exposure and microvascular function following three distinct exposure routes (intratracheal instillation, intravenous injection, and gastric gavage). Based on our pulmonary results, we hypothesized that intravenous and gastric exposures will also result in microvascular impairment, but to differing degrees, and the source of this dysfunction will be, at least partly, due to changes in NO bioavailability and/or VSM signaling. Microvascular impairment and NO bioavailability were assessed in freshly isolated arterioles 24 h following CeO2 NP exposure.
MATERIALS AND METHODS
CeO2 NP production and characterization
CeO2 NP powders were synthesized by a hydrothermal process as previously described (Minarchick et al., 2013). Briefly, cerium (IV) ammonium nitrate (99+% [Alfa Aesar, Ward Hill, Massachusetts]) was added to de-ionized water (H2O) and this solution was added drop-wise into a basic solution of tetramethylammonium hydroxide pentahydrate (TMAOH) and de-ionized H2O. The pH of the dispersion was altered to approximately 10.5 with ammonium hydroxide and was maintained throughout the reaction. The dispersion was placed in a 300 ml Autoclave Engineers EZE-Seal autoclave (Erie, Pennsylvania) at 240°C for 1 h. Once removed from the autoclave, the dispersion was placed into a centrifuge and the liquid was removed and replaced with ethanol. After the washing step, the dispersion was dried at 60°C overnight and sieved through a 200 mesh screen for characterization. The nanoparticles were previously characterized (Minarchick et al., 2013). The CeO2 NP had a surface area of 81.36 m2/g measured by Micromeritics ASAP 2020 (Norcross, Georgia). Transmission electron micrographs were used to analyze ∼20 nanoparticles to determine the primary size (4 ± 1 nm) and shape (spherical) (JEOL JEM-2100 High Resolution Transmission Electron Microscope [TEM] [Peabody, Massachusetts]). The average agglomerate size in saline (Normosol-R [Nospira Inc, Lake Forest, Illinois]) and 5% fetal bovine serum (FBS) was 191 nm as determined by dynamic light scattering (Malvern Zetasizer version 7.01 [Westborough, Massachusetts]). FBS was added to the solution because it has the propensity to reduce nanoparticle agglomeration (Porter et al., 2008). Finally, the valence state of the CeO2 NP was 81% Ce4+ and 19% Ce3+ determined by x-ray photoelectron spectroscopy (PHI 5000 Versaprobe XPS [Chanhassen, Minnesota]).
Experimental animals
Male Sprague Dawley rats (8–11 week old) were purchased from Hilltop Laboratories (Scottdale, Pennsylvania). The rats were housed at the West Virginia University Health Sciences Center Vivarium, in laminar flow cages, under controlled humidity and temperature, with a 12 h light/dark cycle, and food and water were provided ad libitum. Prior to use, the animals were acclimated for at least 2 days. All procedures were approved by the Institutional Animal Care and Use Committee at West Virginia University.
CeO2 NP exposure models
For the stock suspensions, the dry powder was weighed (0–10 mg) and added to 10 ml of Normosol-R with 5% FBS. The amount of dried powder weighed initially was adjusted to obtain the following final CeO2 NP concentrations: 0 (saline and 5% FBS), 50, 65, 100, 300, 400, 600, and 900 µg per rat. The doses selected for the intravenous injection (50, 100, and 900 µg) and gastric gavage (100, 300, and 600 µg) groups were selected to establish individual dose-response determinations for each exposure route. They were selected in attempt to encompass the minimal and maximal microvascular responses. We also anticipated these responses to be different for each exposure route. These doses cover a range of 0.14 mg/kg to 2.57 mg/kg (based on representative animal weight of 350 g) (Tables 1 and 2). This range is within those previously reported for other in vivo studies with this nanoparticle (Hirst et al., 2013; Kim et al., 2012; Yokel et al., 2012). The CeO2 NP were vortexed for 5 min and then sonicated on ice for an additional 5 min. Rats were lightly anesthetized with isoflurane gas (5% induction, 2–3.5% maintenance) and exposed by one of the following exposure routes. Intravenous injection: Rats were injected in the tail vein with a bolus dose (900 µl) of CeO2 NP stock suspension using a 23 G needle. The final doses were 0 (saline and 5% FBS), 50, 100, and 900 µg per rat. Although the 100 µg dose was part of the initial dose-response determination, this was also the dose that caused a 50% impairment in arteriolar reactivity (EC50) and was then used for the subsequent experiments utilizing the EC50. Gastric gavage: Rats were gavaged with a bolus dose (300 µl) of CeO2 NP stock suspension via a ball tipped needle. The final doses were 0 (saline and 5% FBS), 100, 300, 400, and 600 µg per rat. The 400 µg dose was the result of the EC50 calculation, and was only used after the initial dose-response was determined. Intratracheal instillation: The dose-dependent microvascular effects of CeO2 NP after pulmonary instillation have been investigated previously (Hirst et al., 2013; Minarchick et al., 2013); however, the mechanism(s) of toxicity involved is still unknown. Therefore, intratracheal instillation, intravenous injection, and gastric gavage were used to study the mechanism(s) of action for CeO2 NP. In the current study, rats were instilled with a bolus dose (300 µl) of CeO2 NP stock suspension via a ball tipped needle. The final dose was 65 µg per rat. This dose was selected because previous experiments established that 65 µg of CeO2 NP was the EC50 for this exposure route (Minarchick et al., 2013). Furthermore, this dose was also determined to be relevant to occupational exposures (Minarchick et al., 2013). Rats were monitored after treatment until they regained consciousness. All animals were allowed to recover for 24 h prior to experimental assessments.
TABLE 1.
Animal Characteristics
| Groups | N | Age (weeks) | Weight (g) | MAP (mm Hg) | Heart Weight (g) |
|---|---|---|---|---|---|
| Control-Saline | 41 | 10.61 ± 0.4 | 392 ± 10 | 105 ± 4 | 1.28 ± 0.03 |
| Intravenous injection dose-response determination | |||||
| 50 µg CeO2 NP | 7 | 8.43 ± 0.3 | 338 ± 8 | 102 ± 2 | 1.22 ± 0.02 |
| 100 µg CeO2 NP | 8 | 9.76 ± 0.09 | 382 ± 3 | 112 ± 3 | 1.34 ± 0.01 |
| 900 µg CeO2 NP | 8 | 9.50 ± 0.28 | 364 ± 6 | 107 ± 2 | 1.31 ± 0.02 |
| Gastric Gavage Dose-Response Determination | |||||
| 100 µg CeO2 NP | 9 | 10.11 ± 0.4 | 383 ± 11 | 98 ± 4 | 1.30 ± 0.03 |
| 300 µg CeO2 NP | 8 | 9.38 ± 0.6 | 371 ± 17 | 100 ± 3 | 1.33 ± 0.04 |
| 600 µg CeO2 NP | 8 | 8.88 ± 0.4 | 376 ± 18 | 96 ± 4 | 1.29 ± 0.06 |
| Calculated EC50 doses (µg) | |||||
| 65 µg CeO2 NP (0.19 mg/kg via intratracheal instillation) | 14 | 9.45 ± 0.1 | 381 ± 4 | 99 ± 2 | 1.29 ± 0.02 |
| 100 µg CeO2 NP (0.29 mg/kg via intravenous injection) | 11 | 9.27 ± 0.1 | 384 ± 5 | 109 ± 1 | 1.32 ± 0.03 |
| 400 µg CeO2 NP (1.14 mg/kg via gastric gavage) | 21 | 9.59 ± 0.2 | 365 ± 8 | 98 ± 5 | 1.36 ± 0.07 |
Notes: Values are means ± SE. N = number of animals. MAP = mean arterial pressure. The mg/kg concentrations were calculated based on a representative animal weight of 350 g.
TABLE 2.
Basal Arteriolar Characteristics
| Groups | n | Diameter (µm) |
Tone (%) | WT (µm) | WLR | |
|---|---|---|---|---|---|---|
| Steady State | Max | |||||
| Control-Saline | 57 | 81 ± 2 | 117 ± 14 | 27 ± 2 | 16 ± 1.6 | 0.18 ± 0.01 |
| Intravenous injection dose-response determination | ||||||
| 50 µg CeO2 NP | 9 | 73 ± 3 | 104 ± 4 | 29 ± 2 | 13 ± 0.4 | 0.18 ± 0.01 |
| 100 µg CeO2 NP | 10 | 74 ± 3 | 104 ± 3 | 29 ± 3 | 12 ± 0.6 | 0.17 ± 0.01 |
| 900 µg CeO2 NP | 12 | 77 ± 3 | 111 ± 3 | 30 ± 2 | 13 ± 0.9 | 0.16 ± 0.01 |
| Gastric gavage dose-response determination | ||||||
| 100 µg CeO2 NP | 13 | 76 ± 4 | 104 ± 5 | 28 ± 2 | 12 ± 0.8 | 0.16 ± 0.01 |
| 300 µg CeO2 NP | 11 | 80 ± 3 | 113 ± 4 | 28 ± 2 | 14 ± 0.5 | 0.17 ± 0.01 |
| 600 µg CeO2 NP | 12 | 78 ± 4 | 107 ± 5 | 27 ± 2 | 12 ± 0.5 | 0.16 ± 0.01 |
| Calculated EC50 doses (µg) | ||||||
| 65 µg CeO2 NP (0.19 mg/kg via intratracheal instillation) | 13 | 80 ± 3 | 110 ± 4 | 27 ± 2 | 11 ± 0.5 | 0.14 ± 0.01 |
| 100 µg CeO2 NP (0.29 mg/kg via intravenous injection) | 11 | 75 ± 4 | 108 ± 3 | 30 ± 3 | 12 ± 1.1 | 0.16 ± 0.01 |
| 400 µg CeO2 NP (1.14 mg/kg via gastric gavage) | 20 | 75 ± 2 | 101 ± 3 | 26 ± 1 | 12 ± 0.5 | 0.15 ± 0.01 |
Notes: Values are means ± SE. n = number of vessels. WT = wall thickness. WLR = wall-to-lumen ratio. The mg/kg concentrations were calculated based on a representative animal weight of 350 g.
Arterial pressure acquisition and isolated arteriole preparation
Arterial pressure and microvascular assessments were completed 24 h post-CeO2 NP exposure.
Rats were anesthetized with isoflurane gas (5% induction, 2–3.5% maintenance) and placed on a heating pad to maintain a 37°C rectal temperature. The trachea was intubated to ensure an open airway and the right carotid artery was cannulated to measure arterial pressure. Data were measured with a pressure transducer and recorded with PowerLab830 (ADInstruments, Colorado Springs, Colorado). Animals were euthanized by removal of the heart. The mesentery was then removed and placed in a dissecting dish with physiological salt solution (PSS) maintained at 4°C. Multiple (1–3) fourth- and fifth-order mesenteric arterioles were isolated, excised, and transferred to individual vessel chambers, cannulated between two glass pipettes, and secured with silk sutures (Living Systems Instrumentation, Burlington, Vermont). Each chamber was superfused with fresh, oxygenated (5% CO2/21% O2) PSS and warmed to 37°C. Arterioles were pressurized to 80 mm Hg using a servo control system and extended to their in situ length (Sun et al., 1992). Internal and external arteriolar diameters were measured with video calipers (Colorado Video, Boulder, Colorado).
Arteriolar reactivity
During equilibration, arterioles were allowed to develop spontaneous tone (≥20%) after which various parameters of arteriolar function were analyzed. Spontaneous tone is a unitless number that ranges from 0% to 100%, where 0% indicates an arteriole with no tone (or is at its maximal diameter) and 100% indicates an arteriole that is fully constricted. This number was calculated using the following equation: [(DM–DI)/DM] × 100, where DM is the maximal diameter (obtained at the conclusion of the experiment) of the arteriole and DI is the initial steady-state diameter at the beginning of the experiment. Steady-state diameter is defined as an arteriolar diameter that is constant for at least 1 min. Endothelium-dependent dilation: Arterioles were exposed to increasing concentrations of acetylcholine (ACh, 10−9–10−4 M) added to the vessel bath. Arterioles were also incubated with NG-monomethyl-L-arginine (L-NMMA, 10−4 M), a NO synthase inhibitor (NOS), and/or indomethacin (INDO, 10−5 M), a cyclooxygenase (COX) inhibitor, prior to the ACh dose-response determination when indicated. These inhibitors were used to assess the influence of NO and COX products, respectively. Endothelium-independent dilation: Increasing concentrations of the spontaneous NO donor, spermine NONOate (SPR, 10−9–10−4 M) were used to assess VSM responsiveness. Mechanotransduction: The VSM response to transmural pressure changes was analyzed by increasing the intraluminal pressure in 15 mm Hg increments from 0 to 120 mm Hg. The endothelial response to shear stress was assessed by increasing intraluminal flow in 5 µl/min increments from 0 to 30 µl/min. Arteriolar vasoconstriction: The arterioles were exposed to increasing concentrations of the α-adrenoceptor agonist, phenylephrine (PE, 10−9–10−4 M). VSM signaling: The arterioles were exposed to increasing concentrations of the sGC activator, 3 -(5′-hydroxymethyl-2′-furyl)-1-benzylindazole [YC-1, (10−9–10−4 M)] and the cGMP mimetic, 8-bromo-cGMP (10−7–10−4 M), to assess VSM signaling. YC-1 was used to determine NO-independent activation of sGC; however, YC-1 is capable of increasing sGC sensitivity to NO. Therefore, the YC-1 dose determination was completed in the presence of 1H-[1,2,4]oxadiazolo[4,3-a]quinoxalin-1-one (ODQ, 10−4 M), an irreversible NOS inhibitor.
In all experiments, the steady-state diameter of the arteriole was recorded for at least 1 min at each dose. Once a dose-response determination was completed, the vessel chamber was washed by carefully removing the superfusate and replacing it with fresh, warmed, oxygenated PSS. The dose-response determinations (typically 3–5) were performed in random order, expect for YC-1, which was performed last because of the irreversible nature of ODQ. After all experimental treatments were completed, the PSS was replaced with Ca2+-free PSS until the maximum passive diameter was established. All arterioles ⋚ 20% spontaneous tone or ≥ 150 µm internal diameter were not analyzed.
NO measurements
NO measurements were obtained using a free radical analyzer (Apollo 4000 [World Precision Instruments, Inc, Sarasota, Florida]). A 4-port water jacketed (34°C), biosensing chamber was used for the NO measurements. Three ports contained electrochemical probes that were covered with a semi-permeable membrane that was NO selective (ISO-NOP, World Precision Instruments, Inc). The probes were connected to the Apollo 4000 unit to make direct electrochemical NO measurements in real time (Nurkiewicz et al., 2009; Zhang, 2004). The fourth port contained a temperature probe that was removed to add reagents with a digital micropipettor. Electrodes were calibrated prior to use via S-nitroso-N-acetyl-D,L-penicillamine (SNAP, 4 × 10⁻⁵–1.6 × 10⁻⁴ M) decomposition to NO in a copper catalyst solution (cuprous chloride, 0.1 M). Data were collected at a rate of 10 samples per second and measurements were made only during steady-state responses that were at least 30 sec in duration. Acellular measurements: CeO2 NP (0–2 µg/ml) were placed in the water-jacketed chamber that contained 2 ml cuprous chloride (0.1 M). NO was measured in response to SNAP (1.6 × 10⁻⁴ M) decomposition in this solution. Vascular measurements: Mesenteric arteries and arterioles were dissected (24 h post-CeO2 NP exposure via all three exposure routes) in 4°C PSS, excised, and pooled to form a loose pellet. The pellet was placed into the water jacketed chamber that contained 2 ml Dulbecco’s phosphate buffered saline with Ca2+ (3.6 mM), L-arginine (0.2 mM) and tetrahydrobiopterin (BH4, 4 µM). NO production was stimulated with a bolus dose of the Ca2+ ionophore, A23187 (10−5 M). Data were normalized to tissue mass (nM/mg).
Free radical assessments
Electron spin resonance (ESR) was used for the detection of short-lived free radicals (superoxide and hydroxyl). Since these free radicals are highly reactive, an indirect method (spin-trapping) was used to measure these changes. This method required binding with a paramagnetic compound to form a longer-lived free radical product (spin adduct) and was ideal for detection and identification because of its specificity and sensitivity. All ESR measurements were collected using a Bruker EMX spectrometer (Billerica, Massachusetts). Hyperfine couplings were measured (to 0.1 G) directly from magnetic field separation using potassium tetraperoxochromate (K3CrO3) and 1,1-diphenyl-2-picrylhydrazyl as reference standards (Buettner, 1987; Janzen et al., 1987). The instrument settings were consistent for all experiments (center field [3475 G], sweep width [100 G], resolution [1024 points], gain [2.52× 10⁴], mod frequency [100 kHz], mod amplitude [1 G]). All spectra measured were the accumulation of multiple (1–3) scans. The relative free radical concentration was estimated by measuring the peak-to-peak height (mm) of the observed spectra. Acellular measurements: Xanthine (14 mM), xanthine oxidase (2 U), and the spin trap 5,5-dimethyl-1-pyrroline-N-oxide (DMPO [100 mM]) were added to an ESR flat cell and measured immediately to detect the generation of superoxide free radicals. Iron sulfate (0.001 mM), hydrogen peroxide (0.1 mM), and DMPO (100 mM) were added to an ESR flat cell and measured immediately to detect the generation of hydroxyl free radicals. These reactions were completed in both the presence and absence of CeO2 NP (0.5 and 2 mg/ml). Cellular measurements: Alveolar macrophages (AM) from control and CeO2 NP exposed rats (via all three exposure routes) were harvested 24 h post-CeO2 NP exposure through bronchoalveolar lavage (Minarchick et al., 2013). AM were suspended in phosphate-buffered saline (3 × 10⁶ cells/ml) and incubated with DMPO (200 mM) in the presence and absence of a positive control, hexavalent chromium (Cr6+, 2mM) and CeO2 NP (1 mg/ml) for 2 min at 37°C prior to being transferred to an ESR flat cell for measurements.
Equations
Spontaneous tone was calculated using the following equation: Spontaneous tone (%) = [(DM−DI)/DM] × 100, where DM is the maximal diameter and DI is the initial steady-state diameter recorded prior to any experimental assessments. Active responses to pressure were normalized to the maximal diameter using the following formula: Normalized diameter = DSS/DM, where DSS is the steady-state diameter recorded during each pressure change. The experimental responses to ACh, SPR, and flow are expressed using the following equation: Diameter (percent maximal response) = [DSS−DCon)/(DM−DCon)] x 100, where DCon is the control diameter recorded immediately prior to the dose-response determination, DSS is the steady-state diameter at each dose of the determination. Shear stress (τ) was calculated from volumetric flow (Q) using the following formula: τ = 4ηQ/πr3, where η is the viscosity (0.8 cp), Q is the volumetric flow rate (measured with a calibrated flow indicator [Living System Instruments, Burlington, Vermont]), and r is the arteriole radius. The experimental response to PE is expressed using the following equation: Diameter (percent maximal response) = −[DCon−DSS)/DCon] × 100. Wall thickness (WT) was calculated from the measurement of both inner (ID) and outer (OD) steady-state arteriolar diameters at the end of the Ca2+-free wash using the following equation: WT = (OD−ID)/2. Wall-to-lumen ratio (WLR) was calculated using the following equation: WLR = WT/ID.
Statistics
Data are expressed as means ± standard error (SE). Point-to-point differences in the dose-response determinations were evaluated using two-way repeated measures analysis of variance (ANOVA) with a Student-Newman-Keuls post hoc analysis when significance was found. Statistical differences among the slopes of the dose-response determinations were determined by either a linear or nonlinear regression analysis. Regression analysis was used to determine differences among collective data sets. Linear regression analysis was performed for predictable data sets where a step-wise stimuli or a typical biological response were observed. However, in biological systems a typical linear response is not always observed. In this case, a nonlinear regression analysis was applied to the data set. The animal characteristics, arteriolar characteristics, free radical peak height, and NO levels were analyzed using a one-way ANOVA with a Student-Newman-Keuls post hoc analysis when significance was found. The EC50 was determined using a four parameter logistic analysis. All statistical analyses were completed with GraphPad Prism 5 (San Diego, California) and SigmaPlot 11.0 (San Jose, California). Significance was set at p ≤ 0.05 and n is the number of arterioles.
RESULTS
Animal and Arteriolar Characteristics
There were no differences in animal age (Table 1). Similarly, CeO2 NP exposure route did not influence animal weight, mean arterial pressure, or heart weight (Table 1). Basal arteriolar diameter, spontaneous tone, WT, or WLR were also not affected by exposure route or dose (Table 2). These data suggest that basal arteriolar tone and/or anatomy are not affected by exposure route or CeO2 NP. However, it remains to be determined whether such exposures influence arteriolar tone in vivo.
Endothelium-Dependent Dilation
Endothelium-dependent arteriolar dilation was impaired significantly in a dose-dependent fashion following intravenous CeO2 NP injections of 50, 100, and 900 µg (Fig. 1A). Gastric CeO2 NP exposure impaired dilation to a lesser extent at the 100 and 300 µg doses, but the effect was similar at the higher doses (600 and 900 µg, Figs. 1A vs 1B). Taken together, these results indicate that CeO2 NP exposure impairs endothelium-dependent microvascular function via non-pulmonary exposure routes.
FIG. 1.
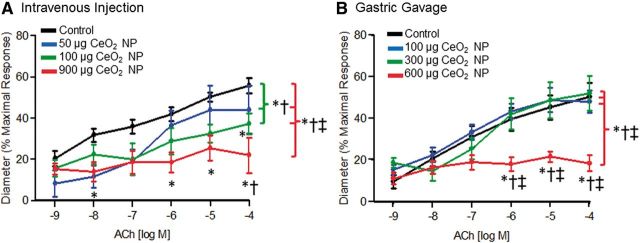
ACh-induced vasodilation was impaired in arterioles following intravenous injection (A, n = 8–15) and gastric gavage (B, n = 9–13) of CeO2 NP. *p ≤ 0.05 versus control, †p ≤ 0.05 versus low dose CeO2 NP (50 µg for intravenous injection and 100 µg for gastric gavage), ‡p ≤ 0.05 versus middle dose CeO2 NP (100 µg for intravenous injection and 300 µg for gastric gavage). The brackets indicate differences in the overall slope of the determination.
Endothelium-Independent Dilation
Vasodilation in response to NO donation was impaired significantly following intravenous CeO2 NP injection, but this effect was not dose-dependent (Fig. 2A). Exposure via gastric gavage also altered arteriolar VSM responsiveness. Interestingly, there was an augmented response to NO following 100 µg of CeO2 NP; however, 600 µg of CeO2 NP significantly attenuated the response to NO (Fig. 2B). These results provide evidence that CeO2 NP exposure also impairs endothelium-independent arteriolar VSM signaling.
FIG. 2.
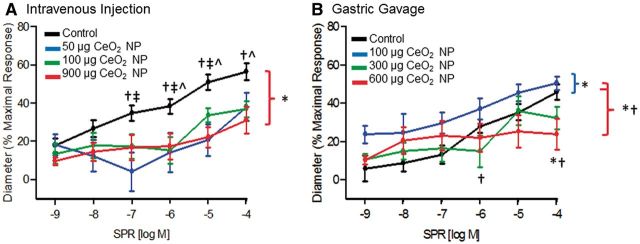
NO-induced vasodilation (via SPR) was impaired in mesenteric arterioles following intravenous injection (A, n = 8–12) and gastric gavage (B, n = 8–10) of CeO2 NP. *p ≤ 0.05 versus control, †p ≤ 0.05 versus low dose CeO2 NP (50 µg for intravenous injection and 100 µg for gastric gavage), ‡p ≤ 0.05 versus middle dose CeO2 NP (100 µg for intravenous injection and 300 µg for gastric gavage), ^p ≤ 0.05 versus high dose CeO2 NP (900 µg for intravenous injection and 600 µg for gastric gavage). The brackets indicate differences in the overall slope of the determination.
Mechanotransduction
Myogenic responsiveness was assessed from step-wise increases in transmural pressure. There were no significant differences in the myogenic responsiveness to pressure independent of CeO2 NP exposure route or dose (Figs. 3A and 3B). It is worthwhile to note that there was an augmentation of the myogenic response at the highest pressure (120 mm Hg) following gastric gavage of 100 µg of CeO2 NP (Fig. 3B). Because there were no overall differences in the slopes of these determinations and this augmentation occurred at a single pressure, the biological relevance of this observation is unclear. Vasodilation in response to changes in shear stress was assessed via increases in intraluminal flow. Independent of exposure route, there were no significant differences in the response to changes in intraluminal flow or endothelial shear stress (Figs. 4A–D). These data demonstrate that the ability of arterioles to transduce physical forces is unaffected by CeO2 NP given by alternate exposure routes.
FIG. 3.
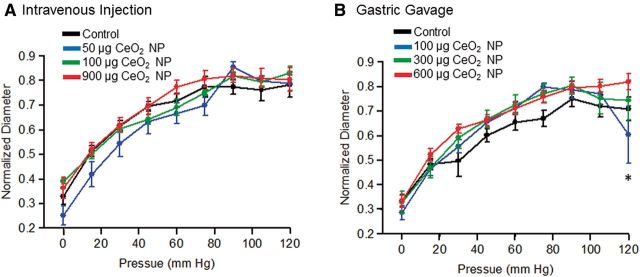
Vasodilation in response increasing intraluminal pressure following intravenous injection (A, n = 8–13) and gastric gavage (B, n = 9–10) of CeO2 NP was not significantly different. *p ≤ 0.05 versus control.
FIG. 4.

The left panels are vasodilation in response to increases in intraluminal flow following intravenous injection (A, n = 5–10) and gastric gavage (B, n = 6–8) of CeO2 NP. The right panels are vasodilation in response to increasing shear stress following intravenous injection (C, n = 6–10) and gastric gavage (D, n = 6–8) of CeO2 NP. *p ≤ 0.05 versus control.
Arteriolar Vasoconstriction
There was an augmented response to PE (10−6 and 10−5 M) following 100 µg of intravenously injected CeO2 NP; however, there were no differences in the overall slopes of the determinations for any dose (Fig. 5A). CeO2 NP (100 µg) given by gastric gavage resulted in an augmented response to PE (10−5 M), but there were no differences in the overall slopes of the determinations for any CeO2 NP dose (Fig. 5B). These data provide evidence that VSM adrenergic sensitivity may be augmented following intravenous CeO2 NP injections, but additional studies with other vasoactive agonists are necessary.
FIG. 5.
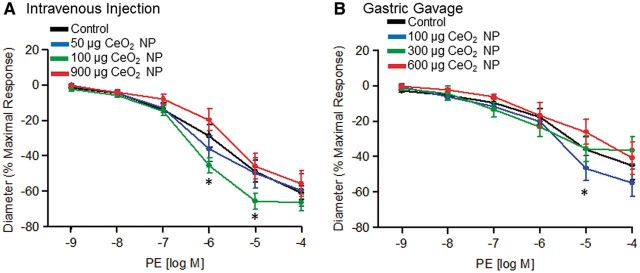
Vasoconstriction stimulated by PE following intravenous injection (A, n = 7–12) and gastric gavage (B, n = 9–11) of CeO2 NP was not significantly different. *p ≤ 0.05 versus control.
CeO2 NP EC50
The calculated EC50 for ACh and SPR was determined for each exposure route (Figs. 6A and 6B). The CeO2 NP EC50 ranged from 62 to 450 µg and was exposure route-dependent. Because we wanted to compare the influence of different exposure routes on microvascular function, the remainder of the experiments in this study used an average CeO2 NP dose derived from the EC50 calculation (Tables 1 and 2). The scatter plot represents the maximal response to ACh (10−4 M) for all exposure routes (Fig. 6C). The maximal impairment occurred at the highest doses. However, these doses were different between the exposure routes (Fig. 6C). This suggests that further increasing the dose from a given exposure route’s current highest dose would have further impaired microvascular function only minimally. The similar maximal responses for each exposure route at the highest dose and the variable EC50 highlight that the severity of the microvascular dysfunction following CeO2 NP administration is exposure route-dependent.
FIG. 6.

Calculation of the EC50 for ACh (A) and SPR (B) for intratracheal instillation, intravenous injection, and gastric gavage. The scatter plot (C) shows the dilation response to ACh (10−4 M) for all exposure routes. The following linear equations (y = mx + b) and r2 values were obtained for each exposure route: intratracheal instillation: y = −0.07 x + 41.26, r2 = 0.2513, intravenous injection: y = −0.03 x + 49.39, r2 = 0.1994, and gastric gavage: y = −0.05 x + 54.71, r2 = 0.2465.
Contribution of NO and COX Products to ACh-Induced Vasodilation
There were no significant differences in the responses of control arterioles among all the exposure routes (data not shown). This indicates that no experimental artifact resulted from the different exposure routes and, therefore, results from control animals were pooled for the analyses reported in Figures 7–10. Incubation of control arterioles with either L-NMMA or INDO significantly reduced vasodilation in response to ACh, and incubation with both inhibitors abolished arteriolar dilation (Fig. 7A). Intratracheal instillation of CeO2 NP significantly impaired endothelium-dependent arteriolar dilation; however, L-NMMA incubation restored vasodilation in response to ACh (10−5 and 10−4 M) (Fig. 7B). Intravenous CeO2 NP injection significantly impaired the ACh response and this was further impaired during INDO incubation (Fig. 7C). Finally, the significantly impaired dilation response to ACh that followed gastric gavage of CeO2 NP was attenuated further during L-NMMA incubation (Fig. 7D). Overall, these data provide initial evidence that the differential contribution of NO and COX products to vasodilation after CeO2 NP exposure is a function of the different routes through which these nanoparticles enter the body.
FIG. 7.

Vasodilation in response to ACh following incubation with either L-NMMA (10−4 M), INDO (10−5 M), or both inhibitors. There was a significant impairment in dilation of control arterioles following incubation with L-NMMA and INDO (A, n = 14–34). There was a partial restoration in function following incubation with L-NMMA after intratracheal instillation of 65 µg CeO2 NP (B, n = 5–14). Intravenous injection of 100 µg CeO2 NP caused an attenuated response to ACh after incubation with INDO that was significantly different from the CeO2 NP exposure alone (C, n = 5–9). Gastric gavage of 400 µg CeO2 NP caused a significant impairment in arteriolar dilation following L-NMMA incubation compared with the CeO2 NP exposure alone (D, n = 8–15). *p ≤ 0.05 versus L-NMMA (10−4 M), †p ≤ 0.05 versus INDO (10−5 M), ‡p ≤ 0.05 versus both inhibitors, ^p ≤ 0.05 versus CeO2 NP exposure. The brackets indicate differences in the overall slope of the determination.
FIG. 8.
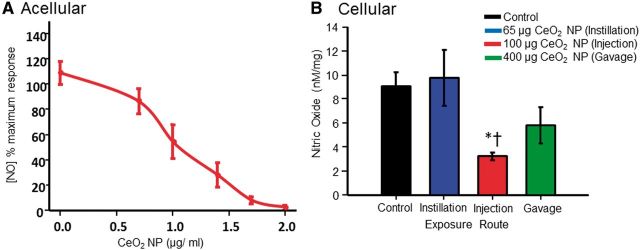
CeO2 NP reacted with NO in an acellular environment (A). There was a significant decrease in the amount of NO detected following intravenous injection (B, n = 14–21). NO was released with SNAP (1.6 × 10⁻⁴ M) for the acellular assessments and with A23187 (10−5 M) for the cellular assessments. *p ≤ 0.05 versus control, †p ≤ 0.05 versus intratracheal instillation.
FIG. 9.

CeO2 NP ability to scavenge and/or generate free radicals was assessed in an acellular environment (A, n = 3), with control AM (B, n = 4–7), and with AM from CeO2 exposed animals via different exposure routes (C, n = 7–9). Images of representative superoxide and hydroxyl free radical spectra are inset in panel A. *p ≤ 0.05 versus control, †p ≤ 0.05 versus Cr6+ alone, ‡p ≤ 0.05 versus control AM + CeO2 NP, ^p ≤ 0.05 versus gastric gavage AM + CeO2 NP. NoP, no detectable ESR peaks.
FIG. 10.
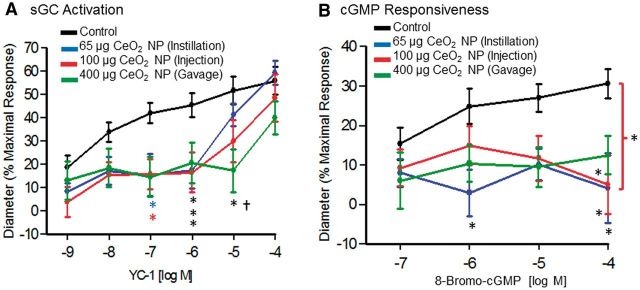
VSM function was impaired following CeO2 NP exposure and was not exposure route-dependent. Soluble GC activation was assessed with YC-1 (A, n = 8–11). Cyclic GMP responsiveness was assessed with 8-bromo-cGMP (B, n = 10). *p ≤ 0.05 versus control, †p ≤ 0.05 versus intratracheal instillation. The brackets indicate differences in the overall slope of the determination.
NO Measurements
The ability of CeO2 NP to react with NO was assessed first in an acellular environment. NO was spontaneously released using a bolus dose of SNAP (1.6 × 10⁻⁴ M) in the presence of increasing doses of CeO2 NP. As the CeO2 NP concentration increased, the amount of detectable NO decreased, indicating that CeO2 NP are capable of reacting with NO (Fig. 8A). In a second set of experiments, microvascular tissue was used to assess its ability to produce NO. In these experiments, vascular NO production was stimulated by a bolus dose of the Ca2+ ionophore, A23187 (10−5 M). This stimulation increased significantly the amount of NO detected. In the CeO2 NP intravenous injection group, this response was significantly impaired (relative to control and intratracheal instillation exposure groups) (Fig. 8B). These results suggest that intravenous injection of CeO2 NP may have a greater impact on NO bioavailability than either intratracheal instillation or gastric gavage.
Free Radical Assessments
ESR was used to determine whether CeO2 NP were capable of generating and/or scavenging free radicals. There was a significant reduction in the level of free radicals detected in the presence of CeO2 NP (Fig. 9A). This finding supports that CeO2 NP are capable of reacting with free radicals in an acellular environment, and this is consistent with anti-oxidant behavior. AM alone did not generate a significant amount of free radicals; however, when directly exposed to CeO2 NP (1 mg/ml), there was a significant increase in free radical generation (Fig. 9B). Furthermore, in a positive control experiment, AM generated a significant increase in free radical generation during incubation with Cr6+ (2 mM) (Fig. 9B). Interestingly, when CeO2 NP and Cr6+ were simultaneously incubated with the AM there was a significant decrease in the amount of free radicals detected compared with Cr6+ alone (Fig. 9B). It appears that CeO2 NP are capable of generating and scavenging free radicals in a cellular environment. Further experimentation with additional CeO2 NP doses would not have revealed more insight into their anti-oxidant potential because the current experiments determined that, although the doses used did affect the level of free radicals in vitro, the effect was not dose-dependent. AM were harvested from rats that had been exposed via intratracheal instillation, intravenous injection, or gastric gavage. The AM alone from these animals did not generate any detectable free radicals (Fig. 9C). In contrast, there was a significant increase in free radical generation compared with the controls in all exposure groups when CeO2 NP were incubated with the AM (Fig. 9C). However, the AM generated significantly fewer free radicals (following an additional CeO2 NP [1 mg/ml] dose) from the intratracheal instillation and intravenous injection exposure groups compared with the control and gastric gavage exposure groups (Fig. 9C). Although it is not surprising that the CeO2 NP are capable of stimulating AM free radical generation, it is interesting that in the correct environment, they may alternatively function as a reducing agent.
Smooth Muscle Signaling
There was a significant decrease in vasodilation at low YC-1 concentrations (10−7–10−5 M) in all exposure groups (Fig. 10A). The responsiveness to increasing concentrations of cGMP was also assessed. Similarly, there was a significant impairment in the response to increasing levels of 8-bromo-cGMP (10−4 M) in all three exposure groups (Fig. 10B). These results provide evidence that CeO2 NP exposure impairs VSM relaxation via a signaling mechanism downstream of initial sGC activation.
DISCUSSION
There are three major findings in this investigation. To our knowledge, this study is the first to establish the presence of both endothelium-dependent and -independent microvascular dysfunction following intravenous and gastric CeO2 NP exposure. This observed microvascular dysfunction was similar to the impairments following intratracheal instillation (Minarchick et al., 2013). However, the severity of this dysfunction was route-dependent (intratracheal instillation > intravenous injection > gastric gavage). The second major finding was that there were exposure route-dependent decreases in NO production and increases in ROS generation. Finally, independent of exposure route, CeO2 NP significantly impaired sGC activation and cGMP responsiveness.
CeO2 NP hold great potential for future therapeutics, and investigations of the biological effects associated with CeO2 NP need to encompass therapeutically relevant dose ranges (Celardo et al., 2011). Our initial toxicological assessments utilized a range that ensured overlap between exposure routes, while also being therapeutically relevant. In terms of therapeutic applications, intravenous and oral exposures are common in human pharmaceutical uses and often expose patients to several milligrams of drug per dose (Brannon-Peppas and Blanchette, 2004; Sastry et al., 2000). To our knowledge, CeO2 NP have yet to be used therapeutically via ingestion. The intravenous doses used in this experiment are similar to CeO2 NP concentrations that are being tested for protection against ischemic stroke in animals (Kim et al., 2012). Therefore, the doses used to establish the EC50 for intravenous and gastric exposures here are relevant as they are within therapeutic or pharmaceutical ranges.
It is reasonable to speculate that different blood nanoparticle concentrations could be achieved by administering CeO2 NP via different exposure routes and the levels of direct nanoparticle-endothelial interaction within 24 h would vary (Stapleton and Nurkiewicz, 2014). Intravenous exposure, undoubtedly, resulted in the highest level of direct nanoparticle-endothelial contact. We can assume that at time naught (initial injection) all the CeO2 NP are in the plasma (Stapleton and Nurkiewicz, 2014). Over time, these nanoparticles could be distributed to other organs and/or cleared from the body (Yokel et al., 2012). From a pulmonary standpoint, ferric oxide nanoparticles translocate from the lung to other systemic organs at a rate of 3.06 µg/day (Zhu et al., 2009). It is possible that a similar amount of CeO2 NP translocates from the lungs, but the exact rate is currently unknown. This migration of nanoparticles may result in direct endothelial interaction for some of the nanoparticles. It has been shown that within 24–48 h after inhalation or intravenous injection of CeO2 NP, the nanoparticles translocate to various organs, specifically the liver and spleen (Geraets et al., 2012; Yokel et al., 2012). Following inhalation, 0.10% of the inhaled dose was observed in the liver and 0.006% in the spleen (Geraets et al., 2012). Intravenous injection increased this translocation to as high as 10% of the dose in the same organs (Yokel et al., 2012). Furthermore, accumulation in various organs may also impact microvascular function following different exposure routes due to indirect effects from these organs.
Gastric exposure resulted in the delivery of a bolus dose of CeO2 NP directly into the stomach. Peristalsis then contributes to the distribution of the nanoparticles throughout the small and large intestines. Titanium dioxide nanoparticles have been shown to translocate from the gut and it is possible that CeO2 NP may respond in a similar fashion (Brun et al., 2014). Additionally, studies have shown that following gastric CeO2 NP exposure approximately 5% of the total dose is absorbed, which indicates the actual exposure dose for gastric gavage may be lower than the initial bolus dose (Hirst et al., 2013). This difference in the absorbed and initial concentrations may account for why there is minimal dysfunction at the lower CeO2 NP gastric gavage doses. It may also account for larger microvascular impairment following 600 µg of CeO2 NP because the nanoparticles may be absorbed in more areas (and to a greater extent) throughout the gastrointestinal tract. Furthermore, pH, vascularization, and water content vary throughout the digestive tract (eg, stomach, small, and large intestines) and may affect the reactivity, concentration, and translocation of the nanoparticles (Hayes et al., 2002; Xu and Qu, 2014). Our study did not assess CeO2 NP blood concentration or clearances following the 3 exposure routes. Therefore, the blood concentrations prior to microvascular assessments are unknown.
Finally, it should be noted that the likelihood of direct endothelial interaction does not implicitly predict the severity of microvascular dysfunction. Pulmonary exposure resulted in the greatest microvascular dysfunction despite likely having lower CeO2 NP endothelial contact. This indicates that other factors (e.g., inflammation, neurogenic stimuli, and free cerium ions) may play a role in the resultant microvascular dysfunction. The influences and identification of these factors warrant further investigation.
Endothelium-dependent dilation is the net product of many factors, and CeO2 NP exposure may alter the origin and/or targets of these factors. For example, after pulmonary CeO2 NP exposure, NOS inhibition restores microvascular function at the highest ACh concentrations (Fig. 7B). This could be partially due to the activation of endothelium-derived hyperpolarizing factor (EDHF), which NO has been shown to inhibit (Nishikawa et al., 2000). It is possible that when NO production is inhibited, EDHF may promote VSM relaxation through a pathway independent of sGC/cGMP signaling (Parkington et al., 2008). Additional experiments are needed to deduce the activation and roles of compensatory vasodilatation mechanisms following CeO2 NP exposure.
CeO2 NP are capable of being internalized by cardiac progenitor cells, potentially through clathrin- and/or caveolae-mediated endocytic pathways (Pagliari et al., 2012; Singh et al., 2010). If CeO2 NP are internalized by endothelial cells, the functions of enzymes (e.g., NOS), substrates (e.g., L-arginine), and organelles (e.g., mitochondria) are potentially compromised. Diesel exhaust exposure and decreased L-arginine availability lead to increased superoxide via NOS uncoupling (Boger and Bode-Boger, 2000; Cherng et al., 2011). Therefore, changes in NOS activity may also be mechanistically linked to microvascular impairment and decreased NO bioavailability following CeO2 NP exposure.
The observed changes in NO bioavailability may be linked to the valence state of the cerium. CeO2 NP exist in two valence states (Ce4+ and Ce3+) and readily switch between them based on local environmental factors (e.g., ROS and pH) (Hayes et al., 2002; Xu and Qu, 2014). The ratio of the valence states may be predicative of reactivity in a biological environment. The CeO2 NP used in this study were 81% Ce4+/19% Ce3+. This ratio would be consistent with decreased NO bioavailability following intravenous exposure as Ce4+ is more prone than Ce3+ to reacting with NO (Xu and Qu, 2014). Furthermore, CeO2 NP valence state alterations may also account for the lack of decreased NO bioavailability following pulmonary exposure. Previous studies with other nanoparticles have resulted in a decreased NO bioavailability due to increased ROS production following pulmonary exposure (Nurkiewicz et al., 2009). It is possible that the valence state of the CeO2 NP (either as a reductant or oxidant) protects/preserves NO bioavailability following pulmonary exposure due to its ability to react with ROS. Gastric exposure to CeO2 NP also results in contact with stomach acid (pH ∼2). This exposure to a highly acidic environment may increase the Ce3+ concentration, thereby decreasing its reactivity with NO (Hayes et al., 2002). However, it is unclear if the altered Ce3+ concentration is maintained once the CeO2 NP exit the acidic environment of the stomach and enter the basic environment of the intestine. This potential valence state shift may be a contributing factor to the absence of significant changes in NO bioavailability and a higher CeO2 NP EC50 following gastric exposures.
NO bioavailability is also influenced by changes in local ROS levels, which can impair microvascular function (LeBlanc et al., 2010). Many factors, including mitochondrial dysfunction, NOS uncoupling, and possibly CeO2 NP themselves, influence ROS generation (Cherng et al., 2011; Dabkowski et al., 2009). CeO2 NP exposure has been associated with decreased or unaffected ROS, thus characterizing the CeO2 NP as an anti-oxidant, whereas other studies have documented increased ROS generation following either co-incubation, pulmonary, or intravenous exposure (Gojova et al., 2009; Pagliari et al., 2012; Srinivas et al., 2011; Yokel et al., 2012). Our study contributes conflicting results when comparing the influence of CeO2 NP and ROS. Initial exposure to CeO2 NP did not affect ROS generation; however, a subsequent CeO2 NP treatment did cause an increase in ROS generation, indicating that the first exposure activated and/or primed AM following intratracheal instillation and intravenous injection. We speculate that the activated AM are already producing ROS (although undetectable with ESR) so that in the presence of an additional CeO2 NP exposure, the nanoparticles may begin to act as an anti-oxidant and react with surrounding ROS. The increased ROS production following this dose in the control and gastric gavage groups may be because the AM are seeing the nanoparticles for the first time (Fig. 9). In this environment, CeO2 NP act as a pro-oxidant to increase basal ROS production in order to shift valence states. It appears the initial environment and the basal ROS concentration may influence CeO2 NP pro- and anti-oxidant activity. We speculate that in a low ROS environment (e.g., unstimulated AM), CeO2 NP react with surrounding cells, which lead to increased ROS generation. This elevated level of ROS may be needed for CeO2 NP to shift between Ce4+ and Ce3+ valence states. However, in a high ROS environment, these nanoparticles may not generate additional ROS because the level is sufficient to shift valence states. The influence of CeO2 NP treatment on AM activation requires additional investigation, but is currently outside the scope of this manuscript. Finally, this study focused on harvested AM and ROS generation and/or scavenging, so the influence of ROS at the microvascular level following CeO2 NP exposure is still unknown.
The observed endothelium-independent impairment is, at least partially, due to VSM dysfunction, as sGC and downstream elements (e.g., cGMP) were observed to display attenuated responses to YC-1 and 8-bromo-cGMP. Changes in cGMP signaling may disrupt myoendothelial junction regulation, which can lead to an increase in intracellular Ca2+ in the VSM and impair relaxation (Dora et al., 1997). Cyclic GMP is critical for PKG activation by binding to specific sites on the enzyme (Taylor et al., 2004). If activation is insufficient and intracellular Ca2+ does not decrease, the VSM cannot relax properly. Furthermore, it is possible that PKG formation and/or functional levels decrease after CeO2 NP exposure. If PKG function is decreased, there may be a change in the enzyme’s kinetics and intracellular Ca2+ may not be adequately sequestered, thus impairing dilation (Perri et al., 2006). Finally, increased phosphodiesterase activity can impair VSM relaxation by prematurely or rapidly decreasing cGMP (Rybalkin et al., 2003). Investigations into the specific roles of cGMP, PKG, and phosphodiesterase are necessary to determine their impact on endothelium-independent microvascular impairment following CeO2 NP exposure.
In conclusion, we provide evidence that intravenous and gastric CeO2 NP exposures cause endothelium-dependent and -independent arteriolar dysfunction. Furthermore, these impairments may be mechanistically linked to decreased NO bioavailability and altered VSM signaling, specifically involving cGMP. These results increase our insight of the effects of exposure to CeO2 NP; however, the effects reported here must be, ultimately, directly tested in vivo. This understanding is critical for the continued and expanded development of therapeutic applications for CeO2 NP.
FUNDING
This research was supported by the National Institutes of Health (R01—ES015022 to T.R.N.; F32—ES023435 to P.A.S.); and the National Science Foundation Cooperative Agreement (1003907 to V.C.M. and T.R.N.; DGE—1144676 to V.C.M.).
ACKNOWLEDGMENTS
The authors would like to thank Carroll McBride for his expert technical assistance in this study. The authors disclose no conflicts of interest.
REFERENCES
- Boger R. H., Bode-Boger S. M. (2000). Asymmetric dimethylarginine, derangements of the endothelial nitric oxide synthase pathway, and cardiovascular diseases. Semin. Thromb. Hemost. 26, 539–545. [DOI] [PubMed] [Google Scholar]
- Borm P. J., Robbins D., Haubold S., Kuhlbusch T., Fissan H., Donaldson K., Schins R., Stone V., Kreyling W., Lademann J., et al. (2006). The potential risks of nanomaterials: a review carried out for ECETOC. Part Fibre Toxicol. 3, 11. [DOI] [PMC free article] [PubMed] [Google Scholar]
- Brannon-Peppas L., Blanchette J. O. (2004). Nanoparticle and targeted systems for cancer therapy. Adv. Drug Deliv. Rev. 56, 1649–1659. [DOI] [PubMed] [Google Scholar]
- Brun E., Barreau F., Veronesi G., Fayard B., Sorieul S., Chaneac C., Carapito C., Rabilloud T., Mabondzo A., Herlin-Boime N., et al. (2014). Titanium dioxide nanoparticle impact and translocation through ex vivo, in vivo and in vitro gut epithelia. Part Fibre Toxicol. 11, 13. [DOI] [PMC free article] [PubMed] [Google Scholar]
- Buettner G. R. (1987). Spin trapping: ESR parameters of spin adducts. Free Radic. Biol. Med. 3, 259–303. [DOI] [PubMed] [Google Scholar]
- Cassee F. R., van Balen E. C., Singh C., Green D., Muijser H., Weinstein J., Dreher K. (2011). Exposure, health and ecological effects review of engineered nanoscale cerium and cerium oxide associated with its use as a fuel additive. Crit. Rev. Toxicol. 41, 213–229. [DOI] [PubMed] [Google Scholar]
- Celardo I., Traversa E., Ghibelli L. (2011). Cerium oxide nanoparticles: a promise for applications in therapy. J. Exp. Ther. Oncol. 9, 47–51. [PubMed] [Google Scholar]
- Cherng T. W., Paffett M. L., Jackson-Weaver O., Campen M. J., Walker B. R., Kanagy N. L. (2011). Mechanisms of diesel-induced endothelial nitric oxide synthase dysfunction in coronary arterioles. Environ. Health Perspect. 119, 98–103. [DOI] [PMC free article] [PubMed] [Google Scholar]
- Dabkowski E. R., Williamson C. L., Bukowski V. C., Chapman R. S., Leonard S. S., Peer C. J., Callery P. S., Hollander J. M. (2009). Diabetic cardiomyopathy-associated dysfunction in spatially distinct mitochondrial subpopulations. Am. J. Physiol. Heart Circ. Physiol. 296, H359–H369. [DOI] [PMC free article] [PubMed] [Google Scholar]
- Department of Health and Human Services. (2009). Current Intelligence Bulletin 60: interim guidance for medical screening and hazard surveillance for workers potentially exposed to engineered nanoparticles. 2009-116. National Institute for Occupational Safety and Health; Centers for Disease Control and Prevention. [Google Scholar]
- Dora K. A., Doyle M. P., Duling B. R. (1997). Elevation of intracellular calcium in smooth muscle causes endothelial cell generation of NO in arterioles. Proc. Natl Acad. Sci. U. S. A. 94, 6529–6534. [DOI] [PMC free article] [PubMed] [Google Scholar]
- Geraets L., Oomen A. G., Schroeter J. D., Coleman V. A., Cassee F. R. (2012). Tissue distribution of inhaled micro- and nano-sized cerium oxide particles in rats: results from a 28-day exposure study. Toxicol. Sci. 127, 463–473. [DOI] [PubMed] [Google Scholar]
- Gewaltig M. T., Kojda G. (2002). Vasoprotection by nitric oxide: mechanisms and therapeutic potential. Cardiovasc. Res. 55, 250–260. [DOI] [PubMed] [Google Scholar]
- Gojova A., Lee J. T., Jung H. S., Guo B., Barakat A. I., Kennedy I. M. (2009). Effect of cerium oxide nanoparticles on inflammation in vascular endothelial cells. Inhal. Toxicol. 21(Suppl. 1), 123–130. [DOI] [PMC free article] [PubMed] [Google Scholar]
- Hayes S. A., Yu P., O'Keefe T. J., O'Keefe M. J., Stoffer J. O. (2002). The phase stability of cerium species in aqueous systems I. E-pH diagram for the Ce-HClO4-H2O system. J. Electrochem. Soc. 149, C623–C630. [Google Scholar]
- Heckert E. G., Karakoti A. S., Seal S., Self W. T. (2008). The role of cerium redox state in the SOD mimetic activity of nanoceria. Biomaterials 29, 2705–2709. [DOI] [PMC free article] [PubMed] [Google Scholar]
- Hirst S. M., Karakoti A., Singh S., Self W., Tyler R., Seal S., Reilly C. M. (2013). Bio-distribution and in vivo antioxidant effects of cerium oxide nanoparticles in mice. Environ. Toxicol. 28, 107–118. [DOI] [PubMed] [Google Scholar]
- Janzen E. G., Towner R. A., Haire D. L. (1987). Detection of free radicals generated from the in vitro metabolism of carbon tetrachloride using improved ESR spin trapping techniques. Free Radic. Res. Commun. 3, 357–364. [DOI] [PubMed] [Google Scholar]
- Kim C. K., Kim T., Choi I. Y., Soh M., Kim D., Kim Y. J., Jang H., Yang H. S., Kim J. Y., Park H. K., et al. (2012). Ceria nanoparticles that can protect against ischemic stroke. Angew. Chem Int. Ed. Engl. 51, 11039–11043. [DOI] [PubMed] [Google Scholar]
- LeBlanc A. J., Moseley A. M., Chen B. T., Frazer D., Castranova V., Nurkiewicz T. R. (2010). Nanoparticle inhalation impairs coronary microvascular reactivity via a local reactive oxygen species-dependent mechanism. Cardiovasc. Toxicol. 10, 27–36. [DOI] [PMC free article] [PubMed] [Google Scholar]
- Li H., Forstermann U. (2000). Nitric oxide in the pathogenesis of vascular disease. J. Pathol. 190, 244–254. [DOI] [PubMed] [Google Scholar]
- Ma J. Y., Zhao H., Mercer R. R., Barger M., Rao M., Meighan T., Schwegler-Berry D., Castranova V., Ma J. K. (2011). Cerium oxide nanoparticle-induced pulmonary inflammation and alveolar macrophage functional change in rats. Nanotoxicology 5, 312–325. [DOI] [PubMed] [Google Scholar]
- Minarchick V. C., Stapleton P. A., Porter D. W., Wolfarth M. G., Ciftyurek E., Barger M., Sabolsky E. M., Nurkiewicz T. R. (2013). Pulmonary cerium dioxide nanoparticle exposure differentially impairs coronary and mesenteric arteriolar reactivity. Cardiovasc. Toxicol. 13, 323–337. [DOI] [PMC free article] [PubMed] [Google Scholar]
- Nalabotu S. K., Kolli M. B., Triest W. E., Ma J. Y., Manne N. D., Katta A., Addagarla H. S., Rice K. M., Blough E. R. (2011). Intratracheal instillation of cerium oxide nanoparticles induces hepatic toxicity in male Sprague-Dawley rats. Int. J. Nanomed. 6, 2327–2335. [DOI] [PMC free article] [PubMed] [Google Scholar]
- Nishikawa Y., Stepp D. W., Chilian W. M. (2000). Nitric oxide exerts feedback inhibition on EDHF-induced coronary arteriolar dilation in vivo. Am. J. Physiol. Heart Circ. Physiol. 279, H459–H465. [DOI] [PubMed] [Google Scholar]
- Nurkiewicz T. R., Porter D. W., Hubbs A. F., Stone S., Chen B. T., Frazer D. G., Boegehold M. A., Castranova V. (2009). Pulmonary nanoparticle exposure disrupts systemic microvascular nitric oxide signaling. Toxicol. Sci. 110, 191–203. [DOI] [PMC free article] [PubMed] [Google Scholar]
- Pagliari F., Mandoli C., Forte G., Magnani E., Pagliari S., Nardone G., Licoccia S., Minieri M., Di N. P., Traversa E. (2012). Cerium oxide nanoparticles protect cardiac progenitor cells from oxidative stress. ACS Nano. 6, 3767–3775. [DOI] [PubMed] [Google Scholar]
- Parkington H. C., Tare M., Coleman H. A. (2008). The EDHF story: the plot thickens. Circ. Res. 102, 1148–1150. [DOI] [PubMed] [Google Scholar]
- Perri R. E., Langer D. A., Chatterjee S., Gibbons S. J., Gadgil J., Cao S., Farrugia G., Shah V. H. (2006). Defects in cGMP-PKG pathway contribute to impaired NO-dependent responses in hepatic stellate cells upon activation. Am. J. Physiol. Gastrointest. Liver Physiol. 290, G535–G542. [DOI] [PubMed] [Google Scholar]
- Porter D., Sriram K., Wolfarth M., Jefferson A., Schwegler-Berry D., Anderw M. E., Castranova V. (2008). A biocompatible medium for nanoparticle dispersion. Nanotoxicolgy 2, 144–145. [Google Scholar]
- Renkin E. M. (1984). Control of microcirculation and blood-tissue exchange. In Handbook of Physiology (E. M. Renkin and C. C. Michel, Eds), pp. 627–687. American Physiology Society, Bethesda, MD. [Google Scholar]
- Rybalkin S. D., Yan C., Bornfeldt K. E., Beavo J. A. (2003). Cyclic GMP phosphodiesterases and regulation of smooth muscle function. Circ. Res. 93, 280–291. [DOI] [PubMed] [Google Scholar]
- Sastry S. V., Nyshadham J. R., Fix J. A. (2000). Recent technological advances in oral drug delivery—a review. Pharm. Sci. Technol. Today 3, 138–145. [DOI] [PubMed] [Google Scholar]
- Schlossmann J., Feil R., Hofmann F. (2003). Signaling through NO and cGMP-dependent protein kinases. Ann. Med. 35, 21–27. [DOI] [PubMed] [Google Scholar]
- Singh S., Kumar A., Karakoti A., Seal S., Self W. T. (2010). Unveiling the mechanism of uptake and sub-cellular distribution of cerium oxide nanoparticles. Mol. Biosyst. 6, 1813–1820. [DOI] [PMC free article] [PubMed] [Google Scholar]
- Srinivas A., Rao P. J., Selvam G., Murthy P. B., Reddy P. N. (2011). Acute inhalation toxicity of cerium oxide nanoparticles in rats. Toxicol. Lett. 205, 105–115. [DOI] [PubMed] [Google Scholar]
- Stapleton P. A., Nurkiewicz T. R. (2014). Vascular distribution of nanomaterials. Wiley. Interdiscip. Rev. Nanomed. Nanobiotechnol. 6, 338–348. [DOI] [PMC free article] [PubMed] [Google Scholar]
- Sun D., Messina E. J., Kaley G., Koller A. (1992). Characteristics and origin of myogenic response in isolated mesenteric arterioles. Am. J. Physiol. 263(5 Pt 2), H1486–H1491. [DOI] [PubMed] [Google Scholar]
- Taylor M. S., Okwuchukwuasanya C., Nickl C. K., Tegge W., Brayden J. E., Dostmann W. R. (2004). Inhibition of cGMP-dependent protein kinase by the cell-permeable peptide DT-2 reveals a novel mechanism of vasoregulation. Mol. Pharmacol. 65, 1111–1119. [DOI] [PubMed] [Google Scholar]
- Wingard C. J., Walters D. M., Cathey B. L., Hilderbrand S. C., Katwa P., Lin S., Ke P. C., Podila R., Rao A., Lust R. M., et al. (2011). Mast cells contribute to altered vascular reactivity and ischemia-reperfusion injury following cerium oxide nanoparticle instillation. Nanotoxicology 5, 531–545. [DOI] [PMC free article] [PubMed] [Google Scholar]
- Xu C., Qu X. (2014). Cerium oxide nanoparticle: a remarkably versatile rare earth nanomaterial for biological applications. NPG Asia Mater. 6, 1–16. [Google Scholar]
- Yokel R. A., Au T. C., Macphail R., Hardas S. S., Butterfield D. A., Sultana R., Goodman M., Tseng M. T., Dan M., Haghnazar H., et al. (2012). Distribution, elimination, and biopersistence to 90 days of a systemically introduced 30 nm ceria-engineered nanomaterial in rats. Toxicol. Sci. 127, 256–268. [DOI] [PubMed] [Google Scholar]
- Zhang X. (2004). Real time and in vivo monitoring of nitric oxide by electrochemical sensors—from dream to reality. Front. Biosci. 9, 3434–3446. [DOI] [PubMed] [Google Scholar]
- Zhu M. T., Feng W. Y., Wang Y., Wang B., Wang M., Ouyang H., Zhao Y. L., Chai Z. F. (2009). Particokinetics and extrapulmonary translocation of intratracheally instilled ferric oxide nanoparticles in rats and the potential health risk assessment. Toxicol. Sci. 107, 342–351. [DOI] [PubMed] [Google Scholar]
- Zweifach B. W. (1984). Pressure-flow relations in blood and lymph microcirculation. In Handbook of Physiology (E. M. Renkin and C. C. Michel, Eds), pp. 251–308. American Physiological Society, Bethesda, MD. [Google Scholar]