

Abstract
B-cell acute lymphoblastic leukemia is the most common type of pediatric leukemia. Despite improved remission rates, current treatment regimens for pediatric B-cell acute lymphoblastic leukemia are often associated with adverse effects and central nervous system relapse, necessitating more effective and safer agents. Bafilomycin A1 is an inhibitor of vacuolar H+-ATPase that is frequently used at high concentration to block late-phase autophagy. Here, we show that bafilomycin A1 at a low concentration (1 nM) effectively and specifically inhibited and killed pediatric B-cell acute lymphoblastic leukemia cells. It targeted both early and late stages of the autophagy pathway by activating mammalian target of rapamycin signaling and by disassociating the Beclin 1-Vps34 complex, as well as by inhibiting the formation of autolysosomes, all of which attenuated functional autophagy. Bafilomycin A1 also targeted mitochondria and induced caspase-independent apoptosis by inducing the translocation of apoptosis-inducing factor from mitochondria to the nucleus. Moreover, bafilomycin A1 induced the binding of Beclin 1 to Bcl-2, which further inhibited autophagy and promoted apoptotic cell death. In primary cells from pediatric patients with B-cell acute lymphoblastic leukemia and a xenograft model, bafilomycin A1 specifically targeted leukemia cells while sparing normal cells. An in vivo mouse toxicity assay confirmed that bafilomycin A1 is safe. Our data thus suggest that bafilomycin A1 is a promising candidate drug for the treatment of pediatric B-cell acute lymphoblastic leukemia.
Introduction
Most cases of pediatric acute lymphoblastic leukemia (ALL) are of B-cell origin. One common B-cell acute lymphoblastic leukemia (B-ALL) subtype, first reported by Volgler et al. in 1978,1 has leukemia blasts with a specific chromosomal translocation, t(1;19)(q23;p13), resulting in the fusion of two transcription factors, E2A and PBX1.2,3 This translocation causes oncogenesis through altered regulation of gene expression. Patients with the oncogenic E2A-PBX1 translocation had a dismal prognosis two decades ago,4,5 but their prognosis has been greatly improved by the more aggressive multiagent therapies that are currently the standard of care. Treatment protocols including intensive chemotherapy regimens for various B-ALL have improved cure rates from 15% in 19906 to 80% in recent years.7,8 However, about 20% of children in remission suffer a relapse.8,9 Currently, major approaches include new formulations of existing chemotherapeutic agents, new antimetabolites and nucleoside analogs, monoclonal antibodies directed against leukemia-associated antigens, and molecularly targeted drugs, such as tyrosine kinase inhibitors (TKI) and FMS-related tyrosine kinase 3 inhibitors.10–13 Although the overall outcome of children with t(1;19)(q23;p13) is now comparable to that of children lacking the translocation, current treatment regimens for pediatric B-ALL are often associated with adverse effects and a higher risk of central nervous system relapse, necessitating more effective and safer agents.
Bafilomycin A1, a macrolide antibiotic isolated from the Streptomyces species, is an inhibitor of vacuolar H+ ATPase (V-ATPase). It binds to the V0 sector subunit c of the V-ATPase complex and inhibits H+ translocation, causing an accumulation of H+ in the cytoplasm of treated cells.14,15 Bafilomycin inhibits cell growth16 and induces apoptosis17,18 and differentiation.19 These anticancer effects of bafilomycin A1 are considered to be attributable to the intracellular acidosis caused by V-ATPase inhibition. Bafilomycin A1 was also found to inhibit the growth of cancer cells under hypoxic conditions by expressing hypoxia-inducible factor-1α.20 More frequently, bafilomycin A1 has been used in the study of autophagy as an inhibitor of fusion between autophagosomes and lysosomes and as an inhibitor of lysosomal degradation.21,22 The above anticancer effects and the late-phase autophagy inhibition require a high concentration (0.1–1 μM) of bafilomycin A1 and are often associated with adverse effects because acidosis and hypoxia also occur in normal cells in physiological conditions.
Apoptosis and autophagy are highly conserved and tightly regulated processes. Apart from their physiological role in the maintenance of cellular homeostasis, apoptosis and autophagy serve as important targets of tumor therapeutics.23–29 Whereas apoptosis is implicated in the removal of damaged or unwanted cells, autophagy is a cellular catabolic pathway that is involved in lysosomal degradation and recycling of proteins and organelles, and is therefore considered as an important survival mechanism for both normal cells and cancer cells in response to metabolic stress or chemotherapy. In hematologic malignancies, autophagy can either act as a chemoresistance mechanism or have tumor suppressive functions, depending on the context. In addition, autophagy is involved in other important aspects of blood cancers as it promotes immune competence and anticancer immunity, and may even help to enhance patients’ tolerance to standard treatments.30
Here, we present data demonstrating that a low concentration of bafilomycin A1 effectively inhibits and kills pediatric B-ALL cells. By using in vitro, ex vivo and in vivo models, we provide compelling evidence that bafilomycin A1 attenuates cytoprotective autophagy, induces apoptosis, and delays the onset of leukemia in a xenograft mouse model and inhibits and kills leukemic primary cells. An in vivo toxicity assay confirmed that bafilomycin A1 is safe. These data validate bafilomycin A1 as a novel, candidate therapeutic drug for pediatric B-ALL.
Methods
Major reagent and cell lines
Bafilomycin A1 from Sigma-Aldrich (St. Louis, MO, USA) was used at a concentration of 1 nM unless indicated with different doses. Leukemia cell lines RS4;11, NB4, HL-60, K562 and BV173 were purchased from the ATCC (Manassas, VA, USA). Leukemia cell lines 697 and Nalm-6 were from DSMZ, Braunschweig, Germany. The leukemia cells were grown in RPMI 1640 medium (Hyclone, USA) with 10% fetal bovine serum (Gibco, USA) at 37°C, in a 5% CO2 incubator. Experimental cultures were initiated by reculturing exponentially growing cells at a density of 0.2×10⁶ cells/mL and sampled at the indicated times for different analyses. The viability of the leukemia cells collected from the medium was determined by counting total and trypan blue cells under a microscope.
Patients’ samples
Primary samples from leukemia patients either cytogenetically identified as myeloid leukemia cells or sorted against CD19+ for BALL cells were obtained with informed consent according to institutional guidelines and were cultured in triplicate in flat-bottomed, 24-well plates at 37°C with 5% CO2 at a density of 0.2×10⁶ cells/mL, using Iscove’s modified Dulbecco’s medium supplemented with 20% BIT, 55 mM β-mercaptoethanol and 1% glutamine.
Animals and the B-cell acute lymphoblastic leukemia xenograft model
Male and female mice were used equally in all experiments and littermates were used as controls. The 697 B-ALL cells were injected at a dose of 5×10⁶ cells/animal into 6- to 8-week-old male NOD-SCID mice or C57BL/6J control mice. Cells were allowed to proliferate in vivo for 6 days and then the transplanted mice were injected intraperitoneally with phosphate-buffered saline or bafilomycin A1 (0.1 mg/kg or 1 mg/kg). Mice were killed on day 30 after starting the treatment. Peripheral blood, bone marrow, livers and spleens were analyzed for the presence of leukemic cells by flow cytometry. Engraftment was detected by flow cytometry using antibodies recognizing E2A/PBX1 (BD, USA). Liver and spleen cells were collected for analysis. All experiments with animals complied with institutional protocols on animal welfare and were approved by the Ethics Committee of Soochow University.
ImageStream analysis
B-ALL cells (5×10⁶) from different treatment groups were collected with an ImageStreamX Mark II (Amnis, Seattle, USA). Samples were visualized and analyzed for the expression of marker proteins with IDEAS 5.0 software (Amnis, Seattle, USA). Cells were gated with the area and aspect ratio features for single cells or with the Gradient RMS feature for focused cells. These subsets were plotted for log intensities of channel with LC3. The LC3 spot count was analyzed by spot count wizard. Autophagy levels were calculated by measuring cell percentage with LC3high spot cells.
The cell proliferation assay, small interfering RNA, fluorescence microscopy, analysis of mitochondrial membrane potential, analysis of intracellular free Ca2+ concentration, measurement of intracellular pH, and routine blood examinations are described in the Online Supplementary Information.
Statistical analysis
Results are shown as the mean ± standard deviation of at least three independent experiments. The Student t-test was used for comparisons between groups, with P values less than 0.05 being considered statistically significant.
Results
Bafilomycin A1 preferentially inhibits in vitro growth of pediatric B-cell acute lymphoblastic leukemia cells
Bafilomycin A1, at concentrations between 0.1 and 1 μM, is often used to inhibit autophagic flux.21,22,32 While studying autophagy in leukemia cells, we unexpectedly observed an unusual sensitivity of a certain type of leukemia cells to bafilomycin A1, which prompted us to investigate the effect of this antibiotic on various leukemia cell lines including 697, Nalm-6, RS4;11, NB4, HL-60, K562 and BV173 representing B-ALL (697, Nalm-6, RS4;11), acute myeloid leukemia (NB4, HL-60), and chronic myeloid leukemia (K562, BV173). The cells were cultured in the presence of increasing concentrations of bafilomycin A1 (0 nM, 0.5 nM, 1 nM). Cell proliferation was measured using an MTT assay. The results showed that various concentrations of bafilomycin A1 profoundly inhibited the growth of three pediatric B-ALL cell types in culture (Figure 1A). A flow cytometric assay also revealed that bafilomycin A1 effectively inhibited cell division of the three pediatric B-ALL cell lines (Figure 1B). In contrast, acute and chronic myeloid leukemia cell lines were virtually insensitive to the action of this growth inhibitory agent (Figure 1A,B, Online Supplementary Figure S1A,B).
Figure 1.

Bafilomycin-A1 at low concentration preferentially inhibits the growth of pediatric B-ALL cells. (A) Effect of bafilomycin A1 on the growth of various leukemia cell lines measured by MTT assay. Low-dose bafilomycin A1 preferentially inhibits B-ALL cells over 96 h of bafilomycin A1 treatment with the concentrations indicated. (B) Effect of bafilomycin A1 on proliferation measured by CFSE assay. Cell division of various leukemia cell lines was measured by labeling with CFSE. The cells were cultured for 72 h with or without bafilomycin A1. (C) Effect of bafilomycin A1 on the cell cycle of B-ALL cells. The B-ALL cells were treated with bafilomycin A1, and then the cell cycle was analyzed by flow cytometry after PI staining. Bafilomycin A1 increased the percentage of cells in the G0/G1 phase and decreased the percentage of cells in the S and G2/M phases of the cell cycle. The representative histogram data and the percentage of cells in each stage of the cell cycle after 72 h of treatment are shown. (D) Effect of bafilomycin A1 on cell cycle regulators evaluated by western blotting analysis. ***P<0.001,**P<0.01.
The 697, Nalm-6 and RS4;11 cell lines are derived from pediatric B-ALL patients with distinct oncogenic chromosome translocations. Although the remission rate of these types of B-ALL is high, central nervous system relapse is frequent. To understand the mechanisms by which a low concentration of bafilomycin A1 (1 nM) inhibits the growth of pediatric B-ALL cells, we performed flow cytometric analysis of propidium iodide (PI)-stained samples of the B-ALL cell lines cultured for 72 h in the presence of bafilomycin A1. Bafilomycin A1 increased the percentage of B-ALL 697 and Nalm-6 cells in the G0/G1 phase of the cell cycle, with a concomitant decrease in cells in S and G2/M phases (Figure 1C, Online Supplementary Figure S1C). To elucidate how bafilomycin A1 slows down cell cycle progression, we examined the levels of critical protein components of cell cycle regulation in B-ALL cells. The time course of bafilomycin A1 treatment revealed that p21, but not p27, was increased in the 697 cells and Nalm-6 cells (the effects became obvious at 24 and 48 h, respectively) (Figure 1D, Online Supplementary Figure S1D). Cyclin D3 in the 697 cells and cyclin D1, D3 in Nalm-6 cells were decreased after 72 h of bafilomycin A1 treatment (Figure 1D, Online Supplementary Figure S1D). Cyclin E2 was decreased in the late stage of bafilomycin A1 treatment in both the 697 cells and Nalm-6 cells, but the irregular change in cyclin E2 level in the early stage of culture and drug treatment of 697 cells remain open issues (Figure 1D, Online Supplementary Figure S1D). Bafilomycin A1 treatment also decreased both total Rb and phosphorylated Rb in the 697 cells and Nalm-6 cells (Figure 1D, Online Supplementary Figure S1D). Although there is a discrepancy between the dynamic changes of the cell cycle regulators in different B-ALL cell lines, the overall pattern appears to be similar, with low concentration bafilomycin A1 up-regulating the protein levels of certain cell cycle-dependent kinase (CDK) inhibitors, but down-regulating the protein levels of certain cyclin members.
Notably, the discrepancy between the percentage of G0/G1 cells and the CFSE flow cytometry data or cell cycle profile in response to bafilomycin A1 treatment suggests that, in addition to inhibiting proliferation, bafilomycin A1 also causes cell death. The growth arrest may also result from fewer cells in the S phase after bafilomycin A1 treatment. Nevertheless, the above data suggest that bafilomycin A1 may induce cell cycle arrest and inhibit proliferation of pediatric B-ALL cells, at least in part, by up-regulating negative regulators and down-regulating positive regulators of the cell cycle.
Bafilomycin A1 at low concentration effectively inhibits autophagy of pediatric B-cell acute lymphoblastic leukemia cells via multiple targets
To confirm that bafilomycin A1 targets acidic vesicle lysosomes in pediatric B-ALL cells, we analyzed the long-term effects of bafilomycin A1 on the pH of intracellular vesicles in B-ALL cell lines. LysoSensor staining showed that 1 nM bafilomycin A1 induced alkalinization of intracellular acidic compartments in 697 cells (Figure 2A), suggesting that the antibiotic induces early alterations in the lysosomal compartment consisting of lysosomal pH alkalinization and lysosomal membrane permeabilization. The above results suggest that 1 nM bafilomycin A1 is sufficient to compromise cytoprotective autophagy by targeting lysosomes, leading to elevated mortality of the B-ALL cells. Inhibiting autophagy may, therefore, be one of the mechanisms by which bafilomycin A1 at low concentration functions in B-ALL cells.
Figure 2.
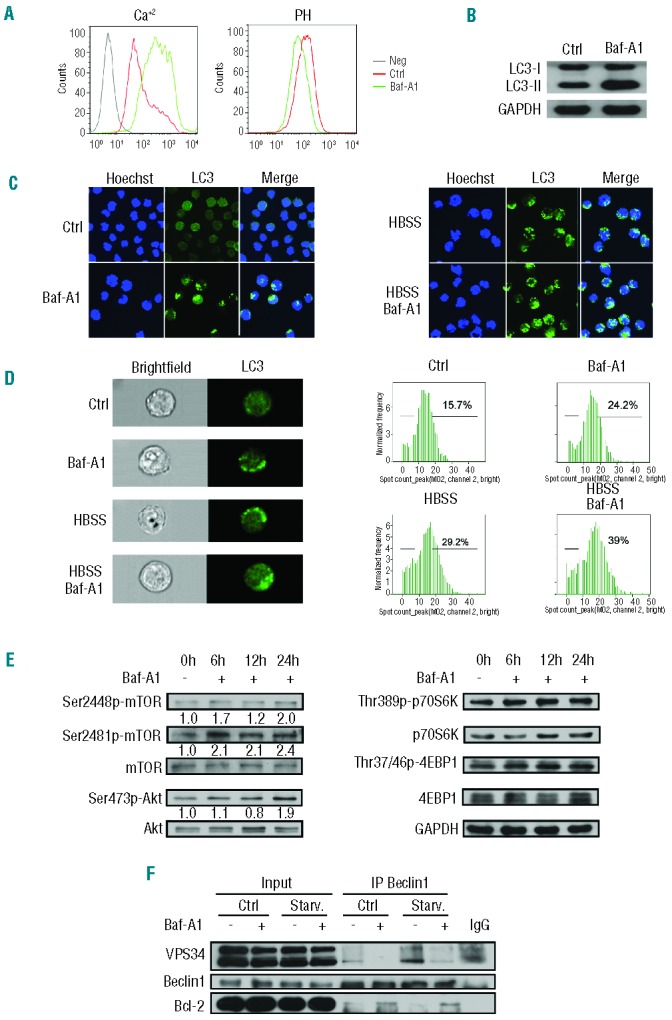
Bafilomycin A1 at low concentration inhibits the cytoprotective autophagy of pediatric B-ALL cells. (A) Bafilomycin A1 induced an increase of [Ca2+]i. The pre-BALL 697 cells were loaded with 5 mM Fluo-4 AM dye for a total of 30 min before analysis by flow cytometry (left). The variation of intra-vesicular pH and the status of lysosomal permeability were evaluated by flow cytometric analysis of bafilomycin A1-treated B-ALL cells stained with LysoSensor Green DND-189 and Lysotracker or acridine orange as described in the Methods (right). (B) Western blotting for the conversion of LC3-II from LC3-I for the 697 cells treated or not with 1 nM bafilomycin A1. (C) Confocal microscopic analysis of autophagy activity. A GFP-LC3 stable expressing transfectant 697 cell line was generated. The cells were treated or not with bafilomycin A1 for 72 h. The nucleus was stained with Hoechst 33258. (D) Images and flow cytometric analysis of autophagy activity. The GFP-LC3 697 cells were treated as in (C) and the green GFP-LC3 puncta was measured by Amnis ImageStreamX Mark II and the data were analyzed with Amnis IDEAS 4.0 software. Original magnification ×600 (left) and the quantitative data (right). (E) Western blotting analysis for mTOR and its upstream regulator Akt and downstream targets, p70S6K and 4EBP1. The B-ALL cells were treated or not with bafilomycin A1 for a specified period of time. The numbers below the blots indicate relative intensity of phosphorylation-specific bands for mTOR, AKT, p70S6K and 4E-BP1 relative to total mTOR, AKT, p70S6K or 4E-BP1. (F) Co-immunoprecipitation of Vps34 or Bcl-2 with Beclin1 as a bait after the B-ALL cells were treated or not with bafilomycin A1 under regular conditions or starvation (HBSS medium).
To test whether 1 nM bafilomycin A1 was able to block the fusion between autophagosomes and lysosomes, we treated 697 B-ALL cells with this concentration of the drug. An autophagic flux assay, which detects whether processed LC3-II accumulates in response to autophagy inhibition at the lysosomal degradation phase, is a reliable methodology for detecting a functional or complete autophagy process. Western blotting showed that conversion of LC3-II from LC3-I increased upon bafilomycin A1 treatment, suggesting that bafilomycin A1 blocks basal autophagic flux (Figure 2B). Confocal imaging further showed that, in both nutrient-rich medium (Ctrl) and nutrient-depleted medium (HBSS), 1 nM bafilomycin A1 caused enhanced puncta of GFP-LC3 (Figure 2C), reflecting accumulation of LC3 in acidic vesicular organelles due to a blockade of lysosomal degradation. The confocal data, however, did not tell us to what extent autophagic degradation of LC3-II is inhibited or whether autophagy is effectively inhibited at the stage of the fusion between autophagosomes and lysosomes or at the stage of lysosomal degradation.
Imaging flow cytometry is a useful tool that provides both fluorescence images indicating autophagic markers and numerical data, accurately revealing the degree of autophagic markers, thereby making it possible to analyze autophagy activation or inhibition statistically. To this end, we analyzed the formation of GFP-LC3 puncta, a marker reflecting inhibition of a late stage of autophagy, with the ImageStreamX Mark II imaging flow cytometer. The results demonstrated that while the image data were comparable to those obtained from the confocal analysis, the statistical data indicated that GFP-LC3 puncta were increased by only about 30% by bafilomycin A1 treatment in both nutrient-rich (regular medium) and nutrient-poor (HBSS medium) conditions (Figure 2D), suggesting that 1 nM bafilomycin A1 caused partial inhibition of autophagy at the late stage of autolysosome formation, and that there may be other mechanisms involved in inhibiting and/or killing leukemia cells.
Interestingly, examination of the mammalian target of rapamycin (mTOR) signaling cascade revealed that 1 nM bafilomycin A1 up-regulated mTOR signaling starting at about 6 h of treatment, as manifested by an increase in the phosphorylation levels of mTOR and its upstream regulator Akt and downstream effectors, p70S6K and 4EBP1 in B-ALL 697 cells (Figure 2E). These results suggest that bafilomycin A1 may largely inhibit autophagy by activating mTOR signaling in pediatric B-ALL cells.
Formation of the Beclin 1-Vps34 complex is a critical step in initiating autophagy, which is normally inhibited by mTOR, a gatekeeper in regulating autophagy.31 Consistent with the mTOR activation seen with a low concentration of bafilomycin A1 (Figure 2E), a co-immunoprecipitation assay showed that bafilomycin A1 treatment at low concentration inhibited the formation of the Beclin 1–Vps34 complex (Figure 2F). Activation of mTOR signaling may, therefore, be the main mechanism by which bafilomycin A1 inhibits autophagy. This result explains, at least in part, why low-dose bafilomycin A1 (1 nM) effectively inhibits BALL cells.
Bafilomycin A1 treatment also resulted in increased formation of the Beclin 1–Bcl-2 complex (Figure 2F). Bcl-2 is an apoptosis inhibitor and formation of a Beclin 1–Bcl-2 complex attenuates inhibition of apoptosis by Bcl-2.32 The association between disassembly of the Beclin 1–Vps34 complex and formation of the Beclin 1–Bcl-2 complex suggests that bafilomycin A1 treatment may simultaneously inhibit autophagy and activate apoptosis, possibly by removing Beclin 1 from the autophagy machinery and also by removing Bcl-2 from the anti-apoptosis regulatory machinery, both of which may deteriorate cytoprotective autophagy and activate the apoptotic cascade.
The activation of mTOR signaling and Beclin 1 association with Bcl-2 but disassociation with Vps34 following treatment with 1 nM bafilomycin A1 were also seen in the Nalm-6 cell line (Online Supplementary Figure S1E,F). Hence, unlike bafilomycin A1 at high concentrations (0.1–1 mM), which solely targets V-ATPase and the late phase of autophagy in other cell types,33 a low dose of bafilomycin A1 may inhibit the autophagy pathway at multiple targets in pediatric B-ALL cells. It activated mTOR signaling and effectively disrupted the formation of the Beclin 1–Vps34 complex, possibly inhibiting the induction of autophagy; it also partially inhibited late-phase autophagy and targeted the lysosomal membrane potential. Furthermore, it promoted the formation of the Beclin 1–Bcl-2 complex, which may further activate or promote apoptosis of pediatric B-ALL cells.
Bafilomycin A1 induces caspase-independent but apoptosis-inducing factor-dependent apoptosis of pediatric B-cell acute lymphoblastic leukemia cells
To examine whether bafilomycin A1-induced formation of Beclin 1–Bcl-2 is truly associated with activation of apoptosis in B-ALL cells, we treated B-ALL 697 cells for 72 h with bafilomycin A1 and then labeled the cells with PI and FITC-conjugated annexin V. The results of the annexin V assays showed that bafilomycin A1 induced apoptosis in the BALL cells (Figure 3A). A TUNEL assay also revealed that bafilomycin A1 induced apoptosis (Figure 3B). However, procaspase-3 and poly-(ADP-ribose) polymerase (PARP) were not cleaved in the cells treated with bafilomycin A1 over 72 h, whereas treatment with the positive control camptothecin (Cam) resulted in caspase cleavage (Figure 3C). Caspase inhibition through the pan-caspase inhibitor z-VAD-fmk was unable to rescue bafilomycin A1-induced apoptotic death of the leukemia cells (Figure 3D). These data suggest that bafilomycin A1 induced caspase-independent apoptosis.
Figure 3.


(A–H). Bafilomycin A1 induces caspase-independent but AIF-dependent apoptosis of pediatric B ALL cells. The 697 cells were cultured with or without bafilomycin A1 1 nM for 72 h. (A) Left, a representative flow cytometric plot for annexin V-FITC/PI-stained 697 cells. Right, percentage apoptosis of the 697 cells. Apoptosis was defined as the percentage of annexin V–positive cells. The results are the mean ± SD of three different experiments. Asterisks indicate significant differences (P<0.001) in comparison with control. (B) Left, a representative flow cytometric analysis of TUNEL. Right, bafilomycin A1-induced apoptosis of the 697 cells. (C) Western blotting analysis for caspase-3 and PARP cleavage in the 697 cells; camptothecin (CAM) is a positive control. (D) Effects of the pan-caspase inhibitor z-VAD on apoptosis of the 697 cells induced by bafilomycin A1. (E) A representative flow cytometric analysis of the mitochondrial membrane potential using JC-1 staining on 697 cells at 72 h after treatment with bafilomycin A1. (F) Western blotting analysis of total cellular AIF in the various leukemia cells indicated. (G) Western blotting analysis of the AIF in the cytoplasm and nucleus of 697 cells treated or not with bafilomycin A1. (H) Confocal microscopic observation of bafilomycin A1-induced AIF subcellular localization. The nucleus was stained with Hoechst 33258 (blue) and AIF by antibody (red). AIF was observed to relocate from cytoplasmic compartments to the nucleus upon bafilomycin A1 treatment. ***P<0.001, *P<0.05. (I–M). (I) Western blotting analysis of AIF localization in response to bafilomycin A1 and/or z-VAD treatment. (J) AIF silencing by siRNA in the 697 cells. Left, quantitative real time PCR of AIF mRNA expression (top) and western blotting analysis of AIF expression (bottom); right, apoptosis was analyzed after the 697 cells were transfected with AIF siRNA and cultured with or without bafilomycin A1 for 72 h. (K) Western blotting analysis of the total cytochrome c (Cyto C) in response to bafilomycin A1 over 72 h of treatment. (L) Confocal microscopic observation of cytochrome C subcellular localization. The mitochondria were stained by MitoTracker (green) and cytochrome c by antibody (red). Co-localization is shown in the merged images. (M) The bafilomycin A1-induced decrease of cytochrome c in the mitochondria was reversed by MG132 treatment. *P<0.05, **P<0.01.
We evaluated the effects of bafilomycin A1 treatment on mitochondrial membrane potential. The 697 B-ALL cells were treated for 72 h with bafilomycin A1 and changes in the mitochondrial membrane potential were analyzed by flow cytometric analysis. Depolarization of the mitochondrial membrane potential was detected (Figure 3E). We also found that apoptosis-inducing factor (AIF), which is a non-canonical, pro-apoptotic protein, is uniformly upregulated in leukemia cells and not in normal blood cells (Figure 3F), prompting us to investigate the role of AIF in pediatric B-ALL cells. Immunoblotting revealed that AIF relocalized from the cytoplasm to the nucleus after 72 h of bafilomycin A1 treatment (Figure 3G). This bafilomycin A1-induced nuclear relocalization of AIF was further seen with confocal microscopy (Figure 3H). In the cytoplasm, AIF is exclusively localized in the mitochondria. The caspase inhibitor z-VAD failed to block the bafilomycin A1-induced nuclear relocalization of AIF from mitochondria (Figure 3I). To examine whether AIF plays a role in the regulation of apoptosis in BALL cells treated with bafilomycin A1, we silenced the AIF gene in 697 cells by RNA interference and treated the cells with bafilomycin A1. Knockdown of AIF significantly attenuated bafilomycin A1-induced apoptosis (Figure 3J). These data indicate the involvement of AIF in the execution of the apoptotic process upon bafilomycin A1 treatment.
We also observed that bafilomycin A1 down-regulated cytochrome c (Figure 3K). The down-regulation of cytochrome c in response to bafilomycin A1 was confirmed by confocal microscopy (Figure 3L). The caspase inhibitor z-VAD did not reverse the bafilomycin A1-induced depletion of cytochrome c in mitochondria but this depletion of cytochrome c was reversed by the ubiquitination inhibitor MG132, suggesting that bafilomycin A1 induces degradation of cytochrome c in mitochondria and that this degradation is sensitive to ubiquitination inhibition (Figure 3M). Normally, release of cytochrome c from mitochondria to the cytoplasm is a critical signal for the activation of apoptosis,34 but we did not detect release of cytochrome c to the cytoplasm, even when proteasomal degradation was blocked with MG132 (Figure 3M). Similar results on activating non-classical apoptosis by 1 nM bafilomycin A1 were also found in Nalm-6 cells (Online Supplementary Figure S2A). The above data suggest that bafilomycin A1 targets the mitochondrial membrane to trigger apoptosis via the AIF pathway in a unique manner in pediatric B-ALL cells.
Bafilomycin A1 extends the survival and improves the pathology of xenograft mice by targeting leukemia cells
The in vivo effect of bafilomycin A1 on solid tumor growth has previously been evaluated in xenografted pancreatic tumors. Bafilomycin A1 (1 mg/kg) did not inhibit tumor growth until tumors reached 300 mm3.15 Another study suggested that bafilomycin A1 (1 mg/kg) can inhibit the growth of large tumors subjected to hypoxia more effectively than that of small tumors.20 Bafilomycin A1 is thus considered a useful therapeutic agent for large solid tumors.
Leukemia is not, however, a solid tumor, and circulating leukemia cells are not confronted with hypoxia. To study the effect of bafilomycin A1 in vivo, we examined the ability of the compound to suppress and kill B-ALL cells in the mouse model of pediatric B-ALL. We transplanted 697 BALL cells into NOD-SCID mice and allowed the leukemic cells to proliferate for 6 days while the animals manifested signs of advanced disease, including enlarged lymph nodes, hepatosplenomegaly, and elevated levels of white blood cells. Then, 0.1 mg/kg or 1 mg/kg bafilomycin A1 was administered daily for 3 days. Bafilomycin A1 extended survival in the bafilomycin A1-treated B-ALL mice with advanced disease compared with control mice, as shown by a Kaplan-Meier curve (Figure 4A). The average time from diagnosis to death was 30.9 days for the vehicle-treated disease control mice (range 20–39 days; n=20) versus 37.2 days for the mice treated with 0.1 mg/kg bafilomycin (range 30–46 days; n=15; P<0.001). More significantly, 1 mg/kg bafilomycin A1 increased survival with a median survival of 42.5 days (range 30–48 days; n=15; P<0.001). (Figure 4A). Animal weights, monitored once a week over 4 weeks, did not differ between the treated and control groups (Online Supplementary Figure S2B). Peripheral blood cells were counted at sacrifice on day 30 after transplantation. In the disease model group of animals, the numbers of white blood cells and lymphocytes increased remarkably, whereas the counts of these two types of cells in the bafilomycin A1-treated group were normalized within 30 days of initiating therapy (Figure 4B). However, by the time of death, the mean counts of white blood cells and lymphocytes of the bafilomycin A1-treated mice were above normal (the counts in the control group). The red blood cell counts, hemoglobin concentration, and particularly platelet counts in the B-ALL model group were significantly reduced, whereas they were normalized in the bafilomycin A1-treated group (Figure 4B). These data suggest that bafilomycin A1 was well tolerated in these mice. In brief, bafilomycin A1 treatment reduced tumor burden without causing significant anemia or thrombocytopenia.
Figure 4.

Bafilomycin A1 specifically inhibits pediatric B-ALL cell engraftment in NOD/SCID mice. NOD/SCID mice, injected with 5×10⁶ B-ALL 697 cells, were treated with vehicle or bafilomycin A1 (0.1 mg/kg or 1 mg/kg) starting on day 6 after the injection of the B-ALL cells. (n=15/group). C, untreated normal mouse control; M, mice engrafted with 697 cells, treated with vehicle; T1, treatment1, mice engrafted with 697 cells and treated with bafilomycin A1 (0.1 mg/kg); T2, treatment2, mice engrafted with 697 cells and treated with bafilomycin A1 (1 mg/kg). (A) Effect of bafilomycin A1 treatment on body weight. (B) Analysis at day 30 for the indicated blood cells, as measured by complete blood count. WBC: white blood cells; LYM: lymphocytes; LYM%: the percentage of lymphocytes; RBC: red blood cells; Hb: hemoglobin; PLT, platelets. (C) Above, representative photographs of livers and spleens recovered from mice engrafted with the 697 cells after the indicated days of treatment with bafilomycin A1 or vehicle; below, liver coefficient (the ratio of the weight of liver to total body weight) and spleen coefficient (the ratio of the weight of spleen to total body weight). (D) Representative hematoxylin and eosin–stained sections from liver of the mice engrafted with the 697 B-ALL cells 30 days after completion of treatment with bafilomycin A1 or vehicle. Regions of leukemic infiltration are indicated by arrows. (E) Flow cytometric detection of human ALL cells (CD19/GFP) in the bone marrow of mice engrafted with 697 B-ALL cells. Left, histogram of representative results; right, percentage of pediatric B-ALL cells in the bone marrow of mice disease model. (F) Flow cytometric detection of B-ALL cells (CD19-APC/GFP-FITC) in the peripheral blood of mice engrafted with 697 B-ALL cells. Left, histogram of representative results; right, percentage of pediatric B-ALL cells in the peripheral blood of mice. ***P<0.001,**P<0.01,*P<0.05.
The mice in the B-ALL model group had severe hepatosplenomegaly compared with the control group. However, the size and weight of livers and spleens in the bafilomycin A1-treated group were normalized compared with those in the disease model group (Figure 4C). The livers from the disease model group of mice were significantly infiltrated. In contrast, the livers of bafilomycin A1-treated mice were infiltrated by considerably fewer ALL cells (Figure 4D). The spleens from the mice of the model group were not infiltrated (Online Supplementary Figure S2C).
Using human E2A/PBX1 antibodies, flow cytometric analysis of bone marrow cells and peripheral blood cells from the four groups of mice, sacrificed on day 30, showed that bafilomycin A1 treatment significantly reduced the number of E2A/PBX1-positive leukemia cells in the bone marrow (Figure 4E) and eliminated virtually all circulating E2A/PBX1-positive leukemia cells compared with those in the disease model group and group of normal control mice (Figure 4F).
These data suggest that bafilomycin A1 dramatically inhibits pediatric B-ALL cell engraftment by targeting leukemia cells in vivo while sparing normal cells.
Bafilomycin A1 inhibits the primary cells from B-cell acute lymphoblastic leukemia patients
Because bafilomycin A1 exhibited a clear cytotoxic effect in vitro on pediatric B-ALL cells and the pediatric B-ALL xenograft mouse model, we next investigated whether such cytotoxicity could also be observed ex vivo in bone marrow-derived leukemic cells isolated directly from patients with different kinds of leukemia. Bone marrow cells were either cytogenetically identified for myeloid leukemia cells or stained and sorted with antibodies against CD19 for B-ALL cells. The resultant cells were set up in suspension culture to evaluate proliferative ability in the presence of bafilomycin A1 (1 nM or 10 nM). In line with the results from the in vitro system and animal model, in which profound inhibition of the growth of the B-ALL cells was shown (Figures 1 and 4), significant inhibition of the growth of B-ALL primary cells was found after 72 h of treatment with 1 nM bafilomycin A1. Specifically, this low concentration of bafilomycin A1 induced clear cytotoxicity in B-ALL primary cells (n=12) compared with that in untreated controls. Conversely, bafilomycin A1 did not have a toxic effect on bone marrow cells isolated from patients with acute myeloid leukemia (n=3), chronic myeloid leukemia (n=3), or chronic lymphocytic leukemia (n=3) or healthy subjects (n=3) (Figure 5A).
Figure 5.
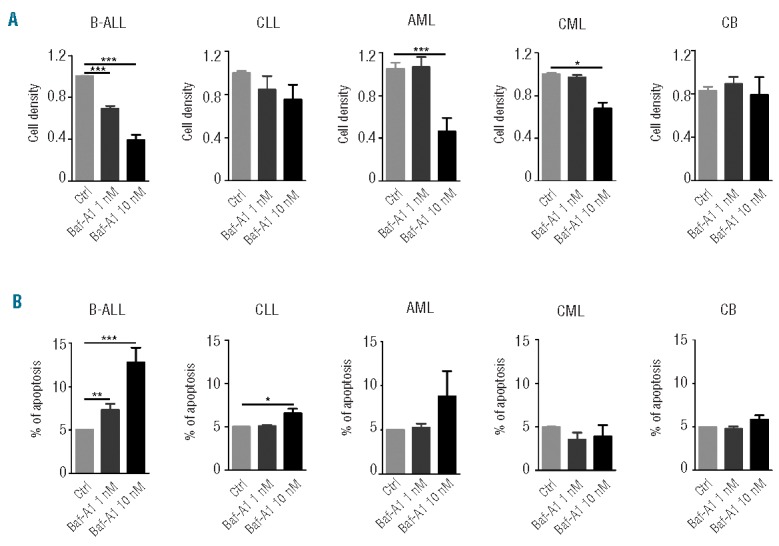
Bafilomycin A1 preferentially inhibits pediatric B-ALL primary cells. Bone marrow cells from pediatric leukemia patients were either cytogenetically identified for myeloid leukemia cells or sorted against CD19 for B-ALL cells. The resultant cells were treated with 1 nM bafilomycin A1 for 72 h, followed by cell counting. (A) Cell viability of patients’ bone marrow cells (sorted against CD19+ cells) treated with 1 nM bafilomycin A1 for 72 h. (B) Flow cytometric analysis of annexin V-FITC/PI stained patients’ bone marrow cells (sorted against CD19+ cells) treated with 1 nM bafilomycin A1. Apoptosis was defined as the percentage of annexin V–positive cells. The results are the mean ± SD of three independent experiments. Asterisks indicate significant differences (P<0.05) in comparison with control (Ctrl). CB: Cord Blood. ***P<0.001,**P<0.01,*P<0.05.
To determine if the drug really kills the human primary leukemic cells, we analyzed the primary cells from patients (sorted against CD19+) with annexin V-FITC/PI. The flow cytometric results showed that 1 nM bafilomycin A1 caused apoptotic death in the pediatric B-ALL primary cells at 72 h treatment, confirming that a low concentration of bafilomycin A1 truly kills pediatric B-ALL cells (Figure 5B).
In vivo toxicity evaluation reveals that bafilomycin A1 is a potent yet safe compound
Treatment-related toxicities could be a major issue in the treatment of patients with hematologic cancers as they significantly affect the patients’ quality of life. To determine the single-dose maximum tolerated dose, bafilomycin A1 was administered daily to C57BL/6J mice by intraperitoneal injection for 3 days at doses ranging from 0.1 to 25 mg/kg. The animals’ general appearance and body weight were monitored over the subsequent 3 weeks. At a dose of 25 mg/kg, the mice experienced weight loss of as much as 30% within 12 days of injection, but at a dose of 10 mg/kg, the mice did not lose weight during the same period of treatment (Figure 6A). Peripheral complete blood counts (Figure 6B) and the organ coefficients (Figure 6C) of mice treated with different doses of bafilomycin A1 were not significantly different. At a dose of 25 mg/kg, the liver was slightly enlarged, but at 10 mg/kg, the liver maintained a normal size (Figure 6C). Analysis of serum for aspartate aminotransferase/alanine aminotransferase (AST/ALT) (Figure 6D) and histological examination of the liver (Figure 6E) did not reveal signs of tissue damage or liver toxicity in the mice treated with 10 mg/kg bafilomycin A1. At a dose of 25 mg/kg, however, the AST/ALT was increased and the liver showed elevated transaminases, indicative of liver damage. Thus, doses of bafilomycin A1 up to 10 mg/kg were well tolerated with no detectable toxicity. However, a dose of 25 mg/kg was toxic. Accordingly, the maximum tolerated dose of bafilomycin A1 in mice was determined to be 10 mg/kg.
Figure 6.

In vivo toxicity of bafilomycin A1 in mice. C57BL/6J mice (n = 6 per group) were treated with bafilomycin A1, intraperitoneally at doses between 0.1 and 25 mg/kg. (A) Weight changes of the mice in response to the indicated doses of bafilomycin A1. (B) Effect of bafilomycin A1 on the peripheral blood count of mice. WBC: white blood cells; LYM: lymphocytes; LYM%: the percentage of lymphocytes; RBC: red blood cells; Hb: hemoglobin; PLT: platelets. (C) Effect of bafilomycin A1 on organ weight after treatment with different doses of bafilomycin A1. (D) The aspartate aminotransferase/alanine aminotransferase (AST/ALT) ratio after treatment with different doses of bafilomycin A1, an indication of the extent of liver injury. (E) Hematoxylin and eosin staining of liver injuries after treatment with different doses of bafilomycin A1. ***P<0.001,**P<0.01.
Discussion
Bafilomycin A1 is a specific inhibitor of the V-ATPase in cells and suppresses the acidosis of organelles containing this enzyme.14,15,33 At high doses (0.1–1 mμ) it has frequently been used as an inhibitor to block the fusion between autophagosomes and lysosomes, or to inhibit lysosomal activity, a step critical in late-stage autophagy.21,22 This study indicates that a low concentration of bafilomycin A1 (1 nM) effectively and specifically inactivates autophagy and activates apoptosis at multiple targets in pediatric B-ALL cells.
Manipulating autophagy pharmacologically has been reported to enhance the activity of anticancer agents. We previously found that autophagy is essential for vitamin D3-induced differentiation of myeloid leukemia cells.32 Other researchers showed that, in addition to apoptosis, arsenic trioxide induces autophagy in the human T-cell lymphocytic leukemia cell line Molt4.35,36 Indeed, the down-regulation of the PML/RARα oncoprotein is mainly affected by autophagy, and its degradation in cells treated with arsenic trioxide or all-trans retinoic acid depends upon and is related to increased autophagic activity. Autophagy also induces the differentiation of NB4 acute promyelocytic cells, suggesting that this degradation pathway potentiates therapy-induced differentiation of acute promyelocytic cells.37 RAD001-induced G0/G1 phase cell cycle arrest modulated the PI3K/Akt/mTOR pathway and caused apoptosis and autophagy in a dose-dependent manner. Moreover, dual treatment of RAD001 with an Akt inhibitor or mTOR inhibitor had a dramatic synergistic effect against leukemic cells.38 Unlike the mechanism we revealed in this study, the above antileukemic effects were largely attributable to the activation of autophagy, which either non-specifically overdigests intracellular components leading to cellular demise or specifically digests oncogenic fusion proteins to promote terminal differentiation of leukemia cells.
One of the current strategies in the treatment of leukemia is to identify new inhibitors of autophagy which could have better pharmacological properties, be tolerated better and have improved activity. Imatinib and its improved compounds, dasatinib or nilotinib, are tyrosine kinase inhibitors (TKI) that are currently used in the treatment of chronic myeloid leukemia.39 These compounds stimulate autophagy in chronic myeloid leukemia cells, and the activated autophagy causes increased chemoresistance, possibly through inhibition of the PI3K-AKT-mTORC1 axis.40 BCR-ABL signaling in leukemia cells leads to activation of the PI3K/AKT pathway and mTOR. In line with this, it has been demonstrated that BCR-ABL–expressing cells have low basal levels of autophagy but are highly dependent on this process.41 Inhibition of BCR-ABL by TKI has now been shown to not only induce apoptosis, but also autophagy.42 Inhibition of autophagy may, therefore, improve the antileukemic effect of TKI. Pharmacological inhibition of autophagy often occurs in the late stage of autophagy. For instance, clarithromycin, at a very high dose, increases TKI-induced cell death in chronic myeloid leukemia cells.43,44 Although the mechanism by which this drug inhibits autophagy remains unclear, autophagy inhibitors, combined with TKI, could be used to improve clinical outcomes in patients with chronic myeloid leukemia or myeloma.
Targeting apoptosis has been the overwhelming focus of methods aimed at killing leukemia cells. Mer tyrosine kinase is aberrantly expressed in 30% of pediatric B-ALL patients, including most patients with an E2A-PBX1 translocation. Mer inhibition induced apoptotic cell death and chemosensitization and prolonged survival in a xenograft model.45 SYK is a master regulator of anti-apoptotic signaling pathways in B-lineage leukemia cells. Inhibitors designed to target SYK may overcome the resistance of malignant B-lineage lymphoid cells to apoptosis and thereby provide the foundation for more effective multimodal treatment regimens for poor prognosis B-precursor ALL. C61, a liposomal nanoparticle formulation of a SYK substrate-binding site inhibitor, has been developed as a nanomedicine candidate against poor prognosis and relapsed B-cell ALL by inducing apoptosis in radiation-resistant primary leukemic cells.46,47
In the present study, a low concentration of bafilomycin A1 not only inhibited late-stage autophagy, specifically fusion between autophagosomes and lysosomes, but also inhibited autophagy at its early signaling by activating mTOR and attenuating the formation of the Beclin 1-Vps34 complex, a critical event needed for the induction of autophagy (Figure 2). Inhibition of autophagy can cause apoptosis.48 Thus, identifying the mechanisms regulating the cross-talk between apoptosis activation and autophagy inhibition is an essential step for the development of optimal chemotherapeutic approaches to leukemia treatment. In addition to inhibiting autophagy, we found that bafilomycin A1 activated caspase-independent but AIF-dependent apoptosis of B-ALL cells (Figure 3). Notably, bafilomycin A1 also promoted the formation of the Beclin 1–Bcl-2 complex (Figure 2), which in turn may compete for Beclin 1 away from the autophagy machinery and also remove Bcl-2 from the anti-apoptotic machinery, ultimately leading to inhibited autophagy and activated apoptosis. We previously reported that Beclin 1 is a bridge between autophagy and apoptosis.49 A link between proteins from the autophagy apparatus and apoptotic cascades has further been illustrated by Rubinstein et al., who identified Atg12 as a positive mediator of mitochondrial apoptosis by showing that this protein binds and inactivates the anti-apoptotic Bcl-2 family members, Bcl-2 and Mcl-1.50
In summary, bafilomycin A1 exhibits highly sensitive toxicity for pediatric B-ALL cells while sparing normal hematopoietic cells treated with the same doses. Unlike other drugs, bafilomycin A1 inhibits and kills pediatric B-ALL cells at multiple targets. It not only targets early autophagy signaling, but also targets H+-ATPase of lysosomes and blocks late-phase autophagy activity. Furthermore, it targets mitochondria to activate the AIF-dependent apoptotic cell death pathway and promotes Beclin 1 binding to Bcl-2, further decreasing cytoprotective autophagy and activating apoptotic cell death. Our data thus suggest that bafilomycin A1 may be developed to treat pediatric B-ALL. Identification of its direct binding target(s) in the unique autophagy and apoptosis pathways in pediatric B-ALL cells will be a major focus of our future study of bafilomycin A1.
Acknowledgments
This work was supported by grants from the National Natural Science Foundation of China (N.31071258, N. 81272336 and N. 31201073), the Ministry of Science and Technology of China (N. 2011CB512101), the Department of Science and Technology of Jiangsu Province of China (N. BK20130333), the Graduate Innovation Project of Jiangsu Province (CXZZ13-0829), and a project funded by the Priority Academic Program Development of Jiangsu Higher Education Institutions.
Footnotes
The online version of this article has a Supplementary Appendix.
Authorship and Disclosures
Information on authorship, contributions, and financial & other disclosures was provided by the authors and is available with the online version of this article at www.haematologica.org.
References
- 1.Vogler LB, Crist WM, Bockman DE, Pearl ER, Lawton AR, Cooper MD. Pre-B cell leukemia. A new phenotype of childhood lymphoblastic leukemia. N Engl J Med. 1978;298(16):872–878. [DOI] [PubMed] [Google Scholar]
- 2.Carroll AJ, Crist WM, Parmley RT, Roper M, Cooper MD, Finely WH. Pre-B cell leukemia associated with chromosome translocation 1;19. Blood. 1984;63(3):721–724. [PubMed] [Google Scholar]
- 3.Hunger SP, Galili N, Carroll AJ, Crist WM, Link MP, Cleary ML. The t(1;19)(q23;p13) results in consistent fusion of E2A and PBX1 coding sequences in acute lymphoblastic leukemias. Blood. 1991;77(4): 687–693. [PubMed] [Google Scholar]
- 4.Crist WM, Carroll AJ, Shuster JJ, et al. Poor prognosis of children with pre-B acute lymphoblastic leukemia is associated with the t(1;19)(q23;p13): a Pediatric Oncology Group study. Blood. 1990;76(1):117–122. [PubMed] [Google Scholar]
- 5.Kamps MP, Look AT, Baltomore D. The human t(1;19) translocation in pre-B ALL produces multiple nuclear E2A-Pbx1 fusion proteins with differing transforming potentials. Gene Dev. 1991;5(3):358–368. [DOI] [PubMed] [Google Scholar]
- 6.Raimondi SC, Behm FG, Roberson PK, et al. Cytogenetics of pre-B-cell acute lymphoblastic leukemia with emphasis on prognostic implications of the t(1;19). J Clin Oncol. 1990;8(8):1380–1388. [DOI] [PubMed] [Google Scholar]
- 7.Pui CH, Campana D, Pei D, et al. Treating childhood acute lymphoblastic leukemia without cranial irradiation. N Engl J Med. 2009;360(26):2730–2741. [DOI] [PMC free article] [PubMed] [Google Scholar]
- 8.Pui CH. Recent research advances in childhood acute lymphoblastic leukemia. J Formos Med Assoc. 2010;109(11):777–787. [DOI] [PubMed] [Google Scholar]
- 9.Nguyen K, Devidas M, Cheng SC, et al. Factors influencing survival after relapse from acute lymphoblastic leukemia: a Children’s Oncology Group study. Leukemia 2008;22(12):2142–2150. [DOI] [PMC free article] [PubMed] [Google Scholar]
- 10.Pui CH, Jeha S. New therapeutic strategies for the treatment of acute lymphoblastic leukaemia. Nat Rev Drug Discov. 2007; 6(2):149–165. [DOI] [PubMed] [Google Scholar]
- 11.Jeha S. New therapeutic strategies in acute lymphoblastic leukemia. Semin Hematol. 2009;46(1):76–88. [DOI] [PubMed] [Google Scholar]
- 12.Locatelli F, Schrappe M, Bernardo ME, Rutella S. How I treat relapsed childhood acute lymphoblastic leukemia. Blood. 2012; 120(14):2807–2816. [DOI] [PubMed] [Google Scholar]
- 13.Gill S, Porter DL. CAR-modified anti-CD19 T cells for the treatment of B-cell malignancies: rules of the road. Opin Biol Ther. 2014; 14(1):37–49. [DOI] [PubMed] [Google Scholar]
- 14.Bowman EJ, Graham LA, Stevens TH, Bowman BJ. The bafilomycin/concanamycin binding site in subunit c of the V-ATPases from Neurospora crassa and Saccharomyces cerevisiae. J Biol Chem. 2004;279(32):33131–33138. [DOI] [PubMed] [Google Scholar]
- 15.Ohta T, Arakawa H, Futagami F, et al. Bafilomycin A1 induces apoptosis in the human pancreatic cancer cell line Capan-1. J Pathol. 1998;185(3):324–330. [DOI] [PubMed] [Google Scholar]
- 16.Park JW, Kim MS, Ohkuma S, et al. Inhibition of cell growth by bafilomycin A1, a selective inhibitor of vacuolar H+-ATPase. In Vitro Cell Dev Biol Anim 1993;29A(11): 862–866. [DOI] [PubMed] [Google Scholar]
- 17.Kinoshita K, Waritani T, Noto M, et al. Bafilomycin A1 induces apoptosis in PC12 cells independently of intracellular pH. FEBS Lett 1996;398(1):61–66. [DOI] [PubMed] [Google Scholar]
- 18.Nakashima S, Hiraku Y, Tada-Oikawa S, et al. Vacuolar H+-ATPase inhibitor induces apoptosis via lysosomal dysfunction in the human gastric cancer cell line MKN-1. J Biochem (Tokyo) 2003;134(3):359–364. [DOI] [PubMed] [Google Scholar]
- 19.Kinoshita K, Hidaka H, Ohkuma S. Induction of phagocytic activity of M1 cells by an inhibitor of vacuolar FT-ATPase, bafilomycin A. FEBS Lett. 1994;337(3):221–225. [DOI] [PubMed] [Google Scholar]
- 20.Park SK, Johnson RS, Chun YS. Bafilomycin induces the p21-Mediated growth Inhibition of cancer cells under hypoxic conditions by expressing hypoxia-inducible factor-1. Mol Pharmcol. 2006;70(6):1856–1865. [DOI] [PubMed] [Google Scholar]
- 21.Yamamoto A, Tagawa Y, Yoshimori T, Moriyama Y, Masaki R, Tashiro Y. Bafilomycin A1 prevents maturation of autophagic vacuoles by inhibiting fusion between autophagosomes and lysosomes in rat hepatoma cell line, H-4-II-E cells. Cell Struct Funct. 1998;23(1):33–42. [DOI] [PubMed] [Google Scholar]
- 22.Klionsky DJ, Abdalla FC, Abeliovich H, et al. Guideline for the use and interpretation of assays for monitoring autophagy. Autophagy. 2012;8(4):445–544. [DOI] [PMC free article] [PubMed] [Google Scholar]
- 23.El-Khattouti A, Selimovic D, Haikel Y, Hassan M. Crosstalk between apoptosis and autophagy: molecular mechanisms and therapeutic strategies in cancer. J Cell Death 2013;6:37–55. [DOI] [PMC free article] [PubMed] [Google Scholar]
- 24.Selimovic D, Porzig BB, El-Khattouti A, et al. Bortezomib/proteasome inhibitor triggers both apoptosis and autophagy-dependent pathways in melanoma cells. Cell Signal. 2013;25(1):308–318. [DOI] [PubMed] [Google Scholar]
- 25.Cetindere T, Nambiar S, Santourlidis S, Essmann F, Hassan M. Induction of indoleamine 2,3-dioxygenase by death receptor activation contributes to apoptosis of melanoma cells via mitochondrial damage-dependent ROS accumulation. Cell Signal. 2010;22(2):197–211. [DOI] [PubMed] [Google Scholar]
- 26.Hassan M, Alaoui A, Feyen O, et al. The BH3-only member Noxa causes apoptosis in melanoma cells by multiple pathways. Oncogene. 2008;27(33):4557–4568. [DOI] [PubMed] [Google Scholar]
- 27.Meng S, Xu J, Wu Y, Ding C. Targeting autophagy to enhance oncolytic virus-based cancer therapy. Expert Opin Biol Ther. 2013; 13(6):863–873. [DOI] [PubMed] [Google Scholar]
- 28.Bristol ML, Emery SM, Maycotte P, Thorburn A, Chakradeo S, Gewirtz DA. Autophagy inhibition for chemosensitization and radiosensitization in cancer: do the preclinical data support this therapeutic strategy? J Pharmacol Exp Ther. 2013; 344(3):544–552. [DOI] [PMC free article] [PubMed] [Google Scholar]
- 29.Kimura T, Takabatake Y, Takahashi A, Isaka Y. Chloroquine in cancer therapy: a double-edged sword of autophagy. Cancer Res. 2013;73(1):3–7. [DOI] [PubMed] [Google Scholar]
- 30.Nencioni A, Cea M, Montecucco F, et al. Autophagy in blood cancers: biological role and therapeutic implications. Haematologica. 2013;98(9):1335–1343. [DOI] [PMC free article] [PubMed] [Google Scholar]
- 31.Levine B, Klionsky DJ. Development by self-digestion: molecular mechanisms and biological functions of autophagy. Dev Cell. 2004;6(4):463–477. [DOI] [PubMed] [Google Scholar]
- 32.Wang J, Lian H, Zhao Y, Kauss MA, Spindel S. Vitamin D3 induces autophagy of human myeloid leukemia cells. J Biol Chem. 2008, 283(37):25596–25605. [DOI] [PubMed] [Google Scholar]
- 33.Klionsky DJ, Elazar Z, Seglen PO, Rubinsztein DC. Does bafilomycin A1 block the fusion of autophagosomes with lysosomes? Autophagy. 2008:4(7):849–850. [DOI] [PubMed] [Google Scholar]
- 34.Jiang X, Wang X. Cytochrome C-mediated apoptosis. Annu Rev Biochem. 2004;73:87–106. [DOI] [PubMed] [Google Scholar]
- 35.Qian W, Liu J, Jin J, Ni W, Xu W. Arsenic trioxide induces not only apoptosis but also autophagic cell death in leukemia cell lines via up regulation of Beclin1. Leuk Res. 2007; 31(3):329–339. [DOI] [PubMed] [Google Scholar]
- 36.Song J, Qu Z, Guo X, et al. Hypoxia in duced autophagycontributes to the chemoresistance of hepatocellular carcinoma cells. Autophagy. 2009:5(8):1131–1144. [DOI] [PubMed] [Google Scholar]
- 37.Isakson P, Bjoras M, Boe SO, Simonsen A. Autophagy contributes to therapy in duced degradation of the PML/RARA oncoprotein. Blood. 2010;116(13):2324–2331. [DOI] [PubMed] [Google Scholar]
- 38.Neri LM, Cani A, Martelli AM, et al. Targeting the PI3K/AKT/mTOR signaling pathway in B precursor acute lymphoblastic leukemia and its therapeutic potential. Leukemia. 2013;28(4):739–748. [DOI] [PubMed] [Google Scholar]
- 39.Helgason GV, Karvela M, Holyoake TL. Kill one bird with two stones: potential efficacy of BCR-ABL and autophagy inhibition in CML. Blood. 2011;118(8):2035–2043. [DOI] [PubMed] [Google Scholar]
- 40.Ertmer A, Huber V, Gilch S, et al. The anticancer drug imatinib induces cellular autophagy. Leukemia. 2007;21(5):936–942. [DOI] [PubMed] [Google Scholar]
- 41.Altman BJ, Jacobs SR, Mason EF, et al. Autophagy is essential to suppress cell stress and to allow BCR-Abl–mediated leukemogenesis. Oncogene. 2011;30(16):1855–1867. [DOI] [PMC free article] [PubMed] [Google Scholar]
- 42.Bellodi C, Lidonnici MR, Hamilton A, et al. Targeting autophagy potentiates tyrosine kinase inhibitor-induced cell death in Philadelphia chromosome-positive cells, including primary CML stem cells. J Clin Invest. 2009;119(5):1109–1113. [DOI] [PMC free article] [PubMed] [Google Scholar]
- 43.Calabretta B, Salomoni P. Inhibition of autophagy with clarithromycin: a new strategy to enhance sensitivity of CML stem cells to tyrosine kinase inhibitors. Leuk Lymphoma. 2011;52(Suppl 1):54–9. [DOI] [PMC free article] [PubMed] [Google Scholar]
- 44.Schafranek L, Leclercq TM, White DL, Hughes TP. Clarithromycin enhances dasatinib- induced cell death in chronic myeloid leukemia cells, by inhibition of late stage autophagy. Leuk Lymphoma. 2013;54(1): 198–201. [DOI] [PubMed] [Google Scholar]
- 45.Linger RMA, Lee-Sherick AB, DeRyckere D, et al. Mer receptor tyrosine kinase is a therapeutic target in pre–B-cell acute lymphoblastic leukemia. Blood. 2013;122(9): 1599–1609. [DOI] [PMC free article] [PubMed] [Google Scholar]
- 46.Uckun FM, Qazi S, Cely I, et al. Nanoscale liposomal formulation of a SYK P-site inhibitor against B-precursor leukemia. Blood. 2013;121(21):4348–4354. [DOI] [PMC free article] [PubMed] [Google Scholar]
- 47.Uckun FM, Qazi S. SYK as a new therapeutic target in B-cell precursor acute lymphoblastic leukemia. J Cancer Therapy. 2014;5(1):124–131. [DOI] [PMC free article] [PubMed] [Google Scholar]
- 48.Mirzoeva OK, Hann B, Hom YK, et al. Autophagy suppression promotes apoptotic cell death in response to inhibition of the PI3K-mTOR pathway in pancreatic adenocarcinoma. J Mol Med. 2011;89(9):877–889. [DOI] [PubMed] [Google Scholar]
- 49.Wang J. Beclin1 bridges autophagy, apoptosis and differentiation. Autophagy. 2008; 4(7):947–948. [DOI] [PubMed] [Google Scholar]
- 50.Rubinstein AD, Eisenstein M, Ber Y, Bialik S, Kimchi A. The autophagy protein Atg12 associates with antiapoptotic Bcl-2 family members to promote mitochondrial apoptosis. Mol Cell. 2011;44(5):698–709. [DOI] [PubMed] [Google Scholar]