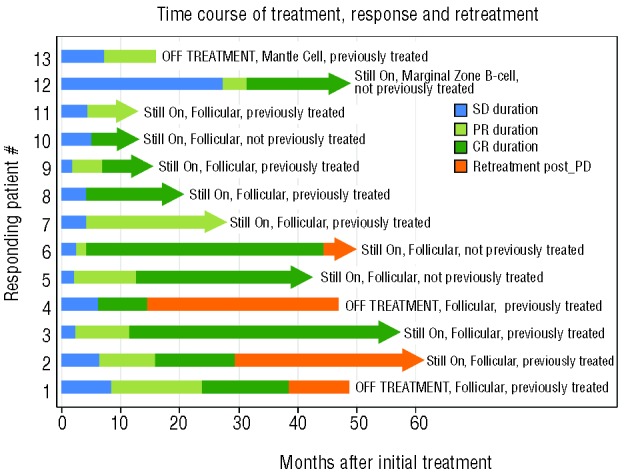
Figure 2.

Treatment time course in responding patients. Timing of treatment is shown for the 13 responding patients with duration of first response: stable disease (SD) (blue); duration of partial response (PR) (light green); duration of complete response (CR) (dark green). Duration of re-treatment after progressive disease (PD) (is shown in orange). Patients’ previous treatment status is indicated on the right and an arrow indicates that the patient was on treatment at the time of data analysis.
