The majority of end-stage renal patients undergoing maintenance hemodialysis (HD) develop anemia that adversely affects their quality of life and increases the risk for cardiovascular events and death. Thus, the development of safe and effective strategies aimed at correcting anemia in these patients is of utmost importance.1 Unfortunately, the response to erythropoietin (EPO) treatment is often suboptimal, due mainly to an imbalance between the surging iron requirements of the stimulated erythropoietic cells on the one hand and iron availability on the other. Thus, intravenous (i.v.) administration of iron-containing preparations is widely used in order to circumvent this imbalance. However, questions about the efficacy and the safety of this loading strategy still remain unanswered.1
Serum protein transferrin represents the physiological iron supplier to body cells requiring iron, mainly the erythroblasts in bone marrow. Transferrin iron is derived mainly from macrophages of the reticuloendothelial system (RES), following degradation of senescent erythrocytes and subsequent efflux of the liberated iron to the circulation.2 This process, as well as the liberation of iron from duodenal enterocytes and from hepatocytes, is mediated by ferroportin, the only known iron exporter.3 On the other hand, the expression of ferroportin is negatively regulated by hepcidin, a liver-produced peptide hormone that binds to ferroportin and induces its internalization and degradation, thus blocking iron export and its utilization for erythropoiesis.3 Hepcidin expression is regulated by a number of different signals, including iron levels, inflammation, rate of erythropoiesis and hypoxia.4 The exact molecular mechanism(s) of iron-mediated regulation of hepcidin expression is not completely understood. There is substantial evidence to indicate that elevated concentrations of the differic transferrin form (Tf-Fe2) in serum can induce hepcidin expression. This event is likely to be mediated through Tf-Fe2 binding to transferrin receptor 2 (TfR2) on the surface of hepatocytes.5
A sensitive marker for evaluating iron availability for erythropoiesis is the saturation of serum transferrin (Tf-Sat). The traditional laboratory techniques for estimating Tf-Sat are based on measuring serum iron levels and assume that all serum iron is bound to transferrin. Therefore, these methods are not valid for a period following i.v. administration of iron-containing preparations because they lead to gross overestimation of Tf-Sat as long as these preparations are present in plasma. Reports on apparent oversaturation of transferrin after i.v. iron therapy may represent analytical errors associated with the presence of non-transferrin bound iron (NTBI) in these iron preparations.6,7
The aim of this study was: i) to evaluate the use of ureapolyacrylamide gel electrophoresis (U-PAGE) in order to detect changes in different Tf forms (and thereby Tf-Sat) following i.v. administration of iron-containing preparations in HD patients; and ii) to examine the possibility of using this methodology in order to investigate the changes in serum Tf-Fe2 levels and their correlation with hepcidin expression in these patients. The knowledge derived by using U-PAGE is extremely valuable, because it allows the direct estimation of Tf-Fe2, the only Tf-form that efficiently binds transferrin receptor-1 (TfR1) for iron supply to cells or transferrin receptor-2 (TfR2) to trigger iron signaling to hepcidin. Such information may be important in determining safe and effective strategies for i.v. iron administration in HD patients.
Hemodialysis patients received an infusion of iron sucrose (Venofer, Vifor France SA, France) during the last 30 min of hemodialysis sessions. Blood samples were collected at the indicated time points and isolated serum was frozen until further analysis. Visualization of transferrin forms was performed by U-PAGE as described previously,8 while quantification of hepcidin was performed according to an ELISA method developed previously by our group9 (Online Supplementary Appendix).
In initial experiments, the U-PAGE methodology was employed for estimation of Tf-Sat in human sera. A typical example of analysis of Tf forms in sera derived from 4 healthy individuals is shown in Online Supplementary Figure S1A. Densitometric analysis of the different bands allowed the quantification of iron-transferrin forms and the estimation of the overall Tf-Sat in each sample. Measurement of Tf-Sat in the same samples was also performed by a routine laboratory method, based on colorimetric estimation of serum iron and unsaturated iron binding capacity (UIBC). A strong correlation between the laboratory method and U-PAGE analysis was apparent as presented in Online Supplementary Figure S1B (r=0.982; P<0.0001, n=20). These results showed that U-PAGE is a reliable method for estimating Tf-Sat in serum samples and that it could be used in HD patients after i.v. iron infusion. It has to be stressed here that samples received after iron administration showed erroneously higher values for Tf-Sat (12%–105%) when analyzed by the laboratory method, indicating the existence of considerable amounts of NTBI (data not shown).
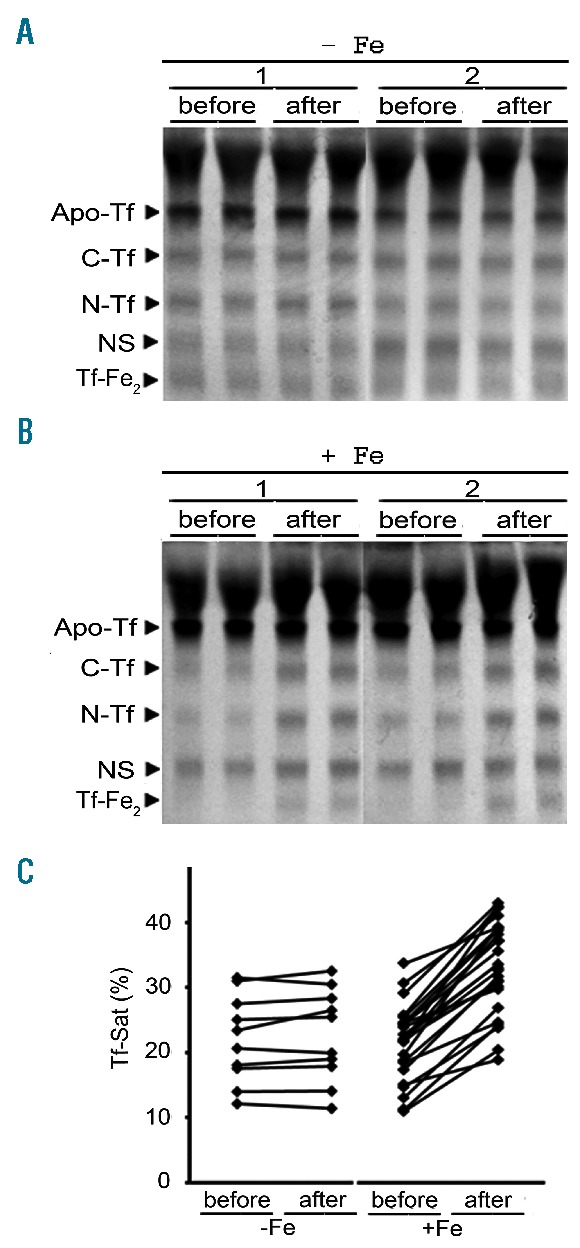
Next, U-PAGE was used for the determination of Tf-Sat in HD patients, following i.v. infusions of 100 mg iron. In control experiments, it was established that Tf-Sat remained unchanged during hemodialysis in the absence of iron administration (Figure 1A and C). In Figure 1B, a characteristic gel of duplicate samples obtained from 2 different HD patients 15 min before and 15 min after a 30-min iron loading period is presented. A significant elevation in Tf-Sat was apparent in all samples tested (Figure 1C). The amount of both mono- and di-ferric-Tf forms seemed to be increased, while apo-Tf was decreased. The mean difference [ΔTf-Sat(%)] between pre-loading values and those obtained 15 min after iron supplementation was 11.41±2.25% (21.15±5% vs. 32.56±7.25%; P<0.0001, n=25). It is plausible that this consistent, fast and significant increase of Tf-Sat may result, at least in part, from a direct transfer of iron to Tf, without preceding uptake, processing and release by macrophages.
Figure 1.

Elevation of Tf-Sat following intravenous (i.v.) iron administration in hemodialysis (HD) patients. Representative U-PAGE gels of duplicate serum samples obtained from 2 different HD patients at the same time points, without (A) or with (B) iron administration, which was carried out during the last 30 min of the hemodialysis session. Samples were received 15 min before the initiation and 15 min after the termination of a 100 mg iron donation in the form of iron sucrose. (C) Tf-Sat values estimated by densitometric analysis from U-PAGE gels in samples obtained from HD patients in the absence of iron administration (left, n=10), or after administration of 100 mg iron (right, n=25). Apo-Tf: apotransferrin; C-Tf: C-terminal monoferric-Tf; N-Tf: N-terminal monoferric-Tf; NS: a non-specific protein; Tf-Fe2: diferric-Tf.
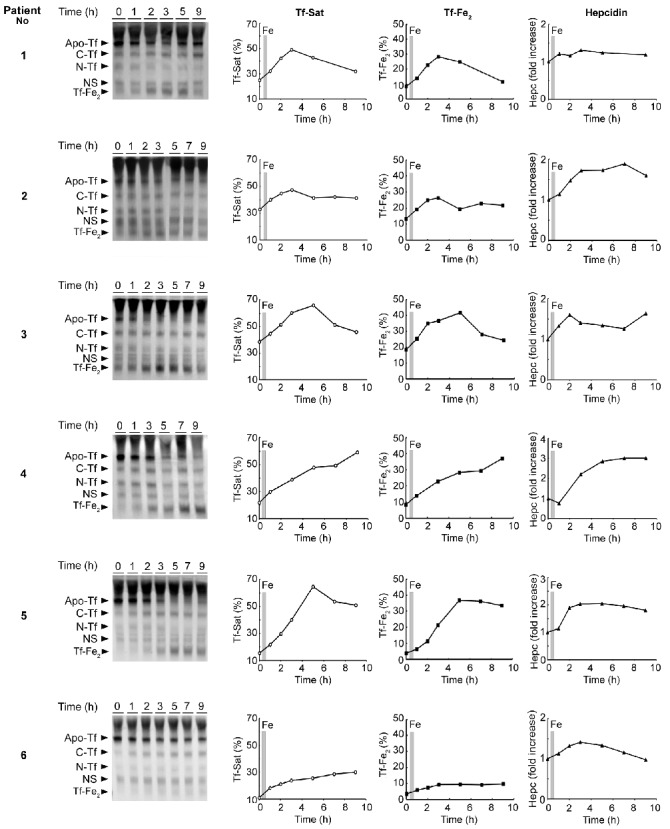
Next, we extended the determination of Tf-Sat for longer periods after the termination of iron administration in 6 male HD patients (patients’ characteristics are presented in Online Supplementary Table S1). Representative U-PAGE gels of samples obtained at different time points after iron administration are presented in Figure 2 (left column). The iron-Tf forms seemed to continue to increase several hours after the termination of iron infusion. Both Tf-Sat (middle left column) and Tf-Fe2 (middle right column) increased substantially in all 6 patients tested (Figure 2). A peak was observed in 4 of the 6 patients after 3–5 h. In the remaining 2 patients, Tf-Sat and Tf-Fe2 continued to increase during the entire testing period (8 h). After 48 h (before the initiation of the next HD session), Tf-Sat and Tf-Fe2 returned close to the initial values (data not shown). The mean difference of ΔTf-Sat(%) and ΔTf-Fe2(%) between the initial and the highest values was 28.67±12.7% and 20.64±9.9%, respectively (P<0.0001, n=6).
Figure 2.

Changes in Tf-Sat, Tf-Fe2 and serum hepcidin concentration, following intravenous (i.v.) iron administration. Serum samples were obtained from 6 HD patients 15 min before (time point 0) and at different time points after the i.v. administration of 100 mg iron (1, 2, 3, 5, 7 and 9 h). The shaded areas in the graphs indicate the time period (30 min) of iron infusion. Analysis of different Tf forms was performed using U-PAGE (left column). Tf-Sat (middle left column) and Tf-Fe2 (middle right column) were estimated by densitometric analysis. Serum hepcidin concentrations (right column) were estimated by ELISA using specific antibodies, as described in the Online Supplementary Appendix.
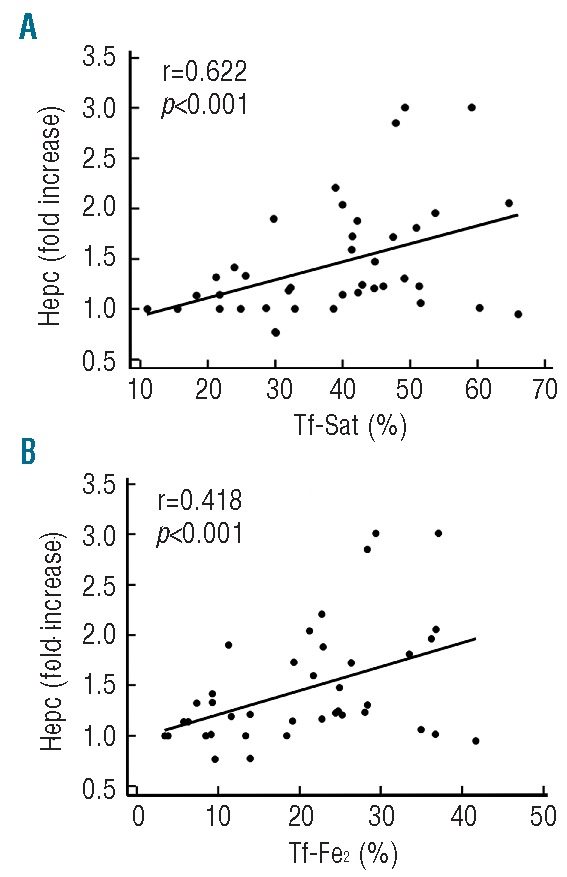
Since the elevation of Tf-Fe2 has been implicated in the induction of hepcidin expression in hepatocytes,5,10,11 serum hepcidin concentrations were determined in the same samples. Interestingly, hepcidin levels increased in parallel with Tf-Sat after iron administration in all patients tested (Figure 2, right column). The increase ranged between 25% and 200% of the initial values among the different patients. Moreover, serum hepcidin levels correlated significantly with Tf-Sat (r=0.622, P=0.001) and Tf-Fe2 (r=0.418, P<0.001) (Figure 3).
Figure 3.

Correlation between Tf-Sat and Tf-Fe2 with serum hepcidin. The correlation between Tf-Sat (A) and Tf-Fe2 (B) with serum hepcidin (fold increase) was evaluated. All values obtained from the 6 patients represented in Figure 2 were included.
Contrary to the results presented in this work, a previous report by Scheiber-Mojdehkar et al. using the same U-PAGE technique failed to detect any increase of Tf-Fe2 after administration of the same iron preparation to HD patients.12 In addition to protein separation by U-PAGE, they transferred the proteins to nitrocellulose membranes and used an anti-Tf antibody in order to determine the different Tf forms. We assume that protein transfer and/or the effectiveness of antibody-protein interaction compromised the sensitivity of this method. In our hands, however, the western blotting technique worked as well as simple U-PAGE for detection and quantification of Tf forms.
Iron-dependent induction of hepcidin expression is a rather complex event that is still not clearly understood. It appears that there are two distinct pathways that respond to elevations in hepatic or serum iron. The first involves induction of BMP6, and the other, sensing of Tf-Fe2 levels, possibly through TfR2 on the plasma membrane of hepatocytes.13,14 It can be hypothesized that the mechanism for hepcidin induction via Tf-Fe2 represents a protective response aimed at preventing oversaturation of Tf and the ensuing emergence of NTBI, which is potentially toxic.
The observation that serum hepcidin levels increased in parallel with Tf-Fe2 shortly after iron administration (Figure 2) indicates a fast signaling response, which is expected to have a negative influence on iron efflux from cells to circulation. Consequently, this will decrease the rate of iron supply to Tf and thereby might negatively influence the utilization of available iron by HD patients, leading to a vicious circle of further iron and EPO requirement. The possibility of surpassing this problem by decreasing the dose and increasing the number of i.v. iron administrations represents a plausible alternative that needs serious consideration and further investigation. Preliminary experiments indicated that lower doses of iron resulted in less increase of serum Tf-Sat and smaller elevation of hepcidin levels (data not shown). This is in agreement with previous studies, which have shown that administration of low doses of iron was beneficial for stabilizing hemoglobin levels and maximizing the efficiency of EPO treatment in HD patients.15
Footnotes
Information on authorship, contributions, and financial & other disclosures was provided by the authors and is available with the online version of this article at www.haematologica.org.
References
- 1.Horl WH. Anaemia management and mortality risk in chronic kidney disease. Nat Rev Nephrol. 2013;9(5):291–301. [DOI] [PubMed] [Google Scholar]
- 2.Sebastiani G, Pantopoulos K. Disorders associated with systemic or local iron overload: from pathophysiology to clinical practice. Metallomics. 2011;3(10):971–986. [DOI] [PubMed] [Google Scholar]
- 3.Ganz T. Systemic iron homeostasis. Physiol Rev. 2013;93(4):1721–1741. [DOI] [PubMed] [Google Scholar]
- 4.Camaschella C. Iron and hepcidin: a story of recycling and balance. Hematology Am Soc Hematol Educ Program. 2013;2013:1–8. [DOI] [PubMed] [Google Scholar]
- 5.Daba A, Gkouvatsos K, Sebastiani G, Pantopoulos K. Differences in activation of mouse hepcidin by dietary iron and parenterally administered iron dextran: compartmentalization is critical for iron sensing. J Mol Med (Berl). 2013;91(1):95–102. [DOI] [PubMed] [Google Scholar]
- 6.Seligman PA, Schleicher RB. Comparison of methods used to measure serum iron in the presence of iron gluconate or iron dextran. Clin Chem. 1999;45(6 Pt 1):898–901. [PubMed] [Google Scholar]
- 7.Sunder-Plassmann G, Horl WH. Safety of intravenous injection of iron saccharate in haemodialysis patients. Nephrol Dial Transplant. 1996;11(9):1797–802. [PubMed] [Google Scholar]
- 8.Makey DG, Seal US. The detection of four molecular forms of human transferrin during the iron binding process. Biochim Biophys Acta. 1976;453(1):250–256. [DOI] [PubMed] [Google Scholar]
- 9.Koliaraki V, Marinou M, Vassilakopoulos TP, et al. A novel immunological assay for hepcidin quantification in human serum. PLoS One. 2009;4(2):e4581. [DOI] [PMC free article] [PubMed] [Google Scholar]
- 10.Bartnikas TB, Andrews NC, Fleming MD. Transferrin is a major determinant of hepcidin expression in hypotransferrinemic mice. Blood. 2011;117(2):630–637. [DOI] [PMC free article] [PubMed] [Google Scholar]
- 11.Ganz T. Is TfR2 the iron sensor? Blood. 2004;104(13):3839–3840. [Google Scholar]
- 12.Scheiber-Mojdehkar B, Lutzky B, Schaufler R, Sturm B, Goldenberg H. Nontransferrin-bound iron in the serum of hemodialysis patients who receive ferric saccharate: no correlation to peroxide generation. J Am Soc Nephrol. 2004;15(6):1648–1655. [DOI] [PubMed] [Google Scholar]
- 13.Lin L, Valore EV, Nemeth E, Goodnough JB, Gabayan V, Ganz T. Iron transferrin regulates hepcidin synthesis in primary hepatocyte culture through hemojuvelin and BMP2/4. Blood. 2007;110(6):2182–2189. [DOI] [PMC free article] [PubMed] [Google Scholar]
- 14.Ramos E, Kautz L, Rodriguez R, et al. Evidence for distinct pathways of hepcidin regulation by acute and chronic iron loading in mice. Hepatology. 2011;53(4):1333–1341. [DOI] [PMC free article] [PubMed] [Google Scholar]
- 15.Singh A. Hemoglobin control, ESA resistance, and regular low-dose IV iron therapy: a review of the evidence. Semin Dial. 2009;22(1):64–69. [DOI] [PubMed] [Google Scholar]


