Abstract
Early embryonic heart development is a period of dynamic growth and remodeling, with rapid changes occurring at the tissue, cell, and subcellular levels. A detailed understanding of the events that establish the components of the heart wall has been hampered by a lack of methodologies for three dimensional (3D), high-resolution imaging. Focused ion beam-scanning electron microscopy (FIB-SEM) is a novel technology for imaging 3D tissue volumes at the subcellular level. FIB-SEM alternates between imaging the block face with a scanning electron beam and milling away thin sections of tissue with a focused ion beam, allowing for collection and analysis of 3D data. FIB-SEM was used to image the three layers of the day 4 chicken embryo heart: myocardium, cardiac jelly, and endocardium. Individual images obtained with FIB-SEM were comparable in quality and resolution to those obtained with transmission electron microscopy (TEM). Up to 1100 serial images were obtained in 4 nm increments at 4.88 nm resolution, and image stacks were aligned to create volumes 800–1500 μm3 in size. Segmentation of organelles revealed their organization and distinct volume fractions between cardiac wall layers. We conclude that FIB-SEM is a powerful modality for 3D subcellular imaging of the embryonic heart wall.
Keywords: Focused ion beam, scanning electron microscopy, FIB-SEM, embryonic heart development, cardiac outflow tract, chick embryo, segmentation
INTRODUCTION
Early embryonic heart formation requires a finely orchestrated series of biological events dictated by genetic programs and regulated by the environment in which the embryo develops. Both abnormal gene coding and altered blood flow conditions have been shown to detrimentally affect cardiac development, resulting in anomalous growth and remodeling of the heart wall and leading to congenital heart defects (Sedmera et al., 1999; Hogers et al., 1999). Despite the obvious importance of proper cardiac growth, many aspects of normal cardiac development, especially at the subcellular level, are not known. A better understanding of the developmental processes that regulate heart development at the subcellular level could elucidate mechanisms that lead to structural defects.
Electron microscopy studies have been instrumental to our current understanding of early heart morphology. Scanning electron microscopy (SEM) studies of the embryonic heart have greatly contributed to our understanding of tissue-level cardiac structures. The 3D appearance of these inherently 2D, high-resolution images, and their relatively large field of view have enabled visualization of the entire embryonic heart during the earliest stages of development (Manner, 2000; Van der Heiden et al., 2005; Sedmera et al., 1999). SEM studies have revealed large-scale structural changes in the vertebrate heart throughout development (Manner, 2000), as well as the anatomical configurations of structural anomalies underlying congenital heart defects under perturbed hemodynamic conditions (Hogers et al., 1999; Sedmera et al., 1999). In contrast, transmission electron microscopy (TEM) studies look at thin sections of heart tissue, and have revealed unique cellular and sub-cellular properties of the endothelial lining (Zhang & Pasumarthi, 2007; Hurle & Colvee, 1983), extracellular matrix (Tan et al., 2011) in developing heart valves, and myofibrillar content in the embryonic myocardium (Barbera et al., 2000; Price et al., 1996). However, 2D TEM images are not ideal for demonstrating the 3D spatial organization of subcellular organelles including intricate networks of mitochondria and contractile myofibrils. Analysis of serial ultrathin sections reconstructed from TEM images has proven to be laborious and technically challenging due to frequent loss and deformation of sections and problems with image alignment due to drift (Blow, 2007). Further, other 3D techniques, such as confocal microscopy, serial 2-photon tomography, or magnetic resonance imaging (MRI), do not typically have sufficient resolution for imaging fine, subcellular structures (Messerli & Perriard, 1995). Thus our understanding of how cardiac cells internally organize and develop to eventually form an optimal beating structure has been hampered by a lack of 3D imaging modalities for studying heart tissue organization at the subcellular level.
Focused ion beam scanning electron microscopy (FIB-SEM), or “slice and view”, is a novel technique for 3D structural imaging. Though widely applied in material sciences, the use of FIB-SEM is only now emerging for biological purposes (Knott et al., 2011; Villinger et al., 2012; Sonomura et al., 2013). Using FIB-SEM, a block sample face can be imaged with the SEM at nanometer resolution and then milled with the FIB in small increments (down to 4 nm) to remove a thin sample layer and serially expose deeper layers of tissue to image. This procedure produces a stack of 2D SEM images that together form a 3D volume of tissue.
In the current study, we used FIB-SEM to image early embryonic cardiac tissue in the heart outflow tract (OFT) of the day 4 chicken embryo. At this stage in chicken embryos (stage Hamburger-Hamilton (HH)24; (Hamburger & Hamilton, 1992)) the heart is a beating tubular structure that is preparing for the intensive remodeling process required to give rise to chambers and valves. The OFT region, which will form the great vessels of the heart, is a site of extensive investigation due to its known sensitivity to hemodynamic perturbations at this stage, and its propensity for developmental changes that lead to congenital heart defects (Hove et al., 2003; Rothenberg et al., 2003). Outflow tract walls consist of three layers: the outer layer of contractile myocardium, middle layer of cardiac jelly (mostly extracellular matrix), and endocardial cells which line the vessel lumen. Despite the fact that this tubular heart segment is clearly a critical site for heart wall formation, in which cells from three distinct cardiac layers interact biochemically and mechanically during cardiogenesis, OFT sub-cellular structures have not been well characterized in 3D.
We present an en block staining protocol for imaging chick embryonic heart tissue and demonstrate that the individual ultrastructural 2D images obtained with FIB-SEM are comparable in quality and resolution to those obtained with TEM. FIB-SEM thus allowed for 3D image reconstructions of the heart wall with unprecedented sub-cellular details. We examine each of the three distinct layers of OFT tissue: the myocardium, cardiac jelly and endocardium. We further show that image segmentation of 3D tissue images allows for comparison of cellular and organelle organization as well as volume fractions between these regions.
MATERIALS AND METHODS
Sample Preparation
White leghorn chicken eggs (Featherland Farms, Eugene, OR) were incubated blunt end up in a humidity-controlled rocking 38°C incubator. After approximately four days of incubation the eggs were windowed and embryos were collected at HH24. Whole embryos were placed in fixative (2.5% paraformaldehyde, 2.5% glutaraldehyde) during dissection of the OFT region nearest to the ventricle. The fixed OFT was stained with 1% osmium tetroxide and 0.8% potassium ferrocyanide in 0.1 M sodium cacodylate buffer for 2 hours, rinsed with water, stained en block with 1% uranyl acetate for 30 minutes, then dehydrated with graded series of acetone (50-70-90-100% for 20 minutes each). Samples were then infiltrated with 1:1 mix of acetone and Epon 812 (EMS cat#14120) overnight with rotation. After this incubation step, the 1:1 mix was replaced with Epon 812 and allotted time to polymerize overnight at 60°C. The OFT tube was oriented longitudinally in the block such that when Epon block was subsequently trimmed, the imaging face would show the OFT’s three layers (myocardium, cardiac jelly, and endocardium) in cross section.
Transmission Electron Microscopy
Thin sections (100 nm) obtained from the block face were imaged at 120 kV on a FEI-Tecnai™ Spirit TEM system for assessment of tissue contrast and fixation, and for comparison with FIB-SEM images. Images were collected as 2048 × 2048 pixel, 16-bit gray scale using the FEI’s TEM Imaging & Analysis (TIA) interface on an Eagle™ 2K CCD multiscan camera.
Focused Ion Beam Scanning Electron Microscopy
The sample block was mounted on an aluminum ½″ slotted head, 1/8″ pin stub (Ted Pella cat# 16111) and sputter-coated with a thin layer (< 10 nm) of platinum/palladium using a Hummer X (Anatech Ltd) sputter coater to electrically ground the sample and limit charging. Silver paint (Leitsilber 200 Ted Pella cat# 16035) was added near the sample region to draw charge from this area during scanning. The samples were imaged and processed for 3D data collection on a FEI Helios 650 NanoLab™ DualBeam™ system (Figure 1A).
Figure 1. Preparation steps for FIB-SEM imaging.
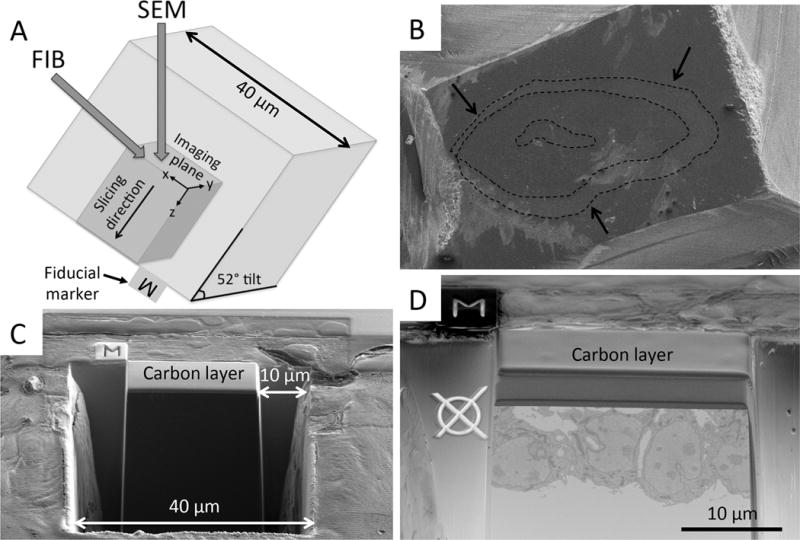
(A) Schematic of FIB-SEM configuration demonstrates the angle of the FIB and SEM beams relative to the imaging plane. (B) Image obtained using a relatively high acceleration voltage, so that the OFT tissue could be located within the resin. From this image, the user selects a region of interest for FIB-SEM imaging. Dotted lines outline the OFT tissue layers (endocardium, cardiac jelly and myocardium), and the arrows denote the outer myocardial wall. (C) Carbon layer deposition and trenches. A thin layer of carbon is deposited with the FIB over the region of interest. Using the FIB, trenches are dug tangential to the imaging plane (40 μm width) and on either side of the region of interest (10 μm). (D) Fiducial markers. Imaging fiducial marker (Ø) is milled into the resin and the milling fiducial (M) onto a platinum coated area close to the carbon protected area. Both fiducials enable automatic image detection and alignment correction in both the imaging and milling positions between each slice and view pass. To acquire the image in panel D the stage was tilted such that the angle between the block face imaging plane and the SEM beam was 45 degrees, the angle for optimal viewing of the block face.
To locate the OFT, the block face was scanned at an acceleration voltage of 5 to 10 kV and a current of 0.2 nA on SEM at 4 mm working distance, using a Everhart-Thornley Detector (ETD). At this relatively high acceleration voltage, the three layers of the OFT were visible in cross section (Figure 1B). At this point any region of myocardium, cardiac jelly, or endocardium can be chosen at random for FIB-SEM imaging. To simplify selection and preparation for FIB-SEM, only regions where the layer of interest was linearly oriented, of approximately average thickness, and without overlying particles on the surface were chosen.
To run a slice and view using the FIB-SEM the following steps are needed: (1) isolation of the imaging face from within the sample, which requires milling into the resin of the block, (2) construction of three trenches using the ion beam, to provide a space for material milled during the slice and view process to deposit, and (3) milling of fiducial markers for automatic image detection and alignment between each slice and view pass. To protect the region of interest from ion beam damage during these processes, a thin layer of carbon (20 μm × 17 μm × 1 μm, Figure 1 C,D) was deposited over the region of interest prior to any milling. A large trench (roughly 40 μm × 40 μm × 40 μm, Figure 1C) was made with the FIB (current 9.3–21 nA and acceleration voltage of 30kV) tangential to the block face, directly in front of the carbon-protected region. This trench revealed the imaging face. Two additional, smaller trenches (10 μm × 20 μm × 40 μm, Figure 1C) were made on either side of the carbon-protected region, providing a region for milled material to be deposited. Fiducial markers were added for automatic image detection and alignment correction in both the imaging and milling positions (Figure 1D). For the fiducial used in the milling position, a thin layer of platinum in an area of 5 μm2 was deposited and then the fiducial (M, Figure 1C) was milled into it. Immediately prior to 3D volume image acquisition, the imaging face was cleaned with the FIB using a 0.79 nA current at 30kV.
Regions of interest were imaged utilizing FEI’s Auto Slice & View™ G3 software package to automate the serial sectioning and data collection processes. The block face was scanned on SEM at 45° tilt and 2.5 mm working distance. For each slice, 4 nm of the tissue and resin was removed with the FIB at 52° tilt and 4 mm working distance. Each serial face was then imaged with a 2kV acceleration voltage and a current of 0.2 nA in backscatter mode (BSE) with inverse contrast using the through-lens detector of the Elstar immersion lens. Images were acquired as 4096 × 3536 pixels, 8-bit gray scale, at a resolution of 4.88 nm per pixel. 1100 slices were obtained through the myocardial wall and into the cardiac jelly for an image stack 4.4 μm in depth. 400 slices were obtained through the endocardial cell layer for an image stack 1.6 μm in depth.
Image Processing and Segmentation
Image stacks were aligned and cropped using the FEI Amira ResolveRT™ software package (FEI, North America NanoPort 5350 NE Dawson Creek Drive, Hillsboro, Oregon 97124 USA), creating volumes 800 μm3 (endocardium) and 1500 μm3 (myocardium and cardiac jelly) in size (Figure 2). 3D volumes were manually segmented using the Amira platform to label cellular tissue, cell nuclei, mitochondria, and myofibrils. Measurements of cellular and organelle volumes were extracted from these segmentations.
Figure 2. 3D view and orthoslices from FIB-SEM imaging of the endocardium.
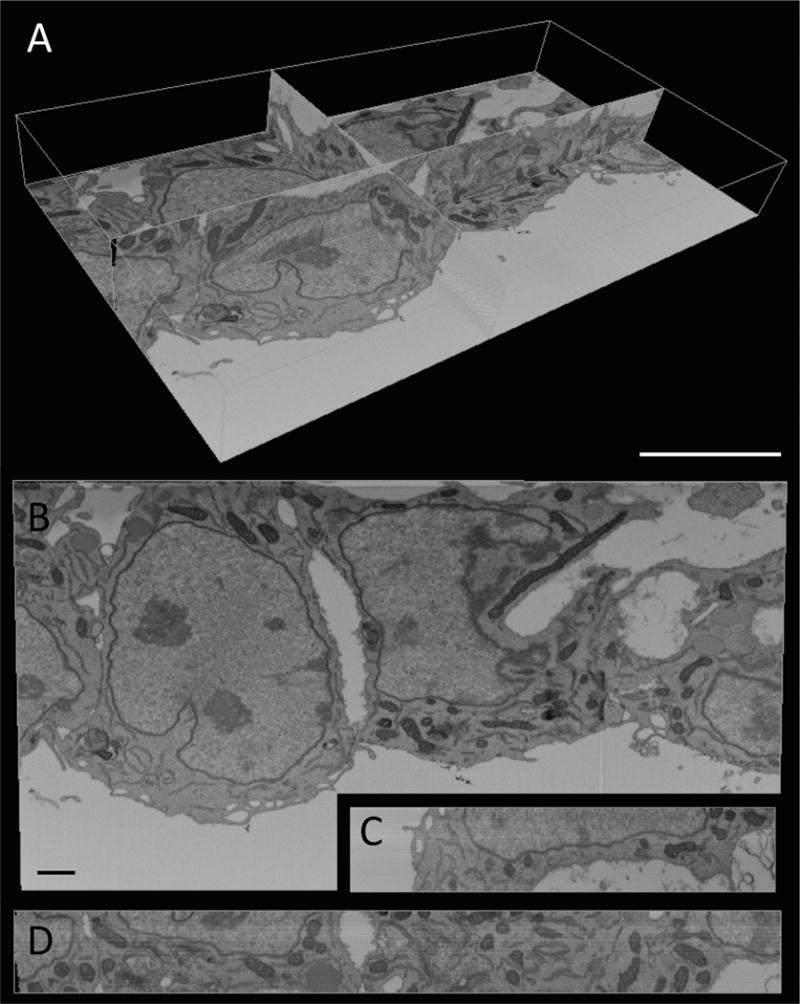
(A) Volumetric view of acquired images. Three imaging planes are shown to illustrate the 3D nature of FIB-SEM data. A bounding box (white) outlines the total volume of this dataset. Scale, 5 μm. (B-D) Orthoslices from each of the imaging planes shown in A: (B) X-Y plane; (C) X-Z plane; (D) Y-Z plane. Scale, 1μm. The X-Y plane (B) shows the view of sections as they come off the block face, while the X-Z plane (C) and Y-Z plane (D) demonstrate the depth of sectioning performed during this example scan (400 slices in the Z direction, with 4 nm distance between contiguous slices). A video panning through this entire image stack can be found online (http://www.ohsu.edu/xd/education/schools/school-of-medicine/departments/basic-science-departments/biomedical-engineering/research/examples-of-fib-sem-images.cfm).
RESULTS
Prior to FIB-SEM imaging, thin sections were imaged with TEM for assessment of tissue contrast and fixation, and for later straight-forward comparison with FIB-SEM images (Figure 3). TEM images revealed that the fixative and en block staining procedures used were able to penetrate each layer of the OFT wall, resulting in a well-retained ultrastructure and ultrastructural contrast comparable to that of traditional TEM staining techniques. Due to the inverse contrast applied during FIB-SEM image acquisition, the appearance of cardiac tissue on FIB-SEM images was very similar to that of images obtained by TEM. Further, the FIB did not appear to cause damage to the resin or tissue ultrastructure at the block face, nor did the acceleration voltage (2 kV) used for SEM image acquisition, and thus SEM images were comparable to TEM images obtained from the same block. Further, FIB-SEM images revealed the same resolution of ultrastructures as TEM images (Figures 3C–E).
Figure 3. Comparison of TEM and FIB-SEM images.

Example images of the myocardial wall are shown for (A) TEM and (B) FIB-SEM imaging. TEM image was acquired at 9300X magnification at a resolution of 2.29 nm per pixel. Representative FIB-SEM images were acquired at 4.88 nm resolution. Both modalities highlight the fine structures such as myofibrils (20 nm in diameter) and mitochondrial cristae. (C–E) The resolution of FIB-SEM images is illustrated via higher magnification views, showing (C) double layer nuclear membrane (white arrow), (D) mitochondrial cristae (*), and (E) myofibrils (m). All scale bars, 0.5 μm.
The field of view and resolution on FIB-SEM images allowed for ultrastructural comparisons of relatively large volumes. Example FIB-SEM images revealed the diverse ultrastructure of the three OFT tissue layers (Figure 4A–C). Though a relatively large region was imaged from the block face (up to 20 × 17 μm in this study, or 4096 × 3536 pixels at 4.88 nm pixel size), resolution was not sacrificed, and as such, very fine details were observed (see also Figures 3C–E). Higher magnification views of images from the three layers (Figure 4D–F) demonstrated that organelles such as the mitochondria, Golgi apparatus, and endoplasmic reticulum, as well as endothelial microvilli were easily distinguished. Cristae were clearly visible within the mitochondria of each layer, bundles of myofibrils and sarcomeres were prominent in the myocardium (Figure 4A,D) and a network of fibril-like structures was visible in the extracellular matrix of the cardiac jelly (Figure 4E).
Figure 4. FIB-SEM imaging of the three layers of the cardiac outflow tract wall.
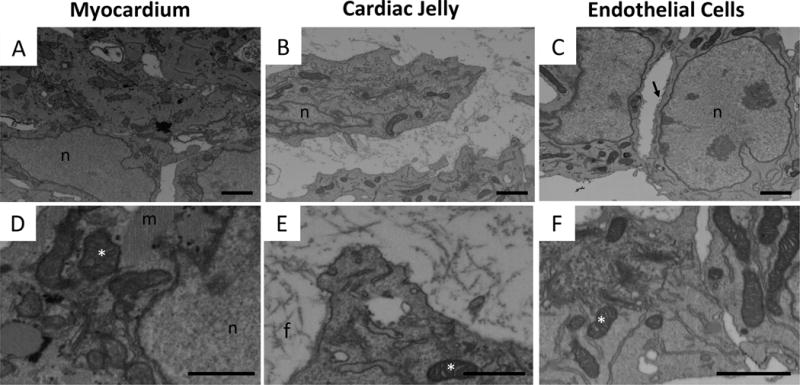
FIB-SEM images of representative regions of the OFT wall layers: (A, D) myocardium, (B, E) cardiac jelly, and (C, F) endocardium. Top row (A–C), depicting regions of ~5.5 μm × 8 μm, demonstrate general tissue contrast and highlight prominent differences in cellular organization and cellular versus extracellular composition of the three layers. Bottom row (D–F), showing higher magnification views, highlights organelle contrast and tissue ultrastructure. n, nucleus; m, myofibrils; f, fibers in extracellular matrix; *, mitochondria; arrow, microvilli.
The primary advantage of FIB-SEM over traditional TEM imaging is the 3D nature of the data. Image stacks were aligned using Amira visualization software to create 3D volumes. The images in Figure 2 showing the XY, XZ, and YZ planes were acquired from the reconstructed 3D image stacks. Due to the small slicing thickness (4 nm) and comparable image pixel size (4.88 nm), an almost isotropic resolution was obtained. The 3D nature of this data could also be appreciated from panning through reconstructed image stacks (Supplemental videos at http://www.ohsu.edu/xd/education/schools/school-of-medicine/departments/basic-science-departments/biomedical-engineering/research/examples-of-fib-sem-images.cfm).
Image stacks were manually segmented, allowing for quantitative measurements of volume and volume fractions and visual assessment of subcellular organization. Segmentation was first performed to distinguish cellular from extracellular tissue (Figure 5A). These data revealed that the myocardial layer was the most densely packed tissue layer in the OFT, with negligible extracellular space. The endothelial cell layer was also very densely packed; extracellular space comprised only 2.5% of total volume. In contrast, the cardiac jelly layer was 72% non-cellular, reflecting its extensive extracellular matrix component. Further segmentation of cellular tissue into nuclear, mitochondrial, and myofibril components was used to assess relative distribution, organization, and organelle volume fractions (Figure 5B). Nuclear cellular volume fraction varied widely between the three layers, from 6% in cardiac jelly to ~20% in endothelium and myocardial tissue. Mitochondrial cellular volume fraction was similar in the endothelial and cardiac jelly layers (5–6%), approximately half that of the myocardial layer (11%). Contractile myofibrils, only present in the muscular myocardium, made up 32% of the cells in this densely packed layer. Isosurface renderings of segmented organelles visually reflected these volume fractions (Figure 6).
Figure 5. Cellular and sub-cellular volume fractions in the endocardium, cardiac jelly, and myocardium.
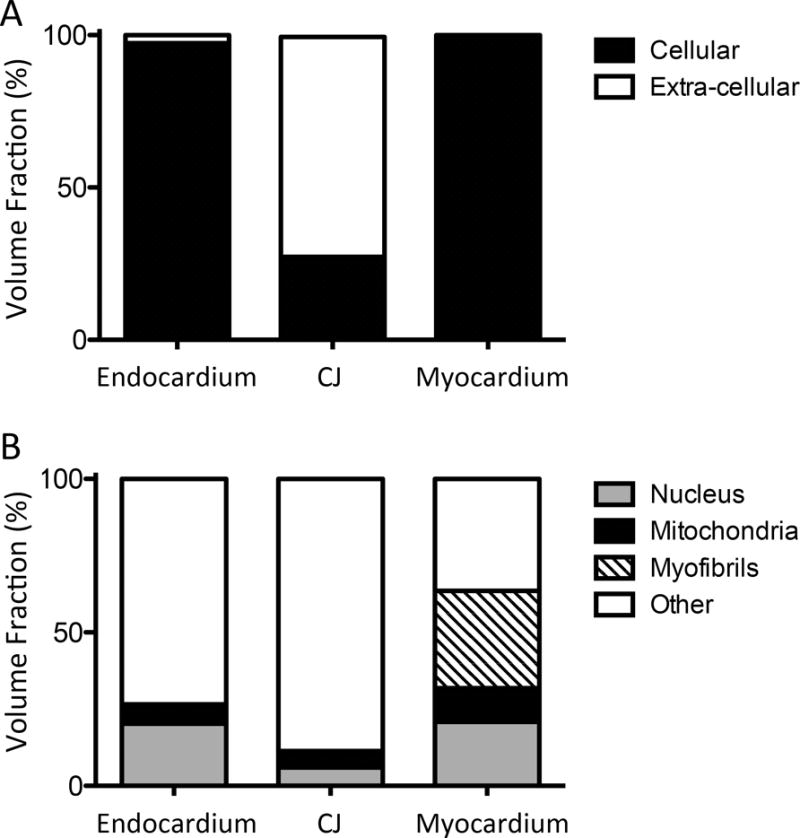
Reconstructed and aligned 3D image stacks of the cardiac layers were manually segmented. The volume of each segmented region was ascertained, allowing for a quantitative comparison of volume fractions. (A) Cellular and extra-cellular volume fractions for each layer of the cardiac wall. As expected, only the cardiac jelly layer contained a significant portion of extra-cellular tissue. (B) Volume fractions of sub-cellular structures (nuclei, mitochondria, myofibrils) within the cells.
Figure 6. Isosurface renderings of 3D segmentations within each of the three layers of the OFT wall.
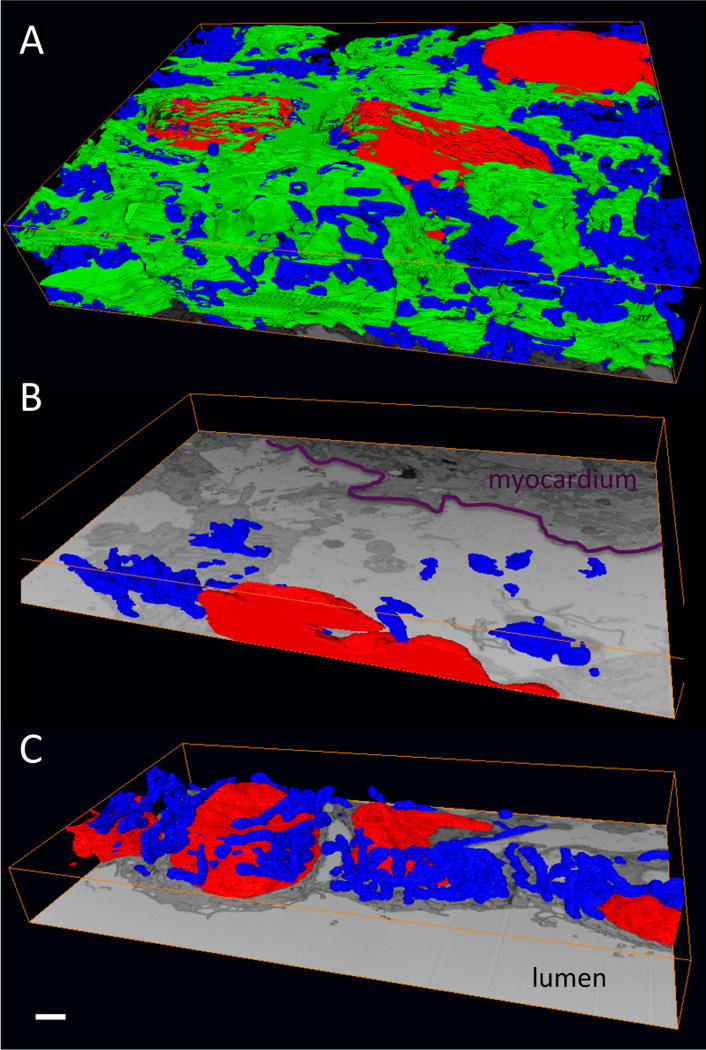
(A) Myocardium; (B) cardiac jelly; (C) endocardium. The segmentations show sub-cellular structures within the cells in each layer: nuclei (red), mitchondria (blue) and myofibrils (green). Note that the myofibrils, which are active contractile proteins, are only present in the myocardium. Also, a comparison of the panels demonstrates the densely packed nature of the myocardium and the mostly extracellular nature of the cardiac jelly. The endocardium consists of tightly packed, rounded cells that line the OFT lumen. Scale, 1 μm.
Segmentation also revealed preliminary organization of the early embryonic myocardial tissue (Figure 7). Longitundinal alignment of mitochondria in a stack-like formation was clearly visible from segmented myocardial data. This was not evident from raw image data (Supplemental video 3 at http://www.ohsu.edu/xd/education/schools/school-of-medicine/departments/basic-science-departments/biomedical-engineering/research/examples-of-fib-sem-images.cfm), highlighting the importance of 3D imaging. The myofibrils were disorganized at this stage of development, as previously reported.
Figure 7. Segmented sub-cellular structures of the early embryonic myocardium.
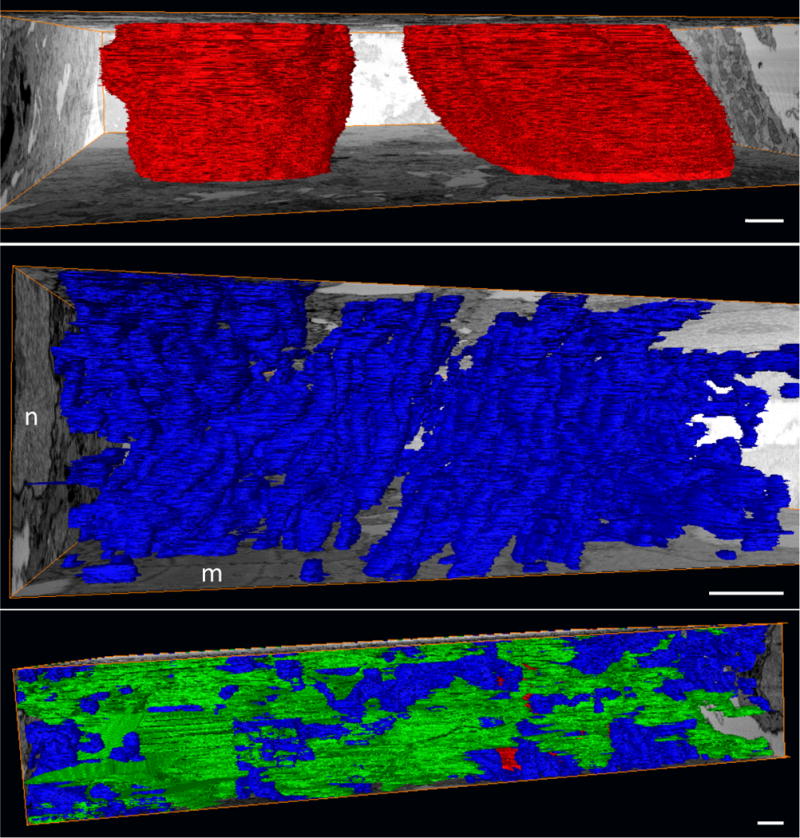
(A) Nuclei (red) are shown spanning the depth of this FIB-SEM dataset. (B) Mitochondrial (blue) organization is apparent even at this early stage (HH24), and is evidenced by the stacked appearance and consistent directionality. A nucleus (n) and myofibrils (m) are evident on the bounding orthoslices. (C) Myofibrils (green) lack organization at this stage, appearing in random orientations and directions throughout the tissue. Scale, 1 μm.
DISCUSSION
This study shows that FIB-SEM imaging and analysis of the early embryonic chicken heart wall provide qualitative visualization of subcellular structures and quantitative data that can be compared between tissue regions and between experimental groups. Images obtained with FIB-SEM were of comparable quality and resolution to those obtained with TEM, thus FIB-SEM was capable of resolving the ultrastructures of the developing heart wall. 2D images revealed distinct differences between the cells of the myocardium, cardiac jelly, and endocardium. Further, segmentation of 3D image stacks provided insight into subcellular organization and relative organelle volumes in the three layers of the OFT wall.
Strengths and limitations of FIB-SEM
Our study revealed significant strengths of the FIB-SEM technique for imaging tissues, which include: (1) fully automated high-resolution imaging of large volumes of tissue (up to 1500 μm3 in this study), (2) ability to visualize and reconstruct microstructures in 3D, (3) ability to trench and image multiple regions from the same tissue for comparative purposes, and (4) the precise FIB technology avoids sectioning artifacts and greatly simplifies image alignment compared to traditional serial TEM sections and serial block-face SEM. The ability to evaluate contrast on TEM imaged thin-sections prior to FIB-SEM imaging is another significant cost and time saving advantage. Additionally, others have shown that immunostaining markers are visible on FIB-SEM images of tissue, allowing for specific localization of molecules of interest within the microstructures (Sonomura et al., 2013). These advantages of FIB-SEM make it ideal to image cardiac chicken embryonic tissues, in which elucidation of 3D ultrastructural organization is important.
The FIB-SEM technique, however, has limitations for studies for the heart and, we anticipate, other tissues. Although image collection is fully automated, scan times for collecting large volumes of tissue can be on the order of days. Scan time depends entirely on user defined settings for image quality, slice thickness, and size of the tissue volume to be imaged. Imaging times can be decreased by decreasing volume size, milling away thicker sections of tissue or decreasing image capture quality (eg. resolution, frame averaging). However, this will compromise isotropic imaging and therefore resolution. We found that the manual segmentation of large image stacks is extremely time consuming. Alternatively, rather than labeling an entire tissue volume, tissue volume fractions could be determined using stereological methods for systematic random sampling (Muhlfeld et al., 2010). Such analysis is often done for TEM images of the heart (Gruber et al., 2012) and is a rapid method for systematically determining volumes. However, as stereology evaluates randomly selected, smaller areas of tissue to extrapolate to a larger volume, it does not confer information on connectivity, orientation, and interaction of sub-cellular components. The high contrast of our FIB-SEM images suggests that semi-automated segmentation analysis could be applied to these images, as has been done for TEM images of the kidney (Kamenetsky et al., 2009), which greatly reduced segmentation time, making analysis of larger number of specimens more feasible. Therefore in the future, novel imaging analysis and segmentation techniques will enable researchers to more efficiently extract information from these unique structurally rich FIB-SEM image stacks.
While relatively new to biological applications, the use of FIB-SEM is not limited to embryonic or cardiac tissue; recent studies have used it to visualize the microstructure of the brain (Knott et al., 2011; Sonomura et al., 2013; Blazquez-Llorca et al., 2013), the optic nerve (Schertel et al., 2013), and red blood cells (LCS Medeiros et al., 2012). FIB-SEM has also recently been used to image lipid droplets in adult heart ventricles (Wang et al., 2013). In future, these datasets should enable detection of subtle ultrastructural changes that could play a role in disease states. Indeed subtle, structural changes have recently been detected via FIB-SEM in a Drosophila model for Alzheimer’s disease (Park et al., 2013). We propose that FIB-SEM will provide a powerful tool for detailed study of ultrastructural changes in the embryonic heart during normal development and in response to genetic and hemodyamic perturbations.
Understanding embryonic OFT ultrastructure from FIB-SEM images
As expected for microstructures critical for heart contraction, mitochondria and myofibrils comprise a large proportion of the OFT myocardial wall. The volume fraction of mitochondria and myofibrils within the heart muscle increases during development and into postnatal life (Brook et al., 1983). Subcellular volume fractions in the ventricular myocardium range from 30–50% for myofibrils and 18–45% for mitochondria in the more mature late fetal, newborn, and juvenile heart wall (Chin et al., 1998; Olivetti et al., 1980; D M Medeiros et al., 1991). In the near term fetus, the myofibrillar fraction of the cardiomyocyte has increased to 56% but the extracellular fraction remains at 11% (Barbera et al., 2000). Thus, despite our small sample size, reports of 32% for myofibrils and 11% for mitochondria in the very early embryonic outflow tract tissue seem reasonable.
Mitochondrial volume fraction was lower in the non-contractile layers of the OFT wall (5–6%), as expected. Cardiac jelly is known to be a predominantly extracellular layer, which is very apparent from our cellular volume fraction data (72% extracellular), and consistent with images from others at this stage of development (Tan et al., 2011). Though mostly extracellular, the extensive, radially-arranged fibril matrix of the cardiac jelly together with glycosaminoglycan components provides internal hydrostatic pressure that is thought to be critical both for structural support and for directing morphogenesis (Nakamura & Manasek, 1981). A network of fibrils is apparent near the endothelial cell layer on our cardiac jelly images at this early stage. This matrix is produced mostly from fibroblast cells within the cardiac jelly layer, explaining their extensive protein synthesis producing machinery visible within the cells of this layer.
Endothelial cells formed a tightly packed monolayer with central, prominent nuclei. Interestingly, though nuclei appeared very dominant in some individual 2D slices (e.g. Figure 2B), nuclear volume fraction in this layer was similar to the myocardium (~20%). This result reflects the large number of image sections (>400) included in this volume measurement, and highlights the unbiased nature of the segmented data.
Segmented datasets also provided insight into organelle orientation at this early stage of heart development. Longitudinal stacking of mitochondria and myofibrils is a hallmark of mature myocardial tissue (and indeed all muscle tissue), and has been shown to aid in contraction (Roberts et al., 1979). Rigorous alignment is clear from longitudinally-oriented TEM images of mature heart muscle. Myofibril alignment has been shown as early as 51 days (1/3 of gestation) in fetal sheep myocardium (Brook et al., 1983) and 24 weeks of gestation in humans (Kim et al., 1992). However, 2D TEM images were not able to distinguish the early stages of alignment, thus the time course of this vital process is poorly understood. Indeed, organization was not evident on 2D sections obtained from the FIB-SEM. Myofibrils exhibited no alignment or organization in 3D image volumes at this early stage, consistent with reports on fetal sheep at a slightly later stage, equivalent to HH31 (day 7) in chick (Brook et al., 1983). In contrast, after image stacking and segmentation, our myocardial dataset provided evidence for mitochondrial stacking in the HH24 chicken embryo heart, just 4 days into development. No evidence of alignment or clustering (e.g. around the nucleus) of mitochondria was observed in the endothelial or cardiac jelly layers. These results highlight the usefulness of FIB-SEM in quantifying and visualizing early ultrastructural organization of cardiac tissues.
In conclusion, FIB-SEM imaging offers numerous strengths for 3D imaging of the embryonic heart subcellular microstructure at nanometer-level resolution, much higher than that of other 3D tissue imaging modalities (eg. confocal imaging, serial 2-photon tomography, or MRI). Further, large image volumes can be acquired with FIB-SEM that allow detailed analysis of organelle organization. Fully automated serial images are generated with comparable image quality to TEM images. 3D reconstruction and segmentation of these images enables qualitative and quantitative analysis of the developing ultrastructures in the heart wall. This information can be used to evaluate 3D subcellular organization and quantify organelle volume fractions in the embryonic heart wall. Results obtained in the current study show the utility of using FIB-SEM for understanding normal ultrastructural development of cardiac tissue, including understanding of sub-cellular architecture and organization, and also suggest its use for quantitative evaluation of anomalies in the genetically or environmentally-perturbed embryonic heart.
Acknowledgments
This work was supported by awards NIH R01 HL094570 to SR; Oregon Health and Science University (OHSU) Center for Spatial Systems Biomedicine (OCSSB) pilot project award to SR and an Oregon State University (OSU) Johnson Scholarship to CGG. The content is solely the responsibility of the authors and does not necessarily represent the official views of grant giving bodies. Electron microscopy was performed at the Multi-scale Microscopy Core (MMC) with technical support from the OHSU-FEI Living Lab and the OCSSB.
References
- Barbera A, Giraud GD, Reller MD, Maylie J, Morton MJ, Thornburg KL. Right ventricular systolic pressure load alters myocyte maturation in fetal sheep. Am J Physiol Regul Integr Comp Physiol. 2000;279:R1157–64. doi: 10.1152/ajpregu.2000.279.4.R1157. [DOI] [PubMed] [Google Scholar]
- Blazquez-Llorca L, Merchan-Pérez A, Rodriguez JR, Gascon J, DeFelipe J. FIB/SEM technology and Alzheimer’s disease: three-dimensional analysis of human cortical synapses. Journal of Alzheimer’s disease : JAD. 2013;34:995–1013. doi: 10.3233/JAD-122038. [DOI] [PubMed] [Google Scholar]
- Blow N. Following the wires. Nature Methods. 2007;4:975–981. [Google Scholar]
- Brook WH, Connell S, Cannata J, Maloney JE, Walker AM. Ultrastructure of the myocardium during development from early fetal life to adult life in sheep. J Anat. 1983;137(Pt 4):729–741. [PMC free article] [PubMed] [Google Scholar]
- Chin TK, Kasmarek TR, York JR, Chen Q, Albertine KH. Changes in Human Cardiac Myocyte Structure With Development and Tetralogy of Fallot. Pediatr Res. 1998;43:19. [Google Scholar]
- Gruber C, Kohlstedt K, Loot AE, Fleming I, Kummer W, Muhlfeld C. Stereological characterization of left ventricular cardiomyocytes, capillaries, and innervation in the nondiabetic, obese mouse. Cardiovasc Pathol. 2012;21:346–354. doi: 10.1016/j.carpath.2011.11.003. [DOI] [PubMed] [Google Scholar]
- Hamburger V, Hamilton HL. A series of normal stages in the development of the chick embryo. 1951. Dev Dyn. 1992;195:231–272. doi: 10.1002/aja.1001950404. [DOI] [PubMed] [Google Scholar]
- Hogers B, DeRuiter MC, Gittenberger-de Groot AC, Poelmann RE. Extraembryonic venous obstructions lead to cardiovascular malformations and can be embryolethal. Cardiovasc Res. 1999;41:87–99. doi: 10.1016/s0008-6363(98)00218-1. [DOI] [PubMed] [Google Scholar]
- Hove JR, Koster RW, Forouhar AS, cevedo-Bolton G, Fraser SE, Gharib M. Intracardiac fluid forces are an essential epigenetic factor for embryonic cardiogenesis. Nature. 2003;421:172–177. doi: 10.1038/nature01282. [DOI] [PubMed] [Google Scholar]
- Hurle JM, Colvee E. Changes in the endothelial morphology of the developing semilunar heart valves. A TEM and SEM study in the chick. Anat Embryol (Berl) 1983;167:67–83. doi: 10.1007/BF00304601. [DOI] [PubMed] [Google Scholar]
- Kamenetsky I, Rangayyan RM, Benediktsson H. Analysis of the Glomerular Basement Membrane in Images of Renal Biopsies Using the Split-and-Merge Method: A Pilot Study. Journal of Digital Imaging. 2009;23:463–474. doi: 10.1007/s10278-009-9233-5. [DOI] [PMC free article] [PubMed] [Google Scholar]
- Kim HD, Kim DJ, Lee IJ, Rah BJ, Sawa Y, Schaper J. Human fetal heart development after mid-term: morphometry and ultrastructural study. J Mol Cell Cardiol. 1992;24:949–965. doi: 10.1016/0022-2828(92)91862-y. [DOI] [PubMed] [Google Scholar]
- Knott G, Rosset S, Cantoni M. Focussed Ion Beam Milling and Scanning Electron Microscopy of Brain Tissue. Journal of Visualized Experiments. 2011 doi: 10.3791/2588. [DOI] [PMC free article] [PubMed] [Google Scholar]
- Manner J. Cardiac looping in the chick embryo: a morphological review with special reference to terminological and biomechanical aspects of the looping process. Anat Rec. 2000;259:248–262. doi: 10.1002/1097-0185(20000701)259:3<248::AID-AR30>3.0.CO;2-K. [DOI] [PubMed] [Google Scholar]
- Medeiros DM, Bagby D, Ovecka G, McCormick R. Myofibrillar, mitochondrial and valvular morphological alterations in cardiac hypertrophy among copper-deficient rats. The Journal of nutrition. 1991;121:815–824. doi: 10.1093/jn/121.6.815. [DOI] [PubMed] [Google Scholar]
- Medeiros L, De Souza W, Jiao C, Barrabin H, Miranda K. Visualizing the 3D architecture of multiple erythrocytes infected with Plasmodium at nanoscale by focused ion beam-scanning electron microscopy. PLoS One. 2012;7:e33445. doi: 10.1371/journal.pone.0033445. [DOI] [PMC free article] [PubMed] [Google Scholar]
- Messerli JM, Perriard JC. Three-dimensional analysis and visualization of myofibrillogenesis in adult cardiomyocytes by confocal microscopy. Microsc Res Tech. 1995;30:521–530. doi: 10.1002/jemt.1070300609. [DOI] [PubMed] [Google Scholar]
- Muhlfeld C, Nyengaard JR, Mayhew TM. A review of state-of-the-art stereology for better quantitative 3D morphology in cardiac research. Cardiovasc Pathol. 2010;19:65–82. doi: 10.1016/j.carpath.2008.10.015. [DOI] [PubMed] [Google Scholar]
- Nakamura A, Manasek FJ. An experimental study of the relation of cardiac jelly to the shape of the early chick embryonic heart. Journal of embryology and experimental morphology. 1981;65:235–256. [PubMed] [Google Scholar]
- Olivetti G, Anversa P, Loud AV. Morphometric study of early postnatal development in the left and right ventricular myocardium of the rat. II. Tissue composition, capillary growth, and sarcoplasmic alterations. Circulation Research. 1980;46:503–512. doi: 10.1161/01.res.46.4.503. [DOI] [PubMed] [Google Scholar]
- Park SJ, Schertel A, Lee KE, Han SS. Ultra-structural analysis of the brain in a Drosophila model of Alzheimer’s disease using FIB/SEM microscopy. Microscopy (Oxford, England) 2013 doi: 10.1093/jmicro/dft039. [DOI] [PubMed] [Google Scholar]
- Price RL, Chintanowonges C, Shiraishi I, Borg TK, Terracio L. Local and regional variations in myofibrillar patterns in looping rat hearts. Anat Rec. 1996;245:83–93. doi: 10.1002/(SICI)1097-0185(199605)245:1<83::AID-AR13>3.0.CO;2-5. [DOI] [PubMed] [Google Scholar]
- Roberts DE, Hersh LT, Scher AM. Influence of cardiac fiber orientation on wavefront voltage, conduction velocity, and tissue resistivity in the dog. Circ Res. 1979;44:701–712. doi: 10.1161/01.res.44.5.701. [DOI] [PubMed] [Google Scholar]
- Rothenberg F, Fisher SA, Watanabe M. Sculpting the cardiac outflow tract. Birth Defects Res C Embryo Today. 2003;69:38–45. doi: 10.1002/bdrc.10007. [DOI] [PubMed] [Google Scholar]
- Schertel A, Snaidero N, Han HM, Ruhwedel T, Laue M, Grabenbauer M, Mobius W. Cryo FIB-SEM: Volume imaging of cellular ultrastructure in native frozen specimens. Journal of structural biology. 2013;184:355–360. doi: 10.1016/j.jsb.2013.09.024. [DOI] [PubMed] [Google Scholar]
- Sedmera D, Pexieder T, Rychterova V, Hu N, Clark EB. Remodeling of chick embryonic ventricular myoarchitecture under experimentally changed loading conditions. Anat Rec. 1999;254:238–252. doi: 10.1002/(SICI)1097-0185(19990201)254:2<238::AID-AR10>3.0.CO;2-V. [DOI] [PubMed] [Google Scholar]
- Sonomura T, Furuta T, Nakatani I, Yamamoto Y, Unzai T, Matsuda W, Iwai H, Yamanaka A, Uemura M, Kaneko T. Correlative analysis of immunoreactivity in confocal laser-scanning microscopy and scanning electron microscopy with focused ion beam milling. Frontiers in neural circuits. 2013;7:26. doi: 10.3389/fncir.2013.00026. [DOI] [PMC free article] [PubMed] [Google Scholar]
- Tan H, Junor L, Price RL, Norris RA, Potts JD, Goodwin RL. Expression and deposition of fibrous extracellular matrix proteins in cardiac valves during chick development. Microsc Microanal. 2011;17:91–100. doi: 10.1017/S1431927610094365. [DOI] [PMC free article] [PubMed] [Google Scholar]
- Van der Heiden K, Groenendijk BCW, Hierck BP, Hogers B, Koerten HK, Mommaas AM, Gittenberger-de Groot AC, Poelmann RE. Monocilia on chicken embryonic endocardium in low shear stress areas. Dev Dyn. 2005;235:19–28. doi: 10.1002/dvdy.20557. [DOI] [PubMed] [Google Scholar]
- Villinger C, Gregorius H, Kranz C, Höhn K, Münzberg C, Wichert G, Mizaikoff B, Wanner G, Walther P. FIB/SEM tomography with TEM-like resolution for 3D imaging of high-pressure frozen cells. Histochemistry and Cell Biology. 2012;138:549–556. doi: 10.1007/s00418-012-1020-6. [DOI] [PubMed] [Google Scholar]
- Wang H, Lei M, Hsia RC, Sztalryd C. Analysis of lipid droplets in cardiac muscle. Methods in cell biology. 2013;116:129–149. doi: 10.1016/B978-0-12-408051-5.00008-5. [DOI] [PMC free article] [PubMed] [Google Scholar]
- Zhang F, Pasumarthi KBS. Ultrastructural and immunocharacterization of undifferentiated myocardial cells in the developing mouse heart. Journal of Cellular and Molecular Medicine. 2007;11:552–560. doi: 10.1111/j.1582-4934.2007.00044.x. [DOI] [PMC free article] [PubMed] [Google Scholar]


