

Abstract
Vision begins with photoisomerization of visual pigments. Thermal energy can complement photon energy to drive photoisomerization, but it also triggers spontaneous pigment activation as noise that interferes with light detection. For half a century, the mechanism underlying this dark noise has remained controversial. We report here a quantitative relation between a pigment’s photoactivation energy and its peak-absorption wavelength, λmax. Using this relation and assuming that pigment activations by light and heat go through the same ground-state isomerization energy barrier, we can predict the relative noise of diverse pigments with multi–vibrational-mode thermal statistics. The agreement between predictions and our measurements strongly suggests that pigment noise arises from canonical isomerization. The predicted high noise for pigments with λmax in the infrared presumably explains why they apparently do not exist in nature.
Our visual system has an extremely high sensitivity to light under dark-adapted conditions (1). This feat requires a photo-transduction mechanism with high amplification (2) and a thermally quiet visual pigment for minimizing noise. Thermal energy is a double-edged sword: It extends the spectral sensitivity of a pigment to long wavelengths by overcoming the energy deficit of a long-wavelength photon to drive pigment excitation (3-6), but it also triggers pigment activation occasionally in darkness to produce noise (7). More than 50 years ago, Barlow (8) proposed that pigments with longer peak-absorption wavelengths (λmax) are noisier and thus less suitable for dim-light detection. Although qualitatively validated (9-14), Barlow’s seminal hypothesis lacks a mechanistic underpinning. First, no prior relation exists between λmax and thermal activation, which impedes any quantitative prediction of pigment noise. Second, controversy continues about whether the pigment noise originates from an isomerization reaction and, if so, whether it is canonical isomerization (i.e., governed by the same ground-state isomerization energy barrier as in photoisomerization) (15-17). Finally, despite the rhodopsin noise measured long ago (7), noise measurements for cone pigments have begun to emerge only recently (10, 11, 13, 14), thus making any comprehensive pigment-noise theory untestable until now. We report here final success in understanding this fundamental problem in vision.
The involvement of thermal energy in pigment excitation by long-wavelength photons is implicit in the characteristic descent of a pigment’s spectrum at such wavelengths (3-5) and is directly revealed by an increase in relative absorption of these photons at a higher temperature (6). From the critical wavelength (λc) above which a temperature effect begins to appear, the photoactivation energy, , can be obtained (fig. S1) (18). In this way, Ala-Laurila et al. (19, 20) have used microspectrophotometry and electroretinography to show that an change is well correlated with a λmax shift produced by a chromophore switch from 11-cis-retinal (A1) to 11-cis-3-dehydroretinal (A2) in a pigment (18), but that this correlation is otherwise weak across pigments with different opsins. We reexamined this question, with themore precise suction-pipette recording (18), on diverse rod and cone pigments spanning phyla and A1 and A2 chromophores.
Figure 1A shows flash responses from dissociated goldfish red-, green- and blue-sensitive cones. Fitting their action spectra (Fig. 1B) with the A2-pigment spectral template (21) gave λmax values of 620, 537, and 447 nm, respectively. When logarithmic normalized sensitivity (i.e., response per incident photon) was plotted against reciprocal normalized wavelength (λmax/λ), the three spectral-sensitivity curves superposed well and showed a linear descent toward long wavelengths (Fig. 1B, inset), consistent with previous work (3-5, 22). Raising the temperature increased the relative sensitivity at long wavelengths, but not near λmax or at shorter wavelengths (Fig. 1C) (18). From the difference in sensitivity between the two temperatures plotted against λmax/λ (Fig. 1D) (19, 23), we obtained, by interpolation, a λmax/λc ratio of 0.843, 0.826, and 0.838, respectively, for the three cone types. The same experiment on Bufo and larval salamander red rods, as well as mouse rods, gave a λmax/λc ratio of 0.843, 0.830, and 0.840, respectively (Fig. 2, A and B) (18). We also measured mouse S [ultraviolet (UV)–sensitive] cone pigment, which has an unusual, unprotonated Schiff base (24) and thus potentially different photoisomerization energetics. Because a UV pigment is typically coexpressed in native coneswith a longer-λmax pigment (25, 26), we used an engineered mouse line in which the rods express only the UV cone pigment (18, 27). Again, we found a λmax/λc value of 0.841 (Fig. 2C).
Fig. 1.
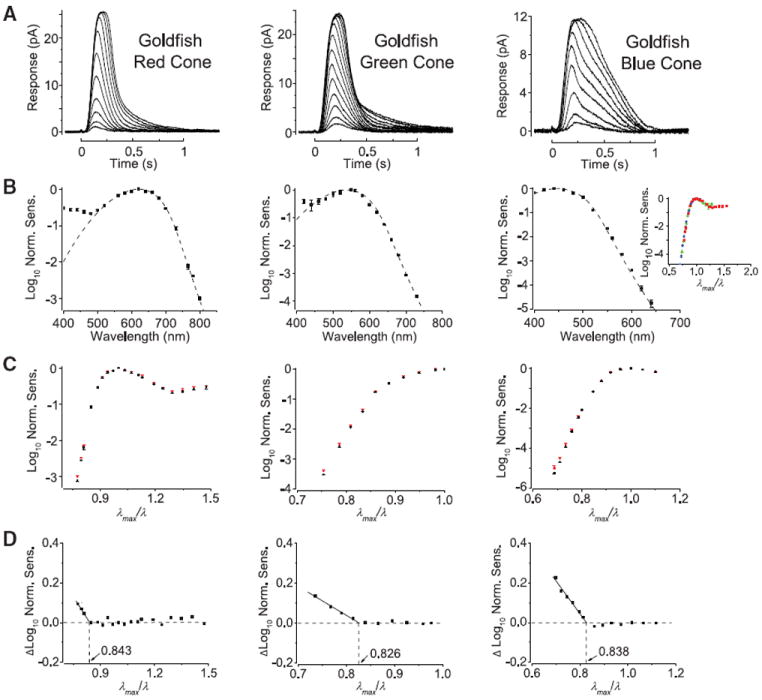
Effect of temperature on spectral sensitivity of goldfish cone pigments. (A) Flash responses from a single cell (averaged responses, 10-msec flash at time zero, 23°C). (B) Logarithmic normalized sensitivity [obtained from dim-flash responses as illustrated in (A)] plotted against wavelength. Average ± SEM (8, 6, and 5 cells, respectively); the SEMs were too small to be discernible at most wavelengths. The dotted curves are fits with the A2 pigment spectral template (21) with λmax of 620, 537, and 447 nm, respectively. The inset at right is an overlay of the three action spectra (with colors corresponding to respective cone types), plotted in this case against the reciprocal of normalized wavelength (λmax/λ), to show the common shape (5, 22). (C) Logarithmic normalized sensitivity plotted against λmax/λ at two temperatures. Average T SEM. Cold temperature (black) was 14°C for red- (7 cells), 13°C for green- (11 cells) and 13°C for blue-sensitive cones (12 cells). Warm temperature (red) was 28°C for all three cone types (8, 7, and 8 cells, respectively). (D) Difference in logarithmic sensitivity against λmax/λ between the two temperatures calculated from (C). Horizontal dashed line represents essentially no temperature dependence. Linear regression from the temperature dependence at long wavelengths (solid line) intersects the horizontal line at 0.843, 0.826, and 0.838, respectively.
Fig. 2.
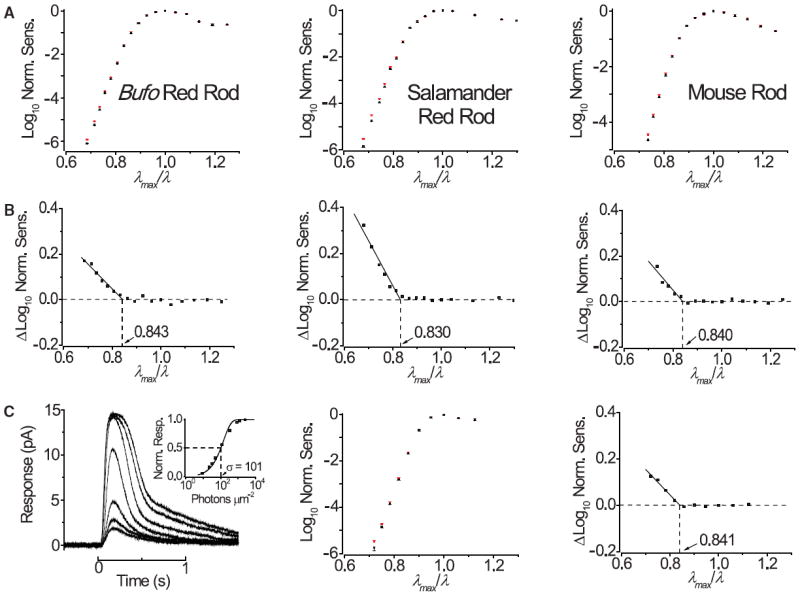
Effect of temperature on spectral sensitivity of rhodopsins and S (UVsensitive) cone pigment. (A) Temperature effects on the action spectra of the three rhodopsins, displayed in same format as in Fig. 1C. Cold temperature (black) was 14°C for Bufo (9 cells), 13°C for salamander (11 cells), and 25°C for mouse (8 cells). Warm temperature (red) was 25°C (10 cells), 25°C (11 cells), and 37.5°C (9 cells), respectively. (B) Difference spectrum between the two temperatures obtained from (A), giving λmax/λc of 0.843, 0.830, and 0.840, respectively. (C) Temperature effect on the action spectrum of mouse S cone pigment. (Left) Flash responses of a transgenic mouse rod expressing S cone pigment but no rhodopsin. (Left inset) Corresponding normalized flash response-intensity relation, with the curve being R/Rmax=1 − exp(−IF/K), where R and Rmax are response and saturated response, respectively, IF is flash intensity, and K is a sensitivity constant. Half-saturating flash intensity, σ, is 101 photons μm−2 (360 nm). (Middle) Temperature effect on spectrum. Same format as in (A), with temperatures at 37.5°C (red, 8 cells) and 25°C (black, 13 cells). (Right) Difference spectrum between the two temperatures, giving λmax/λc of 0.841.
From the above data, the mean λmax/λc value is 0.837 (± 0.007, SD). Separately, a λmax/λc of 0.842 (± 0.009, SD) (table S1) was obtained by directly estimating (hence λc) from the same data (18). The overall mean λmax/λc from both methods is 0.84. Thus, (h, Planck’s constant; c, speed of light), regardless of whether it is an A1 or A2, a UV-or non-UV–sensitive, or a rod or cone pigment. This general relation allows us to deduce for any pigment of known λmax. The constancy of λmax/λc no doubt contributes to the stereotypic descent of the action spectra at long wavelengths when plotted against λmax/λ (Fig. 1B, inset).
To predict the thermal noise of visual pigments, we adhered to the parsimonious notion that thermal activation reflects canonical isomerization of the pigment—that is, it is dictated by the same ground-state energy barrier for isomerization, , as in photoisomerization (fig. S2). We adopted the following statistical-mechanical distribution (6, 28-30)
| (1) |
which describes a pigment molecule’s probability, , of having relevant thermal energy , and thus being able to isomerize thermally. Here, R is the universal gas constant, T is absolute temperature, and m is the number of molecular vibrational modes contributing thermal energy to pigment activation (18). The Boltzmann distribution, , corresponds to the special case of m = 1 in Eq. 1, and, strictly speaking, applies only to an ideal gas. Equation 1 is thus a more general distribution, allowing the possibility of thermal energy coming from multiple vibrational modes in a complex molecule but without requiring knowledge of the molecular details of the modes or the nature of their energy transfer. is an unknown but should be >35 kcal mol−1 for rhodopsin [~40 kcal mol−1 or more (31-34)], because an early photoisomerized state, bathorhodopsin, is already at ~35 kcal mol−1 above dark rhodopsin (fig. S2) (31). We let , where α is a proportionality constant ≤ 1; the initial possibility of α > 1 (31) has been disfavored (32-34).
We began calculations with α = 1; thus, . For rhodopsin with λmax = 500 nm, we obtain kcal mol−1. Previously, an apparent thermal activation energy [ ] of 21.9 kcal mol−1 was found for rhodopsin (7), based on the Arrhenius equation, in which the Boltzmann distribution is implicit. This discrepancy between the and values has prompted the suggestion (15-17) that thermal activation somehow bypasses the energy barrier associated with photoisomerization. This ad hoc assumption becomes unnecessary with m > 1 in Eq. 1. The m value can be obtained from the relation (6, 28, 29), giving m = 45 at 23°C (18). This m value is nominal, based on each vibrational mode of the molecule contributing a nominal energy of kT (where Boltzmann’s constant k = R/NA, with NA as Avogadro’s number).
With Eq. 1, we predicted the relative thermal noise rates for diverse pigments at 23°C (our reference temperature) by using the respective values calculated from their λmax values, as described above, and keeping m = 45 across pigments because their chromophore is essentially the same, whether A1 or A2. The absolute rate is given by , where A is the preexponential factor (35) representing the frequency of spontaneous-activation attempts by the molecule. We began with A being the same for all pigments, but let the comparison with measurements indicate otherwise. Thus, the predicted thermalrate ratio between two pigments is simply their ratio. Five pairwise comparisons were made, allowing us to: (i) examine the change in pigment noise due to an A1/A2-chromophore switch, (ii) compare rod and cone pigments containing the same chromophore, and (iii) cover pigments across the full visible spectrum. Consistent with Barlow’s hypothesis (8), a longer λmax is indeed associated with a higher predicted noise rate constant (Table 1).
Table 1.
Comparison between theoretical predictions and measurements of relative thermal-activation rate constants of visual pigments. For theoretical predictions, see text. For experimental measurements, Bufo red rods and green rods were at 23°C (this study), Xenopus rods [wild type (WT) and transgenics expressing human red cone pigment] were at 21° to 23°C (11), and mouse rods (WT and transgenics expressing human red cone pigment) were at 37°C (14) and 29°C (this study) and were extrapolated to 23°C, as described in (18) and fig. S4. This extrapolation is not perfect because of margins of error in the measured thermal rates. This issue, together with the approximations in cell dimensions (table S5) and λmax determinations, may explain the order-of-magnitude discrepancy between the rate constants for Bufo red rod and mouse rod (both with A1-rhodopsin) at 23°C. In principle, the two values would be expected to be identical according to our theory.
| Cell/pigment | λmax (nm) | (kcal mol−1) |
|
Predicted rate-constant ratio | Measured rate constant (s−1) | Measured rate-constant ratio | ||
|---|---|---|---|---|---|---|---|---|
| Bufo red rod/A1 Bufo rhodopsin | 500 | 48.03 | 3.65 × 10⁻⁶ |
|
4.18 × 10⁻¹² |
|
||
| Xenopus rod/A2 Xenopus rhodopsin | 521 | 46.10 | 1.67 × 10⁻⁵ | 3.70 × 10⁻¹¹ | ||||
| Transgenic mouse rod/A1 human red cone pigment | 557 | 43.12 | 1.52 × 10⁻⁴ |
|
4.14 × 10⁻⁸ |
|
||
| Transgenic Xenopus rod/A2 human red cone pigment | 617 | 38.93 | 2.44 × 10⁻³ | 6.70 × 10⁻⁷ | ||||
| Mouse rod/A1 mouse rhodopsin | 500 | 48.03 | 3.65 × 10⁻⁶ |
|
6.64 × 10⁻¹¹ |
|
||
| Transgenic mouse rod/A1 human red cone pigment | 557 | 43.12 | 1.52 × 10⁻⁴ | 4.14 × 10⁻⁸ | ||||
| Xenopus rod/A2 Xenopus rhodopsin | 521 | 46.10 | 1.67 × 10⁻⁵ |
|
3.70 × 10⁻¹¹ |
|
||
| Transgenic Xenopus rod/A2 human red cone pigment | 617 | 38.93 | 2.44 × 10⁻³ | 6.70 × 10⁻⁷ | ||||
| Bufo green rod/A1Bufo blue cone pigment | 432 | 55.59 | 5.17 × 10⁻⁹ |
|
9.39 × 10⁻¹⁴ |
|
||
| Bufo red rod/A1 Bufo rhodopsin | 500 | 48.03 | 3.65 × 10⁻⁶ | 4.18 × 10⁻¹² |
Considering that is a more plausible situation (32-34), we repeated the above calculations with α < 1 (within a realistic range) in —thus, m < 45—but we found the ratios to be hardly affected (table S2).
We compared the above predictions (α= 1) with direct measurements, either previous measurements or new ones—all based on individually resolvable spontaneous events (measured electro-physiologically) for reliability (Table 1, but see also table S3). We repeated some measurements for consistency or for extrapolating them to 23°C (figs. S3 to S5) (18). We also measured the thermal noise of blue-cone pigment, naturally expressed in amphibian “green rods” besides blue cones (figs. S6 and S7) (18). Figure 3A shows sample responses of a Bufo green rod to repeated, identical dim flashes (440 nm), with the flash intensity sufficiently dim to elicit no response in most trials, thus allowing individual single-photon responses to be observed. The successful responses were quantized (Fig. 3B), with a unit amplitude of ~1 pA and an amplitude histogram matching the Poisson distribution as expected (Fig. 3C, dashed profile) (18). The green rod was rather quiet in darkness (Fig. 3D), but dim steady light elicited events similar to the single-photon responses (Fig. 3, E and F), indicating that the dark quiescence reflected low spontaneous activity instead of undetectably small events. In altogether 830 min of dark recordings from 42 cells, we observed only 15 events (Fig. 3, G and H) that likewise obeyed Poisson statistics over all cells (Fig. 3I) (18). These values gave an average spontaneous rate of 0.00031 s−1 cell−1, which is literally at the lower limit of measurement. A previous estimate from salamander blue cones with indirect noise analysis only limited the rate to <2 s−1 cell−1 (10), whereas an early report (36) on Bufo green rods inexplicably gave a rate of 0.065 s−1 cell−1, a value that is 200-fold higher than what we report here (table S3). Correlating the rate trend with λmax, we expect the mouse UV pigment to be too quiet for noise measurement, as appears to be the case (27).
Fig. 3.
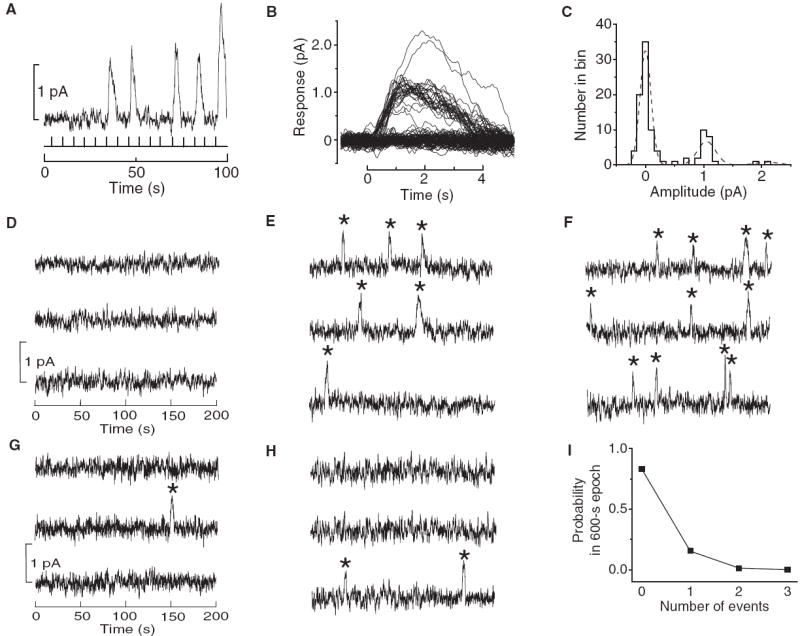
Thermal pigment activity in blue-cone pigment (Bufo green rod). (A to C) Single-photon–response analysis. (A) Sample responses from 100 identical dim-flash trials (440 nm). Flash timings are indicated by vertical bars at bottom. (B) All 100 dim-flash responses superposed, showing quantized amplitudes. 10-msec flashes were centered at time zero. (C) Amplitude histogram from (B) measured at the transient peak of the averaged response. Bin-width is 0.1 pA. The dashed curve is a fit with the Poisson distribution blurred by Gaussian functions [eq. S3 in (18)], with a mean single-photon–response amplitude of 1.1 pA. (D) 10-min dark continuous recording from a different cell. (E and F) 10-min recordings from the same cell as in (D), with dim steady light of 5.36 × 10⁻⁴ and 1.07 × 10⁻³ photons μm−2 s−1 (440 nm), respectively, expected to give 6 and 12 photoisomerization events, respectively, based on an effective collecting area (41) of 19.1 μm2, calculated from cell dimensions (table S5). These expected numbers closely match the 6 (E) and 11 (F) discrete events marked by stars. (G and H) 10-min dark recordings from two other cells showing one and two spontaneous events, respectively. The latter case is an extremely rare occurrence. (I) Poisson analysis of the dark spontaneous events collected from all cells (see text). The probability of zero, one, two, and three events observed, in a total of 83 trials of 10-min dark recording each, is plotted as the square symbols. The solid line shows the very good fit by the Poisson distribution (18) with a mean event rate of 0.00031 s−1. All recordings in this figure were low-pass filtered at 3 Hz.
From Table 1, the predicted rate ratio between A1 and A2 rhodopsins, as well as that between A1 and A2 red cone pigments, is either equal to or within a factor of 2 of the measured ratios. On the other hand, the predicted rate ratio between A1 rhodopsin and an A1 cone pigment, whether red or blue, underestimates the measured ratio by about one order of magnitude. The simplest explanation would be that the preexponential factor, A, is actually an order of magnitude higher for cone pigments, consistent with their more open chromophore-binding pocket (37-39). After adjusting for this difference (table S4), the remaining prediction/measurement discrepancy (~fivefold) in the comparison between A2 rhodopsin and A2 red cone pigment may stem from a measurement uncertainty and/or minor differences in, for example, m values across pigments. Overall, however, the agreements are substantial. The comparison between A1 blue cone pigment (λmax = 432 nm) and A2 red cone pigment (λmax = 617 nm), which have the largest λmax separation among non-UV visual pigments and cover a ~107-fold difference in rate constants, gives a mere 15-fold discrepancy between prediction and measurement. In contrast, the commonly used Boltzmann distribution gave predictions drastically different from measurements (fig. S8).
Our theory, developed to explain thermal activation of pigments, should also apply to photoactivation at λ > λc, where thermal energy contributes to photoisomerization. Interestingly, with A1 rhodopsin as an example, the spectral template (21) over an experimentally validated 10-log-unit descent at long wavelengths can be described by our theory (18), but requires a very small m value varying between 1 and 4 (Fig. 4A; see similar results for cone pigments in fig. S9). The large difference in m value between photoisomerization and thermal isomerization (nominally ~45, see above) probably reflects different molecular time windows in recruiting vibrational energy. In photoexcitation, only a few vibrational modes can be recruited, presumably due to instantaneous Franck-Condon excitation (35). Thermal activation, on the other hand, has an open time window, happening when, and only when, the requisite energy is recruited from a large number of collaborative vibrational modes. With the high (ground-state isomerization energy barrier), thermal isomerization happens with an exceedingly low probability, thus explaining the low rate constants (Table 1).
Fig. 4.
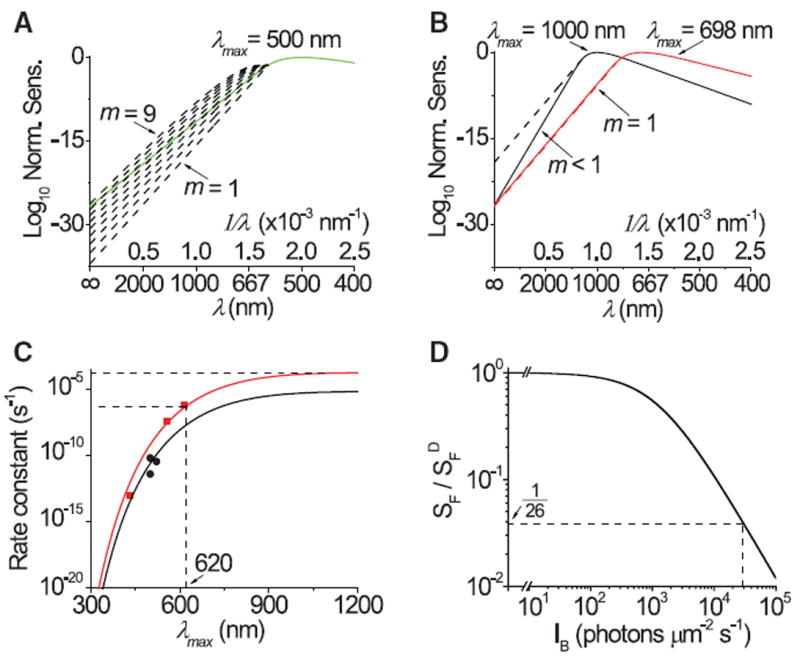
Predictions from our theory. (A and B) Predictions of spectral descent at wavelengths longer than λc. (A) Spectral descent for A1 rhodopsin (λmax = 500 nm) template matches predictions (dashed curves) drawn from eq. S7 (18) with m = 1 through 9. (B) Spectral template for hypothetical A1 pigment with λmax = 698 nm has a long-wavelength descent matching predictions throughout with m = 1, whereas that with λmax = 1000 nm requires predictions with m < 1. Dashed curves (with one completely overshadowed by the red template) are predictions with m = 1. (C and D) Pigment noise prediction and its impact on photosensitivity. (C) Predicted thermal-noise rate constant as a function of λmax (data from Table 1). Black circles, rhodopsins; red squares, cone pigments. Curves are at 23°C, m = 45, with A = 7.19 × 10⁻⁶ s−1 for rhodopsins and 1.88 × 10⁻⁴ s−1 for cone pigments. (D) Effect of thermal activity on photosensitivity. The solid curve denotes the Weber-Fechner relation describing the reduction in flash sensitivity by background light, , where SF and are flash sensitivities in background light of intensity IB and in darkness, respectively. The background intensity (Io) that reduces the sensitivity in darkness by half is 1200 isomerizations per second for salamander red cones (10), used here as a reference. The asymptotic thermal-noise rate for cone pigments from (C) is 29,700 s−1, which would reduce light sensitivity of salamander red cones by 26-fold. In this estimate, we have ignored the relatively low ~200 s−1 noise rate intrinsic to the salamander red cone.
The visual pigment with the longest λmax known so far in nature is the A2 red cone pigment (λmax ~ 620 nm). Is there any physical or biological reason why pigments with longer λmax values are evolutionarily disfavored? On the physical side, Fig. 4B shows a hypothetical A1 pigment template with λmax at 698 nm, the long-wavelength descent of which matches predictions with m = 1 (the Boltzmann limit) (18). Superficially, no pigment can have λmax > 698 nm because no molecule, however small, could have m < 1 (5). For example, a pigment with a hypothetical λmax of 1000 nm would give m < 1 (Fig. 4B). In reality, however, m is a nominal number (see earlier); thus, m < 1 is possible provided that one or more vibrational modes contribute an energy less than the nominal value of kT. Thus, at least in principle, λmax > 698 nm is still physically possible. How about biological considerations? In Fig. 4C, we extrapolate with our theory the measured noise rate constants to hypothetical pigments with λmax values in the infrared. The rate constant for cone pigments approaches an asymptote of ~1.1 × 10⁻⁴ s−1 in the infrared, or 360 times higher than that of the 620-nm A2 red cone pigment. If a pigment with such an asymptotic rate constant were present in a salamander red cone [with ~2.7 × 10⁸ pigment molecules (39)], the noise rate would be 29,700 s−1 cell−1, which would reduce the cell’s already low sensitivity by another 26-fold, according to its adaptation behavior to background light (Fig. 4D) (10). Furthermore, the standard deviation of the background noise would increase by (360)1/2 = 19-fold. Such signaling detriments are undesirable. Perhaps for this reason, the viper pit organ detects infrared radiation with a heat-sensing ion channel rather than a visual pigment (40). For a short-wavelength–sensitive pigment, although its noise literally disappears at λmax < 400 nm (Fig. 4C), nonspecific light absorption by proteins, peaking at ~280 nm, becomes a limiting factor. These considerations probably explain, at least partially, why the λmax values of native visual pigments are confined to the narrow bandwidth of ~360 to 620 nm, limiting color vision accordingly.
In summary, our work strongly suggests that thermal activation of visual pigments, like photoisomerization, involves a canonical isomerization reaction. If not for the discrepancy between the electrophysiological and photochemical measurements on rhodopsin, the inadequacy of Boltzmann statistics (i.e., involving only one vibrational mode) for understanding the thermal behavior of pigments would not have been obvious (for example, within a limited temperature range, Eq. 1 also gives an almost linear relation in an Arrhenius plot, as Boltzmann statistics does; see fig S5). Because all biological molecules, like visual pigments, are polyatomic and thus have many vibrational modes, our success here hopefully will stimulate the same approach to other biomolecules.
Supplementary Material
Acknowledgments
This work was supported by a U.S. NIH grant (EY06837) and the António Champalimaud Vision Award (Portugal) to K.-W.Y and a grant (123231) from the Academy of Finland to P.A.-L. We thank R. S. Molday and J.-X. Ma for the antibodies against rhodopsin and blue cone pigment, respectively; J. Chen for the transgenic mouse line expressing mouse S-cone opsin in the rods; X. Lin for mathematical help; M. T. H. Do for critique; T. Xue and Y. P. Wang for computational help; and V. S. Batista, R. R. Birge, P. J. Dagdigian, T. Ebrey, B. Honig, M. Karplus, J. E. Kim, B. E. Knox, C. L. Makino, R. A. Mathies, J. Nathans, T. P. Sakmar, J. L. Schnapf, K. Schulten, T. G. Wensel, T. B. Woolf, and E. C. Y. Yan for discussions. D.-G.L. and K.-W.Y. designed the experiments, did the data analysis, developed the theory, and wrote the paper; D.-G.L. performed all of the electrophysiological experiments; W.W.S.Y did the retinal immunolabeling and participated in the measurement of thermal activity of Bufo red rods as well as writing; and P.A.-L. contributed to the theory and participated in discussion.
Footnotes
Supporting Online Material
www.sciencemag.org/cgi/content/full/332/6035/1307/DC1
Materials and Methods
Figs. S1 to S9
Tables S1 to S5
References
References and Notes
- 1.Hecht S, Shlaer S, Pirenne MH. J Gen Physiol. 1942;25:819. doi: 10.1085/jgp.25.6.819. [DOI] [PMC free article] [PubMed] [Google Scholar]
- 2.Luo DG, Xue T, Yau K-W. Proc Natl Acad Sci U S A. 2008;105:9855. doi: 10.1073/pnas.0708405105. [DOI] [PMC free article] [PubMed] [Google Scholar]
- 3.Goodeve CF. Proc R Soc London Ser A. 1936;155:664. [Google Scholar]
- 4.Stiles WS. Transactions of the Optical Convention of the Worshipful Company of Spectacle Makers. Spectacle Makers’ Company; London: 1948. pp. 97–107. [Google Scholar]
- 5.Lamb TD. Vision Res. 1995;35:3083. doi: 10.1016/0042-6989(95)00114-f. [DOI] [PubMed] [Google Scholar]
- 6.St. George RCC. J Gen Physiol. 1952;35:495. doi: 10.1085/jgp.35.3.495. [DOI] [PMC free article] [PubMed] [Google Scholar]
- 7.Baylor DA, Matthews G, Yau K-W. J Physiol. 1980;309:591. doi: 10.1113/jphysiol.1980.sp013529. [DOI] [PMC free article] [PubMed] [Google Scholar]
- 8.Barlow HB. Nature. 1957;179:255. doi: 10.1038/179255b0. [DOI] [PubMed] [Google Scholar]
- 9.Donner K, Firsov ML, Govardovskii VI. J Physiol. 1990;428:673. doi: 10.1113/jphysiol.1990.sp018234. [DOI] [PMC free article] [PubMed] [Google Scholar]
- 10.Rieke F, Baylor DA. Neuron. 2000;26:181. doi: 10.1016/s0896-6273(00)81148-4. [DOI] [PubMed] [Google Scholar]
- 11.Kefalov V, Fu Y, Marsh-Armstrong N, Yau K-W. Nature. 2003;425:526. doi: 10.1038/nature01992. [DOI] [PMC free article] [PubMed] [Google Scholar]
- 12.Ala-Laurila P, Donner K, Crouch RK, Cornwall MC. J Physiol. 2007;585:57. doi: 10.1113/jphysiol.2007.142935. [DOI] [PMC free article] [PubMed] [Google Scholar]
- 13.Sakurai K, et al. J Gen Physiol. 2007;130:21. doi: 10.1085/jgp.200609729. [DOI] [PMC free article] [PubMed] [Google Scholar]
- 14.Fu Y, Kefalov V, Luo D-G, Xue T, Yau K-W. Nat Neurosci. 2008;11:565. doi: 10.1038/nn.2110. [DOI] [PMC free article] [PubMed] [Google Scholar]
- 15.Barlow RB, Birge RR, Kaplan E, Tallent JR. Nature. 1993;366:64. doi: 10.1038/366064a0. [DOI] [PubMed] [Google Scholar]
- 16.Sampath AP, Baylor DA. Biophys J. 2002;83:184. doi: 10.1016/S0006-3495(02)75160-6. [DOI] [PMC free article] [PubMed] [Google Scholar]
- 17.Lórenz-Fonfría VA, Furutani Y, Ota T, Ido K, Kandori H. J Am Chem Soc. 2010;132:5693. doi: 10.1021/ja907756e. [DOI] [PubMed] [Google Scholar]
- 18.Materials and methods are available as supporting material on Science Online.
- 19.Ala-Laurila P, Albert R-J, Saarinen P, Koskelainen A, Donner K. Vis Neurosci. 2003;20:411. doi: 10.1017/s0952523803204065. [DOI] [PubMed] [Google Scholar]
- 20.Ala-Laurila P, Pahlberg J, Koskelainen A, Donner K. Vision Res. 2004;44:2153. doi: 10.1016/j.visres.2004.03.031. [DOI] [PubMed] [Google Scholar]
- 21.Govardovskii VI, Fyhrquist N, Reuter T, Kuzmin DG, Donner K. Vis Neurosci. 2000;17:509. doi: 10.1017/s0952523800174036. [DOI] [PubMed] [Google Scholar]
- 22.Mansfield RJW. In: The Visual System. Fein A, Levine JS, editors. Alan Liss; New York: 1985. pp. 89–106. [Google Scholar]
- 23.Ala-Laurila P, Saarinen P, Albert R, Koskelainen A, Donner K. Vis Neurosci. 2002;19:781. doi: 10.1017/s0952523802196088. [DOI] [PubMed] [Google Scholar]
- 24.Dukkipati A, et al. Biochemistry. 2002;41:9842. doi: 10.1021/bi025883g. [DOI] [PubMed] [Google Scholar]
- 25.Makino CL, Dodd RL. J Gen Physiol. 1996;108:27. doi: 10.1085/jgp.108.1.27. [DOI] [PMC free article] [PubMed] [Google Scholar]
- 26.Nikonov SS, Kholodenko R, Lem J, Pugh EN., Jr J Gen Physiol. 2006;127:359. doi: 10.1085/jgp.200609490. [DOI] [PMC free article] [PubMed] [Google Scholar]
- 27.Shi G, Yau K-W, Chen J, Kefalov VJ. J Neurosci. 2007;27:10084. doi: 10.1523/JNEUROSCI.2211-07.2007. [DOI] [PMC free article] [PubMed] [Google Scholar]
- 28.Ala-Laurila P, Donner K, Koskelainen A. Biophys J. 2004;86:3653. doi: 10.1529/biophysj.103.035626. [DOI] [PMC free article] [PubMed] [Google Scholar]
- 29.Hinshelwood CN. The Kinetics of Chemical Change. Clarendon Press; Oxford: 1940. pp. 39–79. [Google Scholar]
- 30.Holbrook KA, Pilling MJ, Robertson SH. Unimolecular Reactions. 2. Wiley; Chichester, UK: 1996. pp. 1–38. [Google Scholar]
- 31.Cooper A. Nature. 1979;282:531. doi: 10.1038/282531a0. [DOI] [PubMed] [Google Scholar]
- 32.Birge RR. Biochim Biophys Acta. 1990;1016:293. doi: 10.1016/0005-2728(90)90163-x. [DOI] [PubMed] [Google Scholar]
- 33.Okada T, Ernst OP, Palczewski K, Hofmann KP. Trends Biochem Sci. 2001;26:318. doi: 10.1016/s0968-0004(01)01799-6. [DOI] [PubMed] [Google Scholar]
- 34.Mathies RA. Novartis Found Symp. 1999;224:70. doi: 10.1002/9780470515693.ch6. discussion 84. [DOI] [PubMed] [Google Scholar]
- 35.Atkins P, de Paula J. Physical Chemistry. 8. Freeman; New York: 2006. [Google Scholar]
- 36.Matthews G. J Physiol. 1984;349:607. doi: 10.1113/jphysiol.1984.sp015176. [DOI] [PMC free article] [PubMed] [Google Scholar]
- 37.Matsumoto H, Tokunaga F, Yoshizawa T. Biochim Biophys Acta. 1975;404:300. doi: 10.1016/0304-4165(75)90337-2. [DOI] [PubMed] [Google Scholar]
- 38.Crescitelli F. Vision Res. 1984;24:1551. doi: 10.1016/s0042-6989(84)80004-8. [DOI] [PubMed] [Google Scholar]
- 39.Kefalov VJ, et al. Neuron. 2005;46:879. doi: 10.1016/j.neuron.2005.05.009. [DOI] [PMC free article] [PubMed] [Google Scholar]
- 40.Gracheva EO, et al. Nature. 2010;464:1006. doi: 10.1038/nature08943. [DOI] [PMC free article] [PubMed] [Google Scholar]
- 41.Luo D-G, Yau K-W. J Gen Physiol. 2005;126:263. doi: 10.1085/jgp.200509342. [DOI] [PMC free article] [PubMed] [Google Scholar]
Associated Data
This section collects any data citations, data availability statements, or supplementary materials included in this article.