

Abstract
Endothelial cells (ECs) play a key role to maintain the functionality of blood vessels. Altered EC permeability causes severe impairment in vessel stability and is a hallmark of pathologies such as cancer and thrombosis. Integrating label-free quantitative proteomics data into genome-wide metabolic modeling, we built up a model that predicts the metabolic fluxes in ECs when cultured on a tridimensional matrix and organize into a vascular-like network. We discovered how fatty acid oxidation increases when ECs are assembled into a fully formed network that can be disrupted by inhibiting CPT1A, the fatty acid oxidation rate-limiting enzyme. Acute CPT1A inhibition reduces cellular ATP levels and oxygen consumption, which are restored by replenishing the tricarboxylic acid cycle. Remarkably, global phosphoproteomic changes measured upon acute CPT1A inhibition pinpointed altered calcium signaling. Indeed, CPT1A inhibition increases intracellular calcium oscillations. Finally, inhibiting CPT1A induces hyperpermeability in vitro and leakage of blood vessel in vivo, which were restored blocking calcium influx or replenishing the tricarboxylic acid cycle. Fatty acid oxidation emerges as central regulator of endothelial functions and blood vessel stability and druggable pathway to control pathological vascular permeability.
Endothelial cells (ECs)1 line the inner layer of the blood vessel wall and constitute a barrier between blood and surrounding tissue. As such, a tight regulation of EC permeability is crucial to maintain vessel functionality and avoid excessive extravasation of fluid and plasma proteins (1). Increased endothelial permeability is typical in inflammatory states and a hallmark of diseases such thrombosis, atherosclerosis, and cancer (2, 3). Because of their unique localization, ECs are constantly exposed to oxygen and nutrients that fuel cell metabolism and whose levels vary in physiological and pathological conditions. Yet, how cell metabolism regulates endothelial permeability remains incompletely understood.
Previous studies have reported that EC cultures use glucose as predominant source of energy by producing lactate through glycolysis. However, also fatty acids and glutamine contribute to ATP and metabolic intermediate production (4–7). Recent in vivo studies have shown that glycolysis is necessary for EC proliferation and motility in physiological and pathological angiogenesis (4, 8). Moreover, the peroxisome proliferator-activated receptor gamma coactivator 1-α, which can activate oxidative phosphorylation, blocks EC sprouting in diabetes (9). The intriguing information emerging from these studies is that key metabolic pathways, such as glycolysis and oxidative phosphorylation in the mitochondria, play an important role in ECs and that they are actively involved in the regulation of key cell functions.
Mitochondrial fatty acid oxidation (FAO) is the process that converts fatty acids (FAs) into acetyl-CoA, which fuels the tricarboxylic acid cycle (TCAc) and generates reducing factors for producing ATP via oxidative phosphorylation. Cells can incorporate FAs from the culture media or can generate FAs from the hydrolysis of triglycerides or through de novo synthesis. FAs, then, can access the mitochondria according to their length; whereas short and medium-chain FAs (up to 12 carbon atoms) diffuse through the mitochondrial membrane, long-chain FAs (with 13–21 carbon atoms) are actively transported by the carnitine O-palmitoyl transferase (CPT) proteins, which are rate-limiting enzymes for this pathway (10). Previous work suggested that FAO is poorly utilized by EC cultures (4), however, under certain stress conditions such as glucose deprivation, FAO becomes a major source of energy (7). Although it is striking to note how cells can adapt and remodel their metabolism, the role of key FAO enzymes in the control of EC functions is still largely unclear.
Because of the complexity of the cell metabolome, global-scale metabolomic studies for in depth and quantitative analysis of metabolic fluxes are still challenging and computational models have provided invaluable help to better understand cell metabolism. Among them, the integrative metabolic analysis tool (iMAT), which integrates gene expression data with genome-scale metabolic network model (GSMM), has been successfully used to predict enzyme metabolic flux in several model systems and diseases (11, 12). Because gene expression and protein levels do not always correlate, and because enzymes levels do not necessarily reflect their enzymatic activity or the flux of the reaction that they are involved in, iMAT uses expression data as cue for the likelihood, but not final determinant, of enzyme activity. Modern MS technology and robust approaches for protein quantification, such as stable-isotope labeling with amino acids in cell culture (SILAC) (13) and advanced label-free algorithms (14), allow global comparative proteomic analysis and accurate measurements of protein and post-translational modification levels (15). We reasoned that the integration of quantitative MS-proteomic data into GSMM could contribute to the study of cell metabolism. Moreover, metabolic changes trigger activation of protein kinases (16, 17) to rapidly remodel the intracellular signaling and enable cells to adapt to these sudden alterations. Protein phosphorylation therefore plays an important role in regulating cell response to metabolic alteration and may hide information on cellular pathways and functions controlled by specific metabolic activities. MS-based proteomic approaches therefore offer an additional opportunity to investigate in an unbiased manner the interplay between cell metabolism and cell function (18).
We have previously shown (19) that when human primary ECs are cultured for 1 day on the three-dimensional matrix matrigel and assemble into a complex network, a simplified model that recapitulates some aspects of vascular network assembly in vivo (20), the levels of metabolic enzymes are profoundly regulated. This result suggested an interplay between cell metabolism and EC behavior. Here we investigate further this aspect. Integrating label-free quantitative MS-proteomics, predictive metabolic modeling and metabolomics we discovered increased FAO when ECs are assembled into a fully formed network. Moreover, by inhibiting CPT1 pharmacologically, we elucidated that FAO is a central regulator of EC permeability in vitro and blood vessel stability in vivo. Thus, proteomics significantly contributes to the study of cell metabolism and here we identified FAO as a promising target for therapeutic intervention for the control of pathological vascular permeability.
EXPERIMENTAL PROCEDURES
Cells, Reagents, and Treatments
Human umbilical vein endothelial cells (HUVECs) isolated from 2–5 umbilical cords were pooled and cultured in EGM-2 (Lonza, Basel, Switzerland). For the SILAC labeling, cells were grown for three passages (P) in custom EGM-2 without arginine and lysine (Lonza) supplemented with l-arginine and l-lysine (SILAC light) (Sigma-Aldrich, St. Louis, MO), 13C6 l-arginine and D4 l-lysine (SILAC medium) or 13C615N4 l-arginine, and 13C615N2 l-lysine (SILAC heavy) (Cambridge Isotope Laboratories, Tewksbury, MA). BOECs were kindly provided by Dr. Maartje van den Biggelaar and cultured in EGM-2 medium 10% FBS. Cells were used between P2 and P6.
If not otherwise stated, after 2 h etomoxir treatment (15 μg/ml) cells were treated or not with pyruvate (500 μm) for 30 min followed by dichloroacetate (5 mm) for 30 min before cells were used in experiments.
Etomoxir, oxfenicine, dichloroacetate, pyruvate, thrombin, VEGF, and mouse anti-vinculin antibody were from Sigma-Aldrich; anti-CPT1A antibody (15184–1-AP) was from Protein Tech group (Chicago, IL); anti-β-tubulin was from Santa Cruz Biotechnology (Dallas, TX), anti-phospho ACACA was from Cell Signaling (Danvers, MA); anti-mouse IRDye 700CW, and anti-rabbit IRDye 800CW used for Western blot were from LI-COR Biosciences (Lincoln, NE). Matrigel and Cell recovery solution were from BD biosciences (Franklin Lakes, NJ).
Matrigel Assay
HUVECs were seeded and cultured on solidified Matrigel in EGM-2 medium with the indicated stimuli and harvested for MS analysis using Cell recovery solution according to manufacturer's instructions and as previously described (19). Pictures were taken with Axiovert microscope and the tubule length measured with ImageJ software.
Sample Preparation for Proteomic Analysis
HUVECs were lysed in 2% SDS and 100 mm Tris-HCl pH 7.4 buffer.
Proteome Matrigel
Proteins were precipitated and solubilized in 8 m urea, 75 mm NaCl and 50 mm TrisHCl. After reduction with dithiothreitol and alkylation with iodoacetamide, proteins were digested with trypsin. Proteome etomoxir: Light, medium, and heavy SILAC-labeled cell lysates (∼70 μg/sample) were mixed in equal amount, trypsin digested by filter-aided sample preparation (FASP) method (22) and 50 μg of peptides fractionated into six fractions using on-tip strong anion exchange chromatography (21).
Phosphoproteome
Light, medium, and heavy SILAC-labeled cell lysates (∼3 mg/sample) were mixed in equal amount, digested using FASP and peptides were fractionated using strong cation exchange chromatography followed by titanium dioxide enrichment (23) for phosphorylated peptides as previously described (24).
Digested peptides were de-salted with Empore-C18 StageTips (25), eluted in 80% acetonitrile (ACN), 0.5% acetic acid, and stored at −80 °C until MS analysis.
Proteomic MS Analysis
Tryptic peptides were separated on 20 cm fused silica emitter (New Objective, Woburn, MA) packed in-house with the reverse phase ReproSil-Pur C18-AQ, 1.9 μm resin (Dr. Maisch, GmbH, Ammerbuch-Entringen, Germany) and analyzed on a LTQ-Orbitrap Elite (Thermo Fisher Scientific) coupled on-line with a nano-HPLC (Easy nLC, Thermo Fisher Scientific).
Proteome Matrigel
For each sample, ∼2 μg of digested peptides were eluted from reverse phase column with a flow of 200 nl/min in 190 min gradient, from 5% to 30% ACN in 0.5% acetic acid. For each time point three replicates were performed and each replicate was run at the MS twice.
Proteome Etomoxir
For each fraction, half of the peptides were loaded onto reverse phase column and eluted with a flow of 200 nl/min in 190 min gradient, from 5% to 30% ACN in 0.5% acetic acid. Triplicate experiments were performed swapping SILAC labeling conditions.
Phosphoproteome
For each experiment, 10 fractions enriched for phosphorylated peptides were analyzed at the MS. Two thirds of each sample was loaded onto reverse phase column and eluted with a flow of 200 nl/min in 90 min gradient, from 5% to 30% ACN in 0.5% acetic acid. The remaining 1/3 was pooled into two fractions that were analyzed at the MS. Triplicate experiments were performed swapping SILAC labeling conditions.
MS spectra were acquired in the Orbitrap analyzer at a resolution of 120,000 at 400 m/z, and a target value of 106 charges. High collision dissociation fragmentation of the 10 most intense ions was performed using a target value of 40,000 charges and acquired in the Orbitrap at resolution 15,000 at 400 m/z. Data were acquired with Xcalibur software. MS data were processed using the MaxQuant software (26) and searched with Andromeda search engine (27) against the human UniProt database (release-2012 01, 81,213 entries). An initial maximal mass deviation of 7 ppm and 20 ppm was required to search for precursor and fragment ions, respectively. Trypsin with full enzyme specificity and peptides with a minimum length of seven amino acids were selected. Two missed cleavages were allowed. Oxidation (Met) and N-acetylation were set as variable modifications, as well as phospho(STY) for the phosphoproteome analysis, whereas Carbamidomethylation (Cys) as fixed modification. False discovery rate (FDR) of 1% was used for peptides, proteins and phosphopeptides identification. For the phosphosites, a minimum Andromeda phosphopeptides score of 40 was required, as previously described (28).
Proteomic Data Analysis
Proteome Matrigel
Peptides and proteins were quantified according to the MaxLFQ algorithm of MaxQuant (14) version 1.4.1.0. Only proteins uniquely identified with minimum one unique peptide and quantified in at least three MS runs were used for the analysis.
Proteome Etomoxir
The relative quantification of the proteins against their labeled counterpart was performed by MaxQuant (14) version 1.5.0.36. Only proteins identified with minimum one unique peptide and quantified with a minimum of two ratio counts were used for the analysis. Proteins were considered up-regulated if the SILAC ratio was higher than 0.3 (log2 scale), which was more than one standard deviation from the mean of the all calculated ratios, in a minimum of two replicates.
Phosphoproteome
The relative quantification of the phosphorylation sites against their labeled counterpart was performed by MaxQuant (14) version 1.4.1.6. Only class I sites (= sites accurately localized with localization probability > 0.75 and score difference > 5) were used for the analysis. Phosphorylation sites were considered up-regulated if the SILAC ratio was higher than 0.4 (log2 scale), which was more than one standard deviation from the mean of the all calculated ratios, in a minimum of two replicates. For the NetworKIN analysis (29), for each phosphorylation site only the predicted kinase with highest score was considered and we required a minimum NetworKIN score of 1.5. Motif-X analysis was performed using standard parameters, significance of 0.000001 and IPI Human Proteome as background (30). Predicted kinase activity was calculated by means of significantly overrepresented (Fisher test, with 2% FDR) kinase motifs (used “Motifs” column supplemental Table S3 which was generated with Perseus software, based on Human Protein Reference Database (31)) within the 83 up-regulated sites upon etomoxir treatment. The 83 sites were queried against the entire phospho-dataset.
Computational Analysis Using Genome-Scale Metabolic Modeling
Integration of Proteomics Data
Metabolic genes for which protein abundance levels (LFQ) were measured in experiments were mapped to the human genome-scale metabolic model (GSMM) (32). The mean (over three replicas) of protein abundance levels in each time point (i.e. 4 h, 22 h) were used to infer ternary presentation of the abundance levels using “quartile” partitioning. This allowed for integrating 50% of the measured data, such that proteins in the top 25% quartile were labeled “1” (highly abundant), proteins in the down 25% quartile were labeled “−1” (lowly abundant) and the rest were labeled “0” (moderately abundant), in each time point. Based on the GSMM gene-reaction rules, i.e. the logical dependence of each reaction on the activity of the genes associated with it, we infer the ternary state at the reaction level. This ternary representation was used as “cues” (soft constraints) to perform iMAT (11) in each time point. To assess the permissible flux range (i.e. minimal and maximal flux) of each reaction we performed flux-variability analysis (FVA) around the optimal solution that maximizes the agreement between the predicted fluxes and the proteomic measurements. Then, we sampled the solution space using ACHR algorithm and estimated the average flux of each reaction. Fold changes between 22 h and 4 h were derived based on the average fluxes.
The pathway enrichment analysis based on fold change reaction flux between 4h and 22h matrigel (in supplemental Table S2) was performed using the one dimension (1D) annotation enrichment analysis available in the Perseus software (33).
CPT1A Knockout Analysis
To simulate the effect of CPT1A inhibition at 22h we simulated the metabolic state using iMAT twice: once when the reactions associated with CPT1A were active at their maximal flux, and once when they were inhibited, carrying no flux. FVA and sampling (ACHR) of the solution space were performed. Based on the average fluxes of the reactions we estimated the fold change following CPT1A inhibition as: fluxes when CPT1A was inactive/fluxes when CPT1A was active.
Sample Preparation for Metabolomic Analysis
HUVECs were seeded on a solidified matrigel (six well plate, 200 μl/9.6 cm2) in EGM-2 medium. After 3h, 22h, and 30h, cells were washed with PBS, and medium replaced with 1 ml EGM-2, 11 mm 13C6 glucose and 100 μm 12C16 palmitic acid or 11 mm 12C6 glucose and 100 μm 13C16 palmitic acid. After 6h incubation at 37 °C metabolites were extracted as follow from triplicate samples:
Extracellular
Twenty microliters of supernatant were mixed with 980 μl of cold methanol/ACN/water (5:3:2 volumes) extraction buffer, mixed (using a thermo-mixer) for 10 min at 4 °C, and spun 10 min at 16,100 × g at 4 °C. Of the cleared supernatant, 800 μl were stored at −80 °C until MS analysis.
Intracellular
cells were quickly washed with cold PBS and metabolites extracted upon incubation with ∼250 μl of cold extraction buffer for 5 min at 4 °C. Metabolites were then collected and mixed (using a thermo-mixer) for 10 min at 4 °C and spun 10 min at 16,100 × g at 4 °C. Of the cleared supernatant, 200 μl were stored at −80 °C until MS analysis.
Metabolomics MS Analysis
Metabolites were analyzed on an Exactive Orbitrap mass spectrometer (Thermo Fisher Scientific) coupled online with a Accela HPLC system (Thermo Fisher Scientific). The HPLC setup consisted of a ZIC-pHILIC column (150 × 2.1 mm, 5 μm, SeQuant, Merck KGaA), with a ZIC-pHILIC guard column (SeQuant, 20 × 2.1 mm) and an initial mobile phase of 20% 20 mm ammonium carbonate, pH 9.4, and 80% acetonitrile. Of the metabolites extracted from the cells and supernatant, 5 μl were injected and separated over a 30 min mobile phase gradient, decreasing the acetonitrile content to 20%, at a flow rate of 100 μl/min. The total analysis time was 38 min. All metabolites were detected across a mass range of 75–1000 m/z at a resolution of 25,000, at 200 m/z, with electrospray ionization and polarity switching to enable both positive and negative ions to be determined in the same run. Lock masses were used and the mass accuracy obtained for all metabolites was below 5ppm. Data were acquired with Xcalibur software.
Metabolomics Data Analysis
The peak areas (= measured intensity) of different metabolites were determined using LCquan software (Thermo Fisher Scientific) where metabolites were identified by the exact mass of the singly charged ion and by known retention time on the HPLC column. Commercial standards of all metabolites detected had been analyzed previously on the same LC-MS system. The 13C labeling patterns were determined by measuring peak areas for the accurate mass of each isotopolog of many metabolites. The measure intensities of the intracellular metabolites were normalized to the amount of unlabeled intracellular arginine and phenylalanine.
SiRNA
For matrigel and Ca2+ imaging experiments: the day before transfection, HUVECs were seeded in six-well plates at a concentration of 2 × 10⁵ cells/well. Transfection of the siRNA duplexes was performed with Oligofectamine according to the manufacturer's protocol (Invitrogen, Carlsbad, CA). Briefly, cells were transfected with 360 pmol of nontargeting (Dharmacon-GE Healthcare) or luciferase-targeting siRNA as control, or pool or single Stealth Select RNAi for CPT1A: SiCPT1A#1: CCACCAAGAUCUGGAUGGGUAUGGU; SiCPT1A#2: GGACCGGGAGGAAAUCAAACCAAUU (Invitrogen). After 48 h from transfection, cells were used for experiments. For the fibrin in vitro angiogenesis assay and TEER, HUVECs were transfected using the Amaxa Kit (Lonza) according to manufacturer's instruction. After 48h from transfection, cells were used for experiments.
Western blot Analysis
HUVECs were lysed in 2% SDS in 100 mm Tris HCl, pH 7.4. Proteins were separated on NuPAGE 4–12% Bis-Tris gel (Invitrogen) and transferred to PVDF membrane (Millipore). The blots were probed with primary antibodies. Multi-color signals were detected after incubation with secondary antibodies using Odyssey CLx instrument (Li-COR Biosciences, Lincoln, NE). Signals were quantified using Image Studio lite software (LI-COR Biosciences).
Cell Proliferation and Cell Death
Cell proliferation and cell death were assessed using Click-iT EdU kit and Annexin V kit (Invitrogen) according to manufacturer's protocol. Briefly, HUVECs were seeded at a concentration of 360 cells/mm2 in EGM-2 with the indicated concentration of stimuli. After 20 h, cells were harvested (for EdU incorporation, EdU was added 1.5–2 h before cell harvesting), stained following manufacturer's recommendations and analyzed at the FACS or by immunofluorescence (siCPT1A experiment).
3D Fibrin Assay
Collagen-coated beads (Cytodex 3, Sigma-Aldrich) were covered with HUVECs, embedded into fibrin gel as previously described (34) and cultured for 2 days in EGM-2 medium in the presence of the indicated stimuli.
Fatty Acid Oxidation Measurement
[1-14C] palmitic acid (Perkin Elmer, Waltham, MA) or palmitic acid (Sigma) was resuspended in α-cyclodextrin (Sigma, 20 mg/ml in 10 mm Tris, pH 8) to obtain a 12 μCi/ml solution. HUVECs grown fully confluent in 35 mm dish were incubated with the indicated stimuli for the indicated time and then 1.2 μCi/ml [1-14C] palmitic acid was added for 4h in the presence or absence of stimuli. For the siRNA study, transfected HUVECs were seeded the day before the assay then incubated with [1-14C] palmitic acid for 4h. After 4h, the lids of the cell culture plates were covered inside with Whatman paper and saturated with 5 m NaOH. Addition of 0.5 N perchloric acid triggered the release of CO2 that was captured in the Whatman paper and analyzed in a scintillation counter (MicroBeta TriLux, Perkin Elmer). For the acid soluble metabolites, 1 ml of medium was recovered, incubated with 200 μl 4N KOH, 30 min at 60 °C to hydrolyze the acyl-CoA, esters and acidified with 300 μl 1 m NaC2H3O2 and 200 μl 3N H2SO4. After spinning, 300 μl of the supernatant were mixed with 5 ml of a 2:1 solution of chloroform/methanol to allow phase separation. The upper aqueous phase, where the acid soluble metabolites (ASM) coming from palmitic acid oxidation are dissolved, was incubated with scintillation fluid and analyzed in a scintillation counter. The values obtained were normalized by cell number.
Oxygen Consumption Rate Measurement
XF96 plates (Seahorse Bioscience, North Billerica, MA) were coated with gelatin and 2.5 × 10⁴ HUVECs were seeded in EGM-2 medium. The day after, the medium was replaced with unbuffered assay medium (Seahorse Bioscience) with 0.5% FBS and 5 mm glucose, pH 7.4, and cells placed at 37 °C in CO2-free incubator for 1 h. Basal oxygen-consumption rate (OCR) was recorded using the XFe96 analyzer. Pyruvate and dichloroacetate were added in subsequent injections. Each measurement cycle consisted of 3 min mixing and 3 min measuring. At the end of the experiment 1 μm antimycin A was added in order to measure mitochondria-independent oxygen consumption. Mitochondria-dependent OCR is plotted.
ATP Assay
ATP was assessed using ATP determination kit (Invitrogen) according to manufacturer instruction. HUVECs were harvested and counted, then lysed in H2O (1 ml/1 × 106 cells) and boiled for 10 min. After spinning, the supernatants were assessed with the ATP determination kit, and luciferase activity was measured by Glomax luminometer (Promega, Madison, WI).
Calcium Imaging
Confluent HUVECs were grown in EGM-2 medium on glass gelatin-coated coverslips for 4 days. Cells were next loaded (45 min at 37 °C) with 2 μm Fura-2 AM (Invitrogen), for ratiometric cytosolic Ca2+ [Ca2+]i measurements as previously described (35). During the experiments cells were continuously bathed with a microperfusion system. Fluorescence measurements were made using a Polychrome V spectrofluorometer (TILL Photonics, Munich BioRegio, Germany) attached to a Nikon TE-2000-S (Nikon Corporation, Melville, NY) microscope and Metafluor Imaging System (Molecular Devices, Sunnyvale, CA) for image acquisition using 3-s intervals. During experiments, cells were maintained in standard extracellular solution of the following composition: 145 mm NaCl, 5 mm KCl, 2 mm CaCl2, 1 mm MgCl2, 10 mm N-(2-hydroxyethyl)-piperazine-N′-ethanesufonic acid (HEPES), and 10 mm glucose (NaOH to pH 7.35). Cells were continuously bathed with a microperfusion system. Each fluorescence trace (340/380 nm ratio) represents one region of interest (ROI) corresponding to cells in the chosen image field. Appropriate controls were performed with vehicles (dH2O). Number of oscillations was determined by IgorPro software (WaveMetrics Inc, Tigard, OR) by multipeak fitting analysis function and expressed as number of oscillation/10 min. The oscillation number is expressed as mean ± S.E. of at least three pooled experiments.
Permeability Assays
In Vitro TEER
Cells were plated in EGM-2 on 12 mm gelatin-coated transwell, 0.4 μm pore size polyester membrane (Corning, New York, NY), and grown tightly confluent. TEER was measured using a “chopstick” STX2 electrode connected to an EVOM2 voltohmmeter (World Precision Instruments, Sarasota, FL). TEER has been measured also in wells without cells and values have been used as background and subtracted to the values measured in the presence of cells. The normalized values were used to calculate the % reported in the figures.
In Vivo Ear Permeability
This assay was performed as previously described with minor modifications (36). FVB/n wild type mice (The Jackson Laboratory, Bar Harbor, ME) were pretreated with 4 mg/Kg pyrilamine maleate salt (Sigma Aldrich) at least 30 min before Evans blue injection, in order to block histamine release. Next, 100 μl/mouse of Evans blue (Sigma Aldrich) diluted 0.5% in saline solution was intravenously injected. After two hours, mice were randomized and subdivided into groups of four mice each. Different drugs were injected intradermally with the following amounts: (1) 100 ng, 500 ng, 1 μg, and 2 μg of etomoxir; (2) 1 μg, 2 μg, 5 μg, and 10 μg of oxfenicine; (3) 100 ng etomoxir combined with 500 ng pyruvate and 5 μg dichloroacetate; (4) gadolinium 100 μm was co-injected with 500 ng of etomoxir; and (5) saline solution was used as negative control. Ten minutes after drug administration, the ears were excised and photographed with a stereomicroscope connected to a camera by means the Image ProPlus analyzer software. The amount of Evans blue extravasation through the vessels was quantified with ImageJ software. Mice were housed under the approval and the institutional guidelines governing the care of laboratory mice of the University of Torino Committee on Animal Research and in compliance with National and International laws and policies.
Statistical Analysis
Unless indicated otherwise, bars represent mean +/− Standard Error Mean (S.E.M.) (n≥3), p values have been calculated using a two-tailed unpaired t test using GraphPad Prism software. *p < 0.05; **p < 0.01; ***p < 0.001;****p < 0.0001.
The .raw MS files and search/identification files obtained with MaxQuant have been deposited in the ProteomeXchange Consortium (http://proteomecentral.proteomexchange.org/cgi/GetDataset) via the PRIDE partner repository with the dataset identifier PXD001186.
RESULTS
ECs Remodel Their Metabolism upon Morphogenesis
To identify metabolic pathways potentially involved in controlling EC functions, we used iMAT to integrate time-resolved proteomic data of human umbilical vein endothelial cells (HUVECs, referred to as ECs throughout the Results section) grown on matrigel with GSMM (Fig. 1A). ECs were used as model because they are well-characterized primary endothelial cells and relatively easy to isolate and culture. Using high-resolution MS and label-free quantification algorithm (14), we measured the proteome of ECs grown on matrigel for 4h (early matrigel) and 22h (late matrigel) (supplemental Table S1), because at these time points cells have a distinct phenotype. At 4h cells are spread, proliferative and have started forming a network, whereas at 22h cells are elongated, low proliferative and have assembled into a fully formed complex network (Fig. 1A, 1B). Proteomic changes between these two time points pinpointed proteins involved in vessel maturation, including increasing levels of cell–cell adhesion proteins ve-cadherin (CDH5) and junction plakoglobin (JUP), the tyrosine kinase receptor TIE1, and the endothelial nitric oxide synthase (NOS3) [37, 38, 39](Fig. 1C). For each time point, 359 metabolic enzymes (according to RECON (32), supplemental Table S1) were quantified by MS of which 170 were defined as highly or lowly abundant and used to build up a model that predicts metabolic fluxes (supplemental Table S2). We reasoned that metabolic differences between 4h and 22h might hint at pathways relevant for the regulation of EC functions. Pathway enrichment analysis based on fold change reaction flux between early and late matrigel highlighted FAO in peroxisome, the organelle where very-long-chain FAs can be oxidized into short-chain FAs and released into the cytosol, as the most up-regulated pathway when the network was fully assembled, and TCAc as the most down-regulated (supplemental Table S2). Detailed investigation of single reaction flux of FAs and glucose metabolism pinpointed increased transport into the mitochondria of long-chain FAs, such as the palmitoyl-CoA via CPT1 and CPT2, higher diffusion into the mitochondria of short-chain FAs, such as the octanoyl-CoA that can be generated by oxidation of very long fatty acids, and increased flux of acyl-CoA dehydrogenases (ACADM and ACADS)-catalyzed reactions of the FAO pathway (Fig. 1D, 1E). Conversely, decreased flux was predicted for reactions of the glycolysis pathway catalyzed by hexokinase (HK), phosphofructokinase (PFK), aldolase (ALDO), and lactate dehydrogenase (LDH), and for the pyruvate dehydrogenase (PDH), which generates acetyl-CoA from pyruvate thus linking glycolysis to the TCAc (Fig. 1D, 1E). To verify our model, we performed a MS stable isotope-based tracing metabolomic analysis using 13C16-labeled palmitate and 13C6-labeled glucose. This approach measures the metabolic activity of the cells by calculating the amount of 13C-labeled palmitate and glucose that cells convert into other metabolites. After early time culture on matrigel, the 13C-labeled palmitoyl-carnitine, whose formation is catalyzed by CPT1A from the 13C16-labeled-palmitate, was barely detected by MS while consistently quantified when the network was fully formed after 22h and 30h. Similar results were observed for the 13C-labeled aspartate that is generated from TCAc intermediates (Fig. 1F and supplemental Fig. S1A). Conversely, ECs in the fully formed network decreased 13C-labeled glucose consumption for glycolysis, as shown by more than 50% reduction of 13C-labeled secreted lactate and intermediates of glycolysis and TCAc (Fig. 1G). To investigate whether the above metabolic changes were specific for the matrigel system, and not an effect of general cell adhesion mechanism or adaptation of the cells to the cell culture, we used 14C-labeled palmitate and measured FAO in ECs grown on culture dish for 4h and 22h. In contrast to the results obtained in the matrigel assay, ECs showed a significant reduction of FAO at 22h compared with 4h (supplemental Fig. S1B). Moreover, to assess that changes in FAO were not just a reflection of the proliferative status of the cells, we measured FAO in highly and low proliferative cells (supplemental Fig. S1C). This showed that low proliferative ECs had lower FAO compared with highly proliferative ones (supplemental Fig. S1D). These results demonstrate the validity of our predictive metabolic model and indicate that, when assembled into a fully formed network, ECs enhance FAO while reducing glycolysis.
Fig. 1.

ECs remodel their metabolism when assembled into a fully formed vascular network. A, Workflow showing the model used to study EC morphogenesis, and how high-resolution proteomics has been integrated into the genome scale metabolic model using integrative metabolic analysis tool (iMAT). B, HUVECs decrease proliferation when grown for 24 h on matrigel compared with 3h, assessed by EdU incorporation (= % of cells in S phase of the cell cycle). C, Logarithmized LFQ intensity ratio (22 h/4 h) measured for the cell–cell junction proteins ve-cadherin (CDH5) and plakoglobin (JUP), the tyrosine kinase receptor TIE1, and the endothelial nitric oxide synthase (NOS3), which were found more abundant in HUVECs cultured on matrigel for 22 h compared with 4h. Bars represent mean of the LFQ intensity ratio ± S.D. (n ≥ 3) as reported in supplemental Table S1. D, Predicted flux changes upon morphogenesis for fatty acid oxidation (FAO) and glycolysis reactions. x axis, enzymes that catalyze the reaction; HK, hexokinase; PFK, phosphofructokinase; ALDO, aldolase; LDH, lactate dehydrogenase; PDH, pyruvate dehydrogenase; CPT, carnitine O-palmitoyltransferase; ACADM/S, medium(M)/short(S)-chain specific acyl-CoA dehydrogenase, mitochondrial; Diff, diffusion octanoyl-CoA. E, Schematic representation of cell metabolism with highlighted the pathways in D. OxPhos, oxidative phosphorylation. In brackets, reaction ID as in Supplemental Table S2. F, G, Tracing experiment where ECs were cultured for 3h or 22h on matrigel followed by spike-in of 13C16-labeled palmitate, F, or 13C6 glucose, G, and 6h culture. Labeled (%), % of labeled metabolite (peak area labeled) of the total amount (peak area labeled + peak area unlabeled). Peak area represents the amount of 13C-labeled palmitoyl carnitine or lactate as measured by the mass spectrometer. For the palmitoyl carnitine the labeled (%) could not be measured because the unlabeled palmitoyl-carnitine was not detected by MS. For the lactate, peak area representation allows evaluating the extent of the glycolysis fuelled by extracellular 13C-labeled glucose. Δ Peak area = Extracellular palmitate uptake, which was measured as amount of 13C-labeled palmitate left in the medium at the end of the experiment minus the total amount of 13C-labeled palmitate that was initially spiked-in. Bars = mean ± S.D. (n = 3). H, CPT1A levels (logarithmized LFQ intensity normalized by the average LFQ intensity measured at 4h) in HUVECs cultured on matrigel for 4 h or 22 h. Bars = Mean ± S.D. (n = 6).
CPT1A Inhibition Impairs EC Proliferation, Network Integrity, and Sprouting
To investigate the functional role of FAO in ECs, we first exploited the predictive metabolic model and explored whether blocking FAO would alter metabolic fluxes. To this aim, we inhibited CPT1A as it is the rate-limiting enzyme in FAO and its levels were increased after 24h of ECs culture on matrigel (Fig. 1H). By inactivating CPT1A in the predictive metabolic model built up using the late matrigel proteomic data, a substantial decrease in cellular ATP levels was predicted (reactions 3789, 3791, and 3795 were among the most down-regulated ones, supplemental Table S2). These results suggest that FAO is a key factor in ECs and, based on these observations, we further investigated the role of FAO in ECs by targeting CPT1A. By inhibiting CPT1A either pharmacologically with etomoxir, a well characterized drug that targets CPT1 (40), or siRNA specific for CPT1A (supplemental Fig. S2A), FAO was substantially decreased (Fig. 2A, 2B). Because 15 μg/ml etomoxir showed maximum FAO inhibition (Fig. 2A), we used this concentration for the following experiments. A significant decrease in cell proliferation was measured after 24 h treatment with etomoxir and when CPT1A was silenced with siRNA, but not after 4 h etomoxir treatment (Fig. 2C, 2D and supplemental Fig. S2B). These changes had minor effects on cell death. Although no effects were measured upon 24 h inhibition of CPT1A with etomoxir (Fig. 2E), a small but significant increase in cell death (by means of number of cells positive for both propidium iodide and annexin V) was measured in cells where CPT1A was silenced for 48h (Fig. 2F and supplemental Fig. S2C). Next we tested the effects of CPT1A inhibition on EC morphogenesis. When we grew ECs on matrigel for 24h in the presence of etomoxir or when cells were silenced for CPT1A (supplemental Fig. S2D), a significant reduction (30–40%) of the network integrity was measured (Fig. 2G, 2H and supplemental Fig. S2E, 2F). To exclude that this effect was exclusively because of a reduction in cell proliferation, we performed the matrigel assay in the presence of mitomycin C, a DNA cross-linker that inhibits cell proliferation (4) (supplemental Fig. S2G). This experiment showed that etomoxir, but not mitomycin C treatment significantly reduced network integrity (supplemental Fig. S2H). Significant defects were also observed using a three-dimension (3D) angiogenesis assay of ECs embedded into fibrin gel for 2 days. EC sprouting was significantly reduced in the presence of etomoxir (Fig. 2I, 2J and supplemental Fig. S2I, 2J). Hence, reduced CPT1A activity impairs key EC functions.
Fig. 2.

FAO regulates HUVEC functions. A, B, Reduced FAO upon etomoxir treatment (Eto, A) or CPT1A silencing with pool siRNA (siCPT1A, B) in HUVECs, measured as 14C-labeled acid soluble metabolites produced from 14C-labeled palmitic acid. CCPM = corrected count per minute. CCPM is expressed as percentage compared with the vehicle-treated cells (Ctl = 100%); siCtl = nontargeting siRNA. C, D, Cell proliferation upon etomoxir treatment for the indicated time, C, or CPT1A silencing (bars represent mean ± S.D.) D, measured as percentage of cells incorporating EdU. EdU+ cells are expressed as percentage compared with the control cells (Ctl = 100%). E, F, Propidium Iodide (PI) and annexin V (AV) staining of cells grown in the presence of etomoxir for 24 h, E, or silenced for CPT1A, F, was measured by FACS. Starv, cells starved overnight in EBM-2. G, H, Reduced integrity of the network formed by cells after 24 h culture on matrigel in the presence of etomoxir, G, or when silenced for CPT1A, H. I, J, Reduced sprouting in 3D-fibrin angiogenesis assay (48 h) performed with cells in the presence of etomoxir, I, or silenced for CPT1A, J. p value according to Mann-Whitney test (n>20 cell-coated beads).
In ECs FAO Supports TCAc and ATP Production through Oxidative Phosphorylation
FAO produces intermediates for the TCAc, which is a central hub for energy production, and our metabolic model predicted a sizable contribution of CPT1A to maintain ATP levels. Therefore, we measured the effects of CPT1A inhibition on cellular ATP levels. Because of the limited number and accessibility of ECs when grown on matrigel, to investigate the role of FAO in ECs, we performed experiments using EC cultured in a monolayer. Acute (3h) etomoxir treatment of ECs reduced total ATP levels of ∼10% (Fig. 3A). This result is in line with the previous literature that shows that ∼80% of ATP is derived from glycolysis and the remaining from glucose, glutamine, and fatty acids oxidation (4). When we replenished the TCAc of the etomoxir-treated cells with dichloroacetate (DCA), a drug that activates the pyruvate dehydrogenase A (PDHA1) by inhibiting the pyruvate dehydrogenase kinase (Fig. 3B), and pyruvate, the substrate that PDHA1 uses to generate acetyl-CoA, the ATP levels were restored almost to the levels of control cells (Fig. 3A). Consistently, inhibition of CPT1A induced a significant decrease in oxygen consumption rate (OCR) and OCR levels raised with the replenishment of the TCAc with DCA and pyruvate (Fig. 3C, 3D). Similar results were obtained upon acute inhibition of FAO with oxfenicine, which is another known inhibitor of CPT1 (10, 40) (supplemental Fig. S2K–M). Thus, CPT1A activity fuels TCAc and ATP production through oxidative phosphorylation.
Fig. 3.
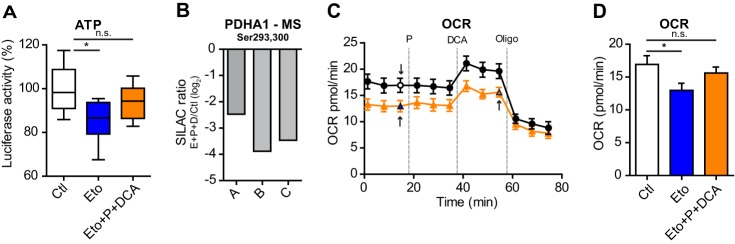
FAO fuels the TCA cycle to generate energy. A, Decreased total cellular ATP levels induced by 3h etomoxir treatment increased upon pyruvate and DCA treatment, as measured by luciferase activity. Luciferase activity is expressed as percentage compared with the control (Ctl = 100%); bars represent mean ± S.E.M. (n = 9). p value according to Mann-Whitney test. P, pyruvate; DCA, dichloroacetate. B, Decreased phosphorylation levels of Ser293 and Ser300 (when phosphorylated by the pyruvate dehydrogenase kinase, PDHA1 activity is inhibited), as measured by MS in the SILAC phosphoproteomic analysis of HUVECs treated with etomoxir (supplemental Table S3). The SILAC ratio was calculated between cells treated with etomoxir and vehicle-treated cells (Ctl). A-C, represents three replicate experiments. C, Seahorse measurements of oxygen consumption rate (OCR) show that etomoxir induces decrease OCR compared with control (Ctl) cells. Replenishment of the TCAc with pyruvate and DCA increases OCR in both, Ctl and etomoxir-treated cells. Arrows indicate the measurements represented in panel, D. Oligo, oligomycin 1 μm. Bars represent mean ± S.E.M. (n = 20). D, Quantifcation of (C). Bars represent mean ± S.E.M. (n = 20). p value according to Mann-Whitney test.
Phosphoproteomics Unveils That CPT1A Inhibition in ECs Affects Calcium-Dependent Signaling
To further investigate CPT1A functions, we used unbiased global phosphoproteomics and assessed the impact of metabolic alterations induced by acute CPT1A inhibition on EC signaling. Using a triple-SILAC approach, we measured phosphoproteomic changes after 2h etomoxir treatment and following replenishment of the TCAc with pyruvate and DCA (Fig. 4A). In triplicate experiments more than nine thousand accurately localized (with a median localization probability (41) of 0.999) phosphorylation sites were quantified. Of those, 83, which belong to 62 proteins, increased phosphorylation levels upon etomoxir treatment compared with nontreated control cells (supplemental Tables S3–S4). Based on Uniprot annotation, the regulated phosphoproteins included metabolic enzymes, kinases, and proteins involved in the regulation of transcription, translation, protein trafficking, and cytoskeleton. Additionally, we exploited the phosphoproteomic data to look for kinases responsible for the deregulated phospho-signaling. First we evaluated that the phosphoproteomic changes were the results of altered kinase activity and not total protein levels. By measuring the cell proteome to a depth of almost 5000 proteins, only ten proteins increased levels upon etomoxir stimulation and this subset did not include any of the proteins with regulated phosphorylation sites (Fig. 4A and supplemental Table S5). Thus, etomoxir-induced phosphorylations are mostly the result of altered phospho-signaling. Next we used NetworKIN (29), a platform that combines sequence specificity, such as known linear kinase motifs surrounding the regulated phosphorylation site, and cellular context, such as physical and functional protein–protein interactions, to identify the likely kinases responsible for the regulation of the 83 sites. This analysis predicted highest number of substrates (12) for the calcium-calmodulin dependent kinase II (CamKII) group (Fig. 4B, supplemental Table S6). Linear kinase motif analysis with Motif-X strengthened this prediction and pinpointed the CamKII motif, which has an arginine in position −3 of the phosphorylated site (R--Sp), as significantly over-represented among the 83 sites (Fig. 4C). Similarly, CamKII was predicted active when performing a kinase motif (according to known motifs in the HPRD database) enrichment analysis using the MaxQuant module Perseus (supplemental Fig. S3A). This analysis further pinpointed highly significant enrichment for the AMP-activated protein kinase (AMPK). AMPK can be directly phosphorylated and activated by CamKII (17, 42), and NetworKIN predicted two AMPK substrates, of which one is the known Ser80 of ACACA (43)(supplemental Fig. S3B–D). We verified by Western blot analysis that ACACA increases phosphorylation upon etomoxir treatment, and further showed that in the presence of gadolinium (Gd3+), which inhibits extracellular Ca2+ entry (44), etomoxir-induced ACACA phosphorylation was reduced (supplemental Fig. S3E). Finally, detailed literature- and database-based investigation of the etomoxir-regulated phosphorylation sites pinpointed several sites on proteins related to Ca2+ signaling, such as the Ca2+ sensor STIM1 (45), the sodium/hydrogen exchanger SLC9A1, the adherens junction protein CTNNA1, the phosphatidylinositol transfer protein PITPNM2, and the GTPase-activating protein ARGHAP17 (Fig. 4D). Of note, some of the sites decreased phosphorylation levels upon pyruvate and DCA treatment (Fig. 4D).
Fig. 4.
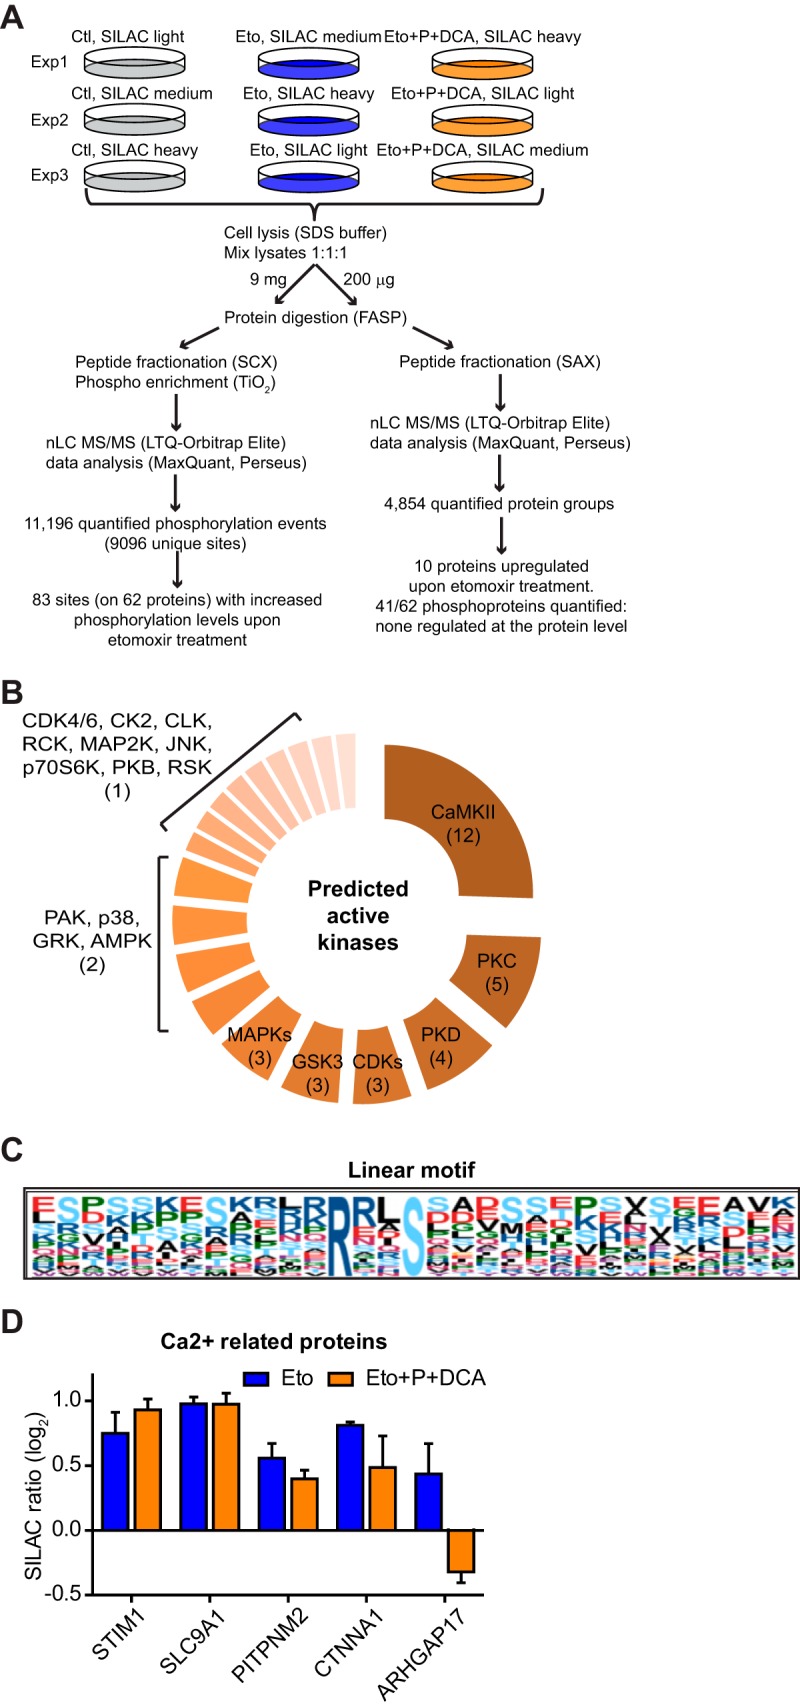
Phosphoproteomics reveals altered Ca2+ signaling upon acute inhibition of CPT1A with etomoxir. A, Workflow of the SILAC proteomic and phosphoproteomic analysis of HUVECs treated with vehicle (Ctl), etomoxir (Eto) or etomoxir followed by pyruvate (P) and dichloroacetate (DCA) treatment (Eto+P+DCA). Results refer to three SILAC experiments, Exp 1–3, where the SILAC labeling conditions were swapped. B, Predicted active kinases upon etomoxir treatment (NetworKIN analysis). Numbers in brackets indicate the number of predicted substrates shown in supplemental Table S6. C, Linear motif identified by Motif-X analysis. D, Etomoxir-up-regulated phosphorylation sites on proteins involved in Ca2+ signaling (literature-based). Bars represent mean ± S.D. (n≥2).
All together, these data indicate that inhibition of FAO with etomoxir activates Ca2+/CamKII/AMPK pathway, and suggest that CPT1A activity is required to maintain Ca2+ homeostasis.
Acute CPT1A Inhibition Alters Calcium Homeostasis in ECs
Measuring single-cell cytoplasmic Ca2+ dynamics in ECs showed that inhibition of CPT1A with etomoxir induced a striking increase (>threefold) of Ca2+ oscillation frequency within minutes (Fig. 5A, B). Notably, this alteration was fully inhibited by blocking extracellular Ca2+ entry with Gd3+ or replenishing the TCAc with pyruvate and DCA (Fig. 5B and supplemental Fig. S4A). Demonstrating that etomoxir-induced Ca2+ oscillations were dependent on CPT1A inhibition, ECs silenced for CPT1A did not increase Ca2+ oscillations frequency when treated with etomoxir (supplemental Fig. S4B, S4C). Moreover, similar to etomoxir, ECs treated with oxfenicine increased cytosolic Ca2+ oscillations, and these decreased by replenishing the TCAc (Fig. 5C, 5D). Together these results demonstrate that in ECs CPT1A activity maintains Ca2+ homeostasis.
Fig. 5.
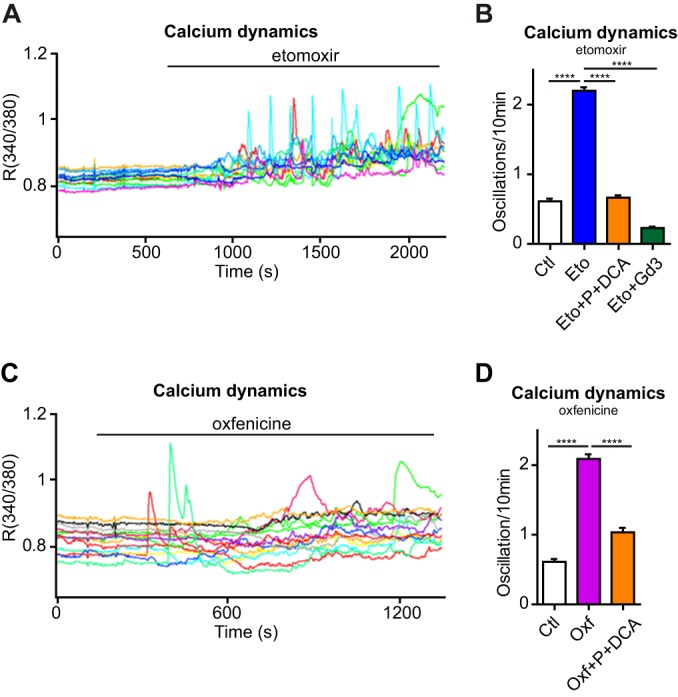
Acute CPT1A inhibition induces increased Ca2+ oscillation freaquency. A, Representative plot of increased Ca2+ oscillation frequency in HUVECs upon etomoxir treatment. Each line represents a single cell. B, Increased frequency of Ca2+ oscillations in HUVECs upon etomoxir treatment is blocked in the presence of pyruvate and DCA or 100 μm gadolinium (Gd3+). C, Representative plot of increased Ca2+ oscillation frequency in HUVECs upon oxfenicine treatment. Each line represents a single cell. D, Increased frequency of Ca2+ oscillations frequency in HUVECs upon oxfenicine treatment is reduced in the presence of pyruvate and DCA. Bars represent mean ± S.E.M. (n>150). p value according to Mann-Whitney test.
CPT1A Inhibition Increases EC Permeability
Calcium is a key regulator of endothelial permeability (46). Therefore, to explore if the measured Ca2+ alteration induced by inhibiting CPT1A had an impact on EC functions, we measured the permeability of an EC monolayer by means of trans-endothelial electrical resistance (TEER), and compared it to known inducers of hyperpermeability, thrombin and vascular endothelial growth factor (VEGF). TEER of etomoxir-treated cells showed a prominent decrease (30–40%) of resistance (= increase permeability) compared with control cells (Fig. 6A). Similarly, increased permeability was measured in ECs upon 24 h treatment with etomoxir or when CPT1A was silenced with siRNA (supplemental Figs. S2D and S4D, S4E). This effect was around half of that induced by 1 unit/ml of thrombin (∼60% decrease) and similar to 1 nm VEGF treatment (∼40% decrease) (supplemental Fig. S4F, S4G). Confirming that the above effect was driven by Ca2+, ECs treated with Gd3+ did not increase permeability when treated with etomoxir (Fig. 6A). We further exploited the TEER assay to determine whether replenishing the TCAc of etomoxir-treated ECs, which we have shown to block aberrant Ca2+ oscillations (Fig. 5A, 5B), would reduce hyperpermeability. Fig. 6B shows that pyruvate and DCA treatment restored etomoxir-induced increased permeability to the levels of control cells. Similar results were obtained using blood outgrowth endothelial cells (BOECs), another model of human primary endothelial cell that is derived from peripheral blood (24, 47)(Fig. 6C), and when CPT1 activity was inhibited with oxfenicine (Fig. 6D). Hence, impaired Ca2+ homeostasis in CPT1-inhibited cells induces hyperpermeability. Finally, we determined if the increased permeability was dependent on the contribution of FAO to oxidative phosphorylation. To this aim, we used oligomycin, a drug that inhibits oxidative phosphorylation by blocking the ATP synthase. Similar to CPT1A inhibition, ECs treated with oligomycin had a significantly reduced TEER. Moreover, oligomycin blocked the recovery of the hyperpermeability induced by DCA and pyruvate in etomoxir-treated ECs (Fig. 6E).
Fig. 6.
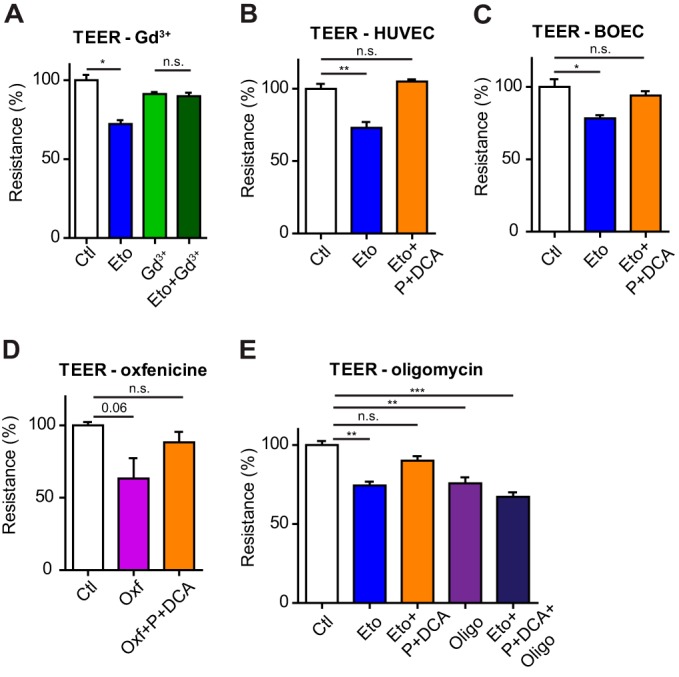
Acute CPT1A inhibition induces EC hyperpermeability. A, Decreased trans-endothelial resistance (TEER) (= increased EC permeability) in HUVECs induced by etomoxir is inhibited blocking Ca2+ entry pretreating cells (10 min) with 100 μm gadolinium (Gd3+). B, C, Decreased TEER in HUVECs, B, and BOECs, C, induced by etomoxir raises upon pyruvate (P) and dichloroacetate (DCA) treatment. D, Decreased TEER in HUVECs treated with oxfenicine raises upon P and DCA treatment. E, Oligomycin treatment (1 μm) decreases TEER in HUVECs and abrogates the effects of P and DCA treatment in etomoxir-treated cells. Bars represent mean ± S.E.M. (n = 3).
CPT1A Inhibition Increases Blood Vessel Leakage In Vivo
To assess the relevance of our findings also in an in vivo context, we investigated the effects of the acute inhibition of CPT1A on vascular permeability. To this aim we used an established Evans blue-based permeability assay of mature blood vessels (36) and measured the leakage of blood vessels in the mouse ear upon intradermal injection of vehicle, etomoxir or oxfenicine. We chose this system because it allows minimizing indirect heart effects that can be induced by systemic injection of the two drugs (40). Both etomoxir and oxfenicine induced a dose-dependent increased leakage of Evans blue (Fig. 7A, 7B and supplemental Fig. S5A, S5B). Notably, the effects of etomoxir were significantly reduced when co-injected with Gd3+ and abrogated with pyruvate and DCA (Fig. 7C–7F and supplemental Fig. S5C, S5D). Mirroring the results observed in vitro, pharmacological inhibition of CPT1A impairs vascular barrier function and this process is dependent on Ca2+ and TCAc activity (Fig. 7G).
Fig. 7.

Acute CPT1A inhibition increases blood vessel leakage. A, B, Quantification of Evans blue extravasation from the vasculature of the mouse ear following acute etomoxir, A, and oxfenicine, B, treatment at the indicated doses. The permeability was measured as amount of leaked blue/constant area (μm2). C, Quantification of Evans blue extravasation in D, E, and F. D-F Representative images showing Evans blue extravasation from the mouse ear vasculature upon acute etomoxir treatment (0.5 μg) D, which is inhibited in the presence of pyruvate and DCA (Eto+P+DCA) E, and gadolinium (Gd3+), F. G, Schematic overview of FAO function in ECs. Blue arrow indicates that the finding is supported by experiments; red dashed arrow indicates that the mechanisms have still to be determined (hypotheses are discussed in the Discussion). Bars represent mean ± S.E.M. (n≥3).
DISCUSSION
In this work we built up the first predictive model of metabolic fluxes based on high-resolution quantitative proteomic data, which unveiled that HUVECs increase FAO and decrease glycolysis when assembled into a fully formed network. Although it has been reported that loss of the rate-limiting enzyme for glycolysis, PFKFB3, impairs EC proliferation and migration (4), so far there has been no evidence of endothelial functions altered by blockage of the FAO rate-limiting enzyme CPT1A. By means of established drugs that target CPT1A, gene silencing and global phosphoproteomics, we demonstrate that FAO sustains oxidative phosphorylation and maintains Ca2+ homeostasis, and that this is required to maintain adequate permeability of ECs in vitro and established mouse blood vessels in vivo.
iMAT is a powerful computational tool to predict human cellular metabolic fluxes integrating GSMM with gene expression data (11, 12); here we show that this analysis can be successfully extended to the use of protein levels accurately measured by MS-proteomics. We have validated some of the predictions identified in our model, such as increased CPT1A activity and decreased funneling of glucose into glycolysis in HUVECs assembled into a fully formed network. Moreover, we provide the full list of predicted metabolic reaction fluxes, as resource of other metabolic processes potentially involved in regulating EC behavior to be further investigated.
It has been previously shown that ECs preferentially use glucose as energy source, have modest mitochondria content, and generate only a small amount of energy through mitochondrial metabolism (4, 48). Accordingly, in our MS metabolomic analysis we have identified only a limited subset of metabolites generated from 13C-labeled palmitate. However, these were reliably quantified and led us to discover that ECs increase FAO in conditions other than energetic stress (7). Although future work is needed to address if changes occurring when ECs are assembled into a fully-formed network in vitro occur also during the maturation process of newly formed blood vessels in vivo, our work demonstrates that FAO plays a key role in ECs because acute and prolonged CPT1A inhibition impairs several cellular functions. To identify the role of FAO in ECs, we focused on the effects of acute pharmacological inhibition of CPT1A. This approach allows dynamic manipulation and measurement of cell metabolism and signaling, and identifies initial events that lead to the altered EC phenotypes upon prolonged CPT1A inhibition. Of note, etomoxir and oxfenicine are used in clinics or preclinical trials (10), thus extending the relevance of our study to clinical context.
Phosphorylations are dynamic and reversible regulators of protein functions and we reasoned that phosphoproteomics would be excellent to investigate the signaling altered upon short-time FAO inhibition and provide hints on the functional role of CPT1A. This approach pinpointed alterations of the Ca2+/CamKII/AMPK pathway. Calcium is a master regulator of cellular signaling and functions, and abnormal Ca2+ homeostasis can determine pathological states (49). In the vascular context, Ca2+ homeostasis is crucial to maintain the barrier function of the blood vessels, and increased intracellular Ca2+ levels in ECs increase cell permeability (46). For these reasons, we focused our attention on Ca2+ and demonstrate that CPT1A activity maintains Ca2+ homeostasis and EC permeability. Furthermore, we show that this occurs through the function of CPT1A to fuel TCAc and oxidative phosphorylation (Fig. 7G). Thus, our work provides the first link between FAO and Ca2+ signaling. However, the detailed mechanism has still to be elucidated. Intriguingly, mitochondria regulate Ca2+ homeostasis by buffering cytosolic Ca2+ (50) and ECs can store up to 25% of the total cellular Ca2+ in the mitochondria (51). It is therefore tempting to hypothesize that the altered mitochondrial activity (reduced ATP levels and OCR) induced by FAO inhibition may affect the capability of the mitochondria to buffer Ca2+ and that this activates Ca2+-signaling. Another interesting question to be addressed in the future is if the Ca2+/CamKII/AMPK pathway is a functional driver of EC and vascular hyperpermeability observed upon CPT1A inhibition. In support of this hypothesis, it has been previously shown that increased EC permeability in response to thrombin (52) and VEGF (42) is induced through Ca2+/CamKII/AMPK pathway. Moreover, when we compared etomoxir- with thrombin-driven phospho-signaling, which we have recently measured using a similar MS-proteomic approach (24), we observed that more than 50% of the phosphosites up-regulated by etomoxir increased phosphorylation levels also upon thrombin stimulation (supplemental Table S3). These included proteins involved in Ca2+ signaling, such as STIM1 (45), SLC9A1, and ACACA. Finally, our dataset is a potential resource for the identification of other kinases (Fig. 4B) and detailed molecular mechanisms (supplemental Table S3) that determine the phenotype of FAO-inhibited ECs.
In conclusion, our work highlights the power of using MS-proteomics and metabolic modeling to better understand cell metabolism and unravel its interplay with cell behavior. Here we revealed a central role for CPT1A in ECs. Finally, our results imply that inducing mitochondrial metabolism, including FAO, for example using available drugs such as DCA, could be a promising strategy to act directly on ECs and counteract permeability defects observed in diseases such as cancer, thrombosis and atherosclerosis, and trigger vascular normalization. This study opens therefore new exciting perspectives for the study of FAO in ECs in pathophysiological conditions.
Supplementary Material
Acknowledgments
We thank the BAIR facility at the Beatson, the nurses at the Southern General Hospital in Glasgow for the collection of the umbilical cords, the PRIDE team, and Guido Serini for critically reading the manuscript.
Footnotes
Author contributions: F.P., Z.T.S., E.P., F.M., C.F., E. Giraudo, A.F., K.A., E.R., E. Gottlieb, and S.Z. designed research; F.P., Z.T.S., E.P., L.J.N., Z.E., D.A., F.M., J.R.H., G.M., S.R., and S.Z. performed research; F.P., Z.T.S., E.P., Z.E., D.A., F.M., J.R.H., L.Z., S.R., C.F., E. Giraudo, A.F., E. Gottlieb, and S.Z. analyzed data; F.P. and S.Z. wrote the paper.
* This work was supported by Cancer Research UK.
 This article contains supplemental Figs. S1 to S5 and Tables S1 to S6.
1 The abbreviations used are:
- EC
- endothelial cell
- FAO
- fatty acid oxidation
- TCAc
- tricarboxylic acid cycle
- FA
- fatty acid
- iMAT
- integrative metabolic analysis tool
- GSMM
- genome-scale metabolic network model
- SILAC
- stable-isotope labeling with amino acids in cell culture
- HUVEC
- human umbilical vein endothelial cells
- ECM
- extracellular matrix
- TEER
- trans-endothelial electrical resistance
- DCA
- dichloroacetate
- VEGF
- vascular endothelial growth factor.
REFERENCES
- 1. Goddard L. M., Iruela-Arispe M. L. (2013) Cellular and molecular regulation of vascular permeability. Thromb. Haemost. 109, 407–415 [DOI] [PMC free article] [PubMed] [Google Scholar]
- 2. Borissoff J. I., Spronk H. M., Heeneman S., ten Cate H. (2009) Is thrombin a key player in the “coagulation-atherogenesis” maze? Cardiovasc. Res. 82, 392–403 [DOI] [PubMed] [Google Scholar]
- 3. Jain R. K. (2005) Normalization of tumor vasculature: an emerging concept in antiangiogenic therapy. Science 307, 58–62 [DOI] [PubMed] [Google Scholar]
- 4. De Bock K., Georgiadou M., Schoors S., Kuchnio A., Wong B. W., Cantelmo A. R., Quaegebeur A., Ghesquiere B., Cauwenberghs S., Eelen G., Phng L. K,, Betz I., Tembuyser B., Brepoels K., Welti J., Geudens I., Segura I., Cruys B., Bifari F., Decimo I., Blanco R., Wyns S., Vangindertael J., Rocha S., Collins R. T., Munck S., Daelemans D., Imamura H., Devlieger R., Rider M., Van Veldhoven P. P., Schuit F., Bartrons R., Hofkens J., Fraisl P., Telang S., Deberardinis R. J., Schoonjans L., Vinckier S., Chesney J., Gerhardt H., Dewerchin M., Carmeliet P. (2013) Role of PFKFB3-driven glycolysis in vessel sprouting. Cell 154, 651–663 [DOI] [PubMed] [Google Scholar]
- 5. Spolarics Z., Lang C. H., Bagby G. J., Spitzer J. J. (1991) Glutamine and fatty acid oxidation are the main sources of energy for Kupffer and endothelial cells. Am. J. Physiol. 261, G185–G190 [DOI] [PubMed] [Google Scholar]
- 6. Leighton B., Curi R., Hussein A., Newsholme E. A. (1987) Maximum activities of some key enzymes of glycolysis, glutaminolysis, Krebs cycle, and fatty acid utilization in bovine pulmonary endothelial cells. FEBS Lett. 225, 93–96 [DOI] [PubMed] [Google Scholar]
- 7. Dagher Z., Ruderman N., Tornheim K., Ido Y. (2001) Acute regulation of fatty acid oxidation and amp-activated protein kinase in human umbilical vein endothelial cells. Circulation Res. 88, 1276–1282 [DOI] [PubMed] [Google Scholar]
- 8. Schoors S., De Bock K., Cantelmo A. R., Georgiadou M., Ghesquiere B., Cauwenberghs S., Kuchnio A., Wong B. W., Quaegebeur A., Goveia J., Bifari F., Wang X., Blanco R., Tembuyser B., Cornelissen I., Bouche A., Vinckier S., Diaz-Moralli S., Gerhardt H., Telang S., Cascante M., Chesney J., Dewerchin M., Carmeliet P.(2014) Partial and transient reduction of glycolysis by PFKFB3 blockade reduces pathological angiogenesis. Cell. Metab. 19, 37–48 [DOI] [PubMed] [Google Scholar]
- 9. Sawada N., Jiang A., Takizawa F., Safdar A., Manika A., Tesmenitsky Y., Kang K. T., Bischoff J., Kalwa H., Sartoretto J. L., Kamei Y., Benjamin L. E., Watada H., Ogawa Y., Higashikuni Y., Kessinger C. W., Jaffer F. A., Michel T., Sata M., Croce K., Tanaka R., Arany Z. (2014) Endothelial PGC-1alpha mediates vascular dysfunction in diabetes. Cell. Metab. 19, 246–258 [DOI] [PMC free article] [PubMed] [Google Scholar]
- 10. Carracedo A., Cantley L. C., Pandolfi P. P. (2013) Cancer metabolism: fatty acid oxidation in the limelight. Nat. Rev. Cancer 13, 227–232 [DOI] [PMC free article] [PubMed] [Google Scholar]
- 11. Shlomi T., Cabili M. N., Herrgard M. J., Palsson B. O., Ruppin E. (2008) Network-based prediction of human tissue-specific metabolism. Nat. Biotechnol. 26, 1003–1010 [DOI] [PubMed] [Google Scholar]
- 12. Jerby L., Ruppin E. (2012) Predicting drug targets and biomarkers of cancer via genome-scale metabolic modeling. Clin. Cancer Res. 18, 5572–5584 [DOI] [PubMed] [Google Scholar]
- 13. Ong S. E., Blagoev B., Kratchmarova I., Kristensen D. B., Steen H., Pandey A., Mann M. (2002) Stable isotope labeling by amino acids in cell culture, SILAC, as a simple and accurate approach to expression proteomics. Mol. Cell. Proteomics 1, 376–386 [DOI] [PubMed] [Google Scholar]
- 14. Cox J., Hein M. Y., Luber C. A., Paron I., Nagaraj N., Mann M. (2014). MaxLFQ allows accurate proteome-wide label-free quantification by delayed normalization and maximal peptide ratio extraction. Mol. Cell. Proteomics [DOI] [PMC free article] [PubMed] [Google Scholar]
- 15. Lamond A. I., Uhlen M., Horning S., Makarov A., Robinson C. V., Serrano L., Hartl F. U., Baumeister W., Werenskiold A. K., Andersen J. S., Vorm O., Linial M., Aebersold R., Mann M. (2012). Advancing cell biology through proteomics in space and time (PROSPECTS). Mol. Cell. Proteomics 11, O112 017731. [DOI] [PMC free article] [PubMed] [Google Scholar]
- 16. Sengupta S., Peterson T. R., Sabatini D. M. (2010) Regulation of the mTOR complex 1 pathway by nutrients, growth factors, and stress. Mol. Cell 40, 310–322 [DOI] [PMC free article] [PubMed] [Google Scholar]
- 17. Hardie D. G. (2011) AMP-activated protein kinase: an energy sensor that regulates all aspects of cell function. Genes Dev. 25, 1895–1908 [DOI] [PMC free article] [PubMed] [Google Scholar]
- 18. Reid S., Hernandez-Fernaud J. R., Zanivan S. (2014) In vivo quantitative proteomics for the study of oncometabolism. Methods Enzymol. 543, 235–259 [DOI] [PubMed] [Google Scholar]
- 19. Zanivan S., Maione F., Hein M. Y., Hernandez-Fernaud J. R., Ostasiewicz P., Giraudo E., Mann M. (2013) SILAC-based proteomics of human primary endothelial cell morphogenesis unveils tumor angiogenic markers. Mol. Cell. Proteomics 12, 3599–3611 [DOI] [PMC free article] [PubMed] [Google Scholar]
- 20. Arnaoutova I., George J., Kleinman H. K., Benton G. (2009) The endothelial cell tube formation assay on basement membrane turns 20: state of the science and the art. Angiogenesis 12, 267–274 [DOI] [PubMed] [Google Scholar]
- 21. Wisniewski J. R., Zougman A., Mann M. (2009) Combination of FASP and StageTip-based fractionation allows in-depth analysis of the hippocampal membrane proteome. J. Proteome Res. 8, 5674–5678 [DOI] [PubMed] [Google Scholar]
- 22. Wisniewski J. R., Zougman A., Nagaraj N., Mann M. (2009) Universal sample preparation method for proteome analysis. Nat. Methods 6, 359–362 [DOI] [PubMed] [Google Scholar]
- 23. Larsen M. R., Thingholm T. E., Jensen O. N., Roepstorff P., Jorgensen T. J. (2005) Highly selective enrichment of phosphorylated peptides from peptide mixtures using titanium dioxide microcolumns. Mol. Cell. Proteomics 4, 873–886 [DOI] [PubMed] [Google Scholar]
- 24. van den Biggelaar M., Hernandez-Fernaud J. R., van den Eshof B. L., Neilson L. J., Meijer A. B., Mertens K., Zanivan S. (2014) Quantitative phosphoproteomics unveils temporal dynamics of thrombin signaling in human endothelial cells. Blood 123, e22–e36 [DOI] [PMC free article] [PubMed] [Google Scholar]
- 25. Rappsilber J., Ishihama Y., Mann M. (2003) Stop and go extraction tips for matrix-assisted laser desorption/ionization, nanoelectrospray, and LC/MS sample pretreatment in proteomics. Anal. Chem. 75, 663–670 [DOI] [PubMed] [Google Scholar]
- 26. Cox J., Mann M. (2008) MaxQuant enables high peptide identification rates, individualized p. p. b.-range mass accuracies and proteome-wide protein quantification. Nat. Biotechnol. 26, 1367–1372 [DOI] [PubMed] [Google Scholar]
- 27. Cox J., Neuhauser N., Michalski A., Scheltema R. A., Olsen J. V., Mann M. (2011). Andromeda – a peptide search engine integrated into the MaxQuant environment. J Proteome Res. 10, 1794–1805 [DOI] [PubMed] [Google Scholar]
- 28. Sharma K., D'Souza R. C., Tyanova S., Schaab C., Wisniewski J. R., Cox J., Mann M. (2014) Ultradeep human phosphoproteome reveals a distinct regulatory nature of tyr and ser/thr-based signaling. Cell Rep. 8, 1583–1594 [DOI] [PubMed] [Google Scholar]
- 29. Horn H., Schoof E. M., Kim J., Robin X., Miller M. L., Diella F., Palma A., Cesareni G., Jensen L. J., Linding R. (2014) KinomeXplorer: an integrated platform for kinome biology studies. Nat. Methods 11, 603–604 [DOI] [PubMed] [Google Scholar]
- 30. Schwartz D., Gygi S. P. (2005) An iterative statistical approach to the identification of protein phosphorylation motifs from large-scale data sets. Nat. Biotechnol. 23, 1391–1398 [DOI] [PubMed] [Google Scholar]
- 31. Keshava Prasad T. S., Goel R., Kandasamy K., Keerthikumar S., Kumar S., Mathivanan S., Telikicherla D., Raju R., Shafreen B., Venugopal A., Balakrishnan L., Marimuthu A., Banerjee S., Somanathan D. S., Sebastian A., Rani S., Ray S., Harrys Kishore C. J., Kanth S., Ahmed M., Kashyap M. K., Mohmood R., Ramachandra Y. L., Krishna V., Rahiman B. A., Mohan S., Ranganathan P., Ramabadran S., Chaerkady R., Pandey A. (2009) Human Protein Reference Database–2009 update. Nucleic Acids Res. 37, D767–D772 [DOI] [PMC free article] [PubMed] [Google Scholar]
- 32. Duarte N. C., Becker S. A., Jamshidi N., Thiele I., Mo M. L., Vo T. D., Srivas R., Palsson B. O. (2007) Global reconstruction of the human metabolic network based on genomic and bibliomic data. Proc. Natl. Acad. Sci. U.S.A. 104, 1777–1782 [DOI] [PMC free article] [PubMed] [Google Scholar]
- 33. Cox J., Mann M. (2012) 1D and 2D annotation enrichment: a statistical method integrating quantitative proteomics with complementary high-throughput data. BMC Bioinformatics 16, S12. [DOI] [PMC free article] [PubMed] [Google Scholar]
- 34. Nakatsu M. N., Hughes C. C. (2008) An optimized three-dimensional in vitro model for the analysis of angiogenesis. Methods Enzymol. 443, 65–82 [DOI] [PubMed] [Google Scholar]
- 35. Fiorio Pla A., Ong H. L., Cheng K. T., Brossa A., Bussolati B., Lockwich T., Paria B., Munaron L., Ambudkar I. S. (2012) TRPV4 mediates tumor-derived endothelial cell migration via arachidonic acid-activated actin remodeling. Oncogene 31, 200–212 [DOI] [PMC free article] [PubMed] [Google Scholar]
- 36. Sun Z., Li X., Massena S., Kutschera S., Padhan N., Gualandi L., Sundvold-Gjerstad V., Gustafsson K., Choy W. W., Zang G., Quach M., Jansson L., Phillipson M., Abid M. R., Spurkland A., Claesson-Welsh L. (2012) VEGFR2 induces c-Src signaling and vascular permeability in vivo via the adaptor protein TSAd. J. Exp. Med. 209, 1363–1377 [DOI] [PMC free article] [PubMed] [Google Scholar]
- 37. Dejana E., Tournier-Lasserve E., Weinstein B. M. (2009) The control of vascular integrity by endothelial cell junctions: molecular basis and pathological implications. Dev. Cell 16, 209–221 [DOI] [PubMed] [Google Scholar]
- 38. Kashiwagi S., Tsukada K., Xu L., Miyazaki J., Kozin S. V., Tyrrell J. A., Sessa W. C., Gerweck L. E., Jain R. K., Fukumura D. (2008) Perivascular nitric oxide gradients normalize tumor vasculature. Nat. Med. 14, 255–257 [DOI] [PubMed] [Google Scholar]
- 39. Sato T. N., Tozawa Y., Deutsch U., Wolburg-Buchholz K., Fujiwara Y., Gendron-Maguire M., Gridley T., Wolburg H., Risau W., Qin Y. (1995) Distinct roles of the receptor tyrosine kinases Tie-1 and Tie-2 in blood vessel formation. Nature 376, 70–74 [DOI] [PubMed] [Google Scholar]
- 40. Rupp H., Zarain-Herzberg A., Maisch B. (2002) The use of partial fatty acid oxidation inhibitors for metabolic therapy of angina pectoris and heart failure. Herz 27, 621–636 [DOI] [PubMed] [Google Scholar]
- 41. Olsen J. V., Blagoev B., Gnad F., Macek B., Kumar C., Mortensen P., Mann M. (2006) Global, in vivo, and site-specific phosphorylation dynamics in signaling networks. Cell 127, 635–648 [DOI] [PubMed] [Google Scholar]
- 42. Stahmann N., Woods A., Spengler K., Heslegrave A., Bauer R., Krause S., Viollet B., Carling D., Heller R. (2010) Activation of AMP-activated protein kinase by vascular endothelial growth factor mediates endothelial angiogenesis independently of nitric-oxide synthase. J. Biol. Chem. 285, 10638–10652 [DOI] [PMC free article] [PubMed] [Google Scholar]
- 43. Ha J., Daniel S., Broyles S. S., Kim K. H. (1994) Critical phosphorylation sites for acetyl-CoA carboxylase activity. J. Biol. Chem. 269, 22162–22168 [PubMed] [Google Scholar]
- 44. Shinde A. V., Motiani R. K., Zhang X., Abdullaev I. F., Adam A. P., Gonzalez-Cobos J. C., Zhang W., Matrougui K., Vincent P. A., Trebak M. (2013). STIM1 controls endothelial barrier function independently of Orai1 and Ca2+ entry. Sci. Signal. 6, ra18. [DOI] [PMC free article] [PubMed] [Google Scholar]
- 45. Soboloff J., Rothberg B. S., Madesh M., Gill D. L. (2012) STIM proteins: dynamic calcium signal transducers. Nat. Rev. Mol. Cell Biol. 13, 549–565 [DOI] [PMC free article] [PubMed] [Google Scholar]
- 46. Tiruppathi C., Minshall R. D., Paria B. C., Vogel S. M., Malik A. B. (2002) Role of Ca2+ signaling in the regulation of endothelial permeability. Vascul. Pharmacol. 39, 173–185 [DOI] [PubMed] [Google Scholar]
- 47. Martin-Ramirez J., Hofman M., van den Biggelaar M., Hebbel R. P., Voorberg J. (2012) Establishment of outgrowth endothelial cells from peripheral blood. Nat. Protoc. 7, 1709–1715 [DOI] [PubMed] [Google Scholar]
- 48. Groschner L. N., Waldeck-Weiermair M., Malli R., Graier W. F. (2012) Endothelial mitochondria–less respiration, more integration. Pflugers Arch. 464, 63–76 [DOI] [PMC free article] [PubMed] [Google Scholar]
- 49. Berridge M. J., Bootman M. D., Roderick H. L. (2003) Calcium signaling: dynamics, homeostasis, and remodeling. Nat. Rev. Mol. Cell Biol. 4, 517–529 [DOI] [PubMed] [Google Scholar]
- 50. Rizzuto R., De Stefani D., Raffaello A., Mammucari C. (2012) Mitochondria as sensors and regulators of calcium signaling. Nat. Rev. Mol. Cell Biol. 13, 566–578 [DOI] [PubMed] [Google Scholar]
- 51. Wood P. G., Gillespie J. I. (1998) Evidence for mitochondrial Ca(2+)-induced Ca2+ release in permeabilized endothelial cells. Biochem. Biophys. Res. Commun. 246, 543–548 [DOI] [PubMed] [Google Scholar]
- 52. Stahmann N., Woods A., Carling D., Heller R. (2006) Thrombin activates AMP-activated protein kinase in endothelial cells via a pathway involving Ca2+/calmodulin-dependent protein kinase kinase beta. Mol. Cell. Biol. 26, 5933–5945 [DOI] [PMC free article] [PubMed] [Google Scholar]
Associated Data
This section collects any data citations, data availability statements, or supplementary materials included in this article.