

Abstract
Aberrant glycosylation-targeted disease biomarker development is based on cumulative evidence that certain glycoforms are mass-produced in a disease-specific manner. However, the development process has been hampered by the absence of an efficient validation method based on a sensitive and multiplexed platform. In particular, ELISA-based analytical tools are not adequate for this purpose, mainly because of the presence of a pair of N-glycans of IgG-type antibodies. To overcome the associated hurdles in this study, antibodies were tagged with oligonucleotides with T7 promoter and then allowed to form a complex with corresponding antigens. An antibody-bound specific glycoform was isolated by lectin chromatography and quantitatively measured on a DNA microarray chip following production of fluorescent RNA by T7-trascription. This tool ensured measurement of targeted glycoforms of multiple biomarkers with high sensitivity and multiplexity. This analytical method was applied to an in vitro diagnostic multivariate index assay where a panel of hepatocellular carcinoma (HCC) biomarkers comprising alpha-fetoprotein, hemopexin, and alpha-2-macroglobulin (A2M) was examined in terms of the serum level and their fuco-fractions. The results indicated that the tests using the multiplexed fuco-biomarkers provided improved discriminatory power between non- hepatocellular carcinoma and hepatocellular carcinoma subjects compared with the alpha-fetoprotein level or fuco-alpha-fetoprotein test alone. The developed method is expected to facilitate the validation of disease-specific glycan biomarker candidates.
Protein-attached glycans are bio-synthesized by a subset of glycosyltransferases mostly located in the endoplasmic reticulum and the Golgi apparatus, and play various functional roles at molecular and cellular levels including molecular interactions, stability, immune function, adhesion, etc. However, cumulative lines of evidence indicate that aberrant glycosylation is associated with various diseases including cancer (1), either by influencing the functionality of proteins and cells or as nonfunctional participants (2–4). Causal roles of aberrant glycosylation have been widely investigated in the development and progression of diseases, and significant progress has been made in the realm of cancer research (5). For these reasons, glycoproteins carrying aberrant glycans have been targets for the development of in vitro diagnostics (6).
Alpha feto protein (AFP)1-L3, a fucoform of AFP that is retained by the Lens culinaris lectin (LCA), is an extensively proven disease biomarker (7). AFP is frequently overexpressed in hepatic carcinoma cells and thus exists at high concentrations in blood of patients with hepatocellular carcinoma (HCC) (8). However, the onco-fetal protein is reported to surge even under non-tumor disease conditions such as inflammation or abnormal pregnancy (9, 10). This indicates a limited utility of AFP because of low specificity for prediction or diagnosis of HCC. Because it has been reported that the ratio of AFP-L3 to total AFP could be highly specific for HCC, AFP-L3 has been a preferred HCC biomarker to AFP levels and extensive investigations culminated in FDA-approval of an AFP-L3 lab test to determine the risk of developing liver cancer in patients with chronic liver disease (11). Besides AFP-L3, several glycan indicators of a relationship with cancer states including CA15-3 and CA19-9, have been reported in terms of relationship with cancer states (12, 13). Because of the potential pitfalls in the clinical use of the glycan biomarkers, the need to analyze cancer-specific changes in glycan structures and to use them as cancer biomarkers is thus increasing and this has to be met to ultimately treat cancer timely and efficiently (14).
However, the development of an aberrant glycosylation-based cancer biomarker has been hampered by the absence of an analytical tool to trace the protein glycan alterations in a sensitive and quantitative manner. Blood is the most preferred source for biomarker-based diagnostic tests, but it is often difficult to measure proteins of medium- or low-abundance levels at which most interesting biomarkers are believed to exist (15, 16). Given the high complexity and high dynamic range of proteins in blood, it is far more difficult to simultaneously measure a glycoform of multiple glycoproteins with significantly different levels in blood. A possible modality combining immunoprecipitation and a lectin blot analysis is far from meeting an analytical sensitivity required for blood tests. Moreover, antibody-based analyses, for example, the lectin-based enzyme-linked immunosorbent assay (lectin-ELISA) is not feasible for such purposes because of the presence of a pair of N-glycans on immunoglobulin G (17). A methodological breakthrough is thus needed to advance aberrant glycosylation-based cancer biomarker development in a clinical setting as well as to delineate the glycan structure-function relationship in basic research.
Herein, we report a novel quantitative method by which a specific glycoform can be quantitatively measured by using a DNA-tagged antibody and lectin chromatography. With this approach, we validated fucoform biomarkers through a case-control study in a sensitive and multiplexing manner. With the validation results as a basis, we suggested a fuco-index (If) obtained from triple biomarkers that can differentiate non-HCC and HCC more clearly than when AFP or AFP-L3 is used alone. To our best knowledge, it is the first report that aberrant glycan codes are utilized as an in vitro diagnostic multivariate index assay (IVDMIA) in the development of cancer biomarkers.
EXPERIMENTAL PROCEDURES
Stable Transfectants
Hep3B cells were transfected with plasmid vector constructs carrying the human FUT8 gene or shRNA for the gene using an electroporator (Neon™, Invitrogen) according to the manufacturer's instructions. The DNA sequences for shRNA are listed in supplemental Table S1. The stable clone was screened and established by RT-PCR and lectin blot analyses. Each clone was maintained at 37 °C in an RPMI 1640 medium containing 10% fetal bovine serum and 1% antibiotic solution (penicillin/streptomycin, WelGene Inc, Daegu, South Korea), supplied with 5% CO2. Mouse embryonic fibroblast (MEF) and the Fut8−/− mutant cell line were kindly donated by the Taniguchi group at the RIKEN. The human AFP gene was stably transfected into both the parental and knock-out cells as aforementioned.
Clinical Samples
Serum samples were obtained from various participants at the Pusan National University Yangsan Hospital, Korea with agreement to participate. The acquisition of samples was reviewed and approved by the Institutional Review Board (KRIBB-IRB-20110808-04). Subjects with HCV, alcohol abuse, or nonalcoholic steatohepatitis were excluded to minimize the associated confounding factors. Blood specimens of HCC patients were obtained pre-operatively and before administration of any drug. Blood samples were taken into Clot-activator-treated polypropylene vacuum capillary tubes (Vacuplus®, Medigene, Seoul, Korea) and then incubated at room temperature for 30 min. After centrifugation at 1100 × g for 10 min to remove fibrinogen aggregates and other cellular components, supernatants were collected, aliquoted, and frozen at −80 °C until use. Once thawed, blood samples were consumed, and no remnants were used for subsequent experiments.
Western and Lectin Blot Analyses
Proteins were resolved on 10-12% SDS-PAGE gels and electrically transferred onto PVDF membranes (Immobilon-P, Millipore). The membranes were blocked in TBS buffer containing 0.05% (v/v) Tween 20 plus 5% (w/v) skim milk for Western blot or 3% (w/v) BSA for lectin blot. Anti-A2M (Santa Cruz Biotechnology, Santa Cruz, CA) and anti-AFP (Abcam, Cambridge, UK) antibodies were used as primary antibody, and biotin-conjugated Aleuria aurantia lectin (AAL) and Lens culinaris lectin (LCA) were used to probe glycan moieties. After incubation with HRP-labeled secondary antibodies (Cell Signaling Technology Inc., Danvers, MA) or HRP-avidin conjugates (Vector Laboratories, Inc., Burlingame, CA), membranes were allowed to react with ECLTM Western blotting detection reagents (GE Healthcare, Hertfordshire, UK) and exposed to an x-ray film for 1–2 min.
Reverse-transcription PCR
Total RNA was extracted from cells using an RNeasy Miniprep kit (Qiagen, Hilden, Germany), quantified, and used for synthesis of cDNA, which was used as templates for RT-PCR. cDNA was synthesized from the total RNA using a reverse-transcription kit (Nanohelix, Daejeon, South Korea), and 2 μg of cDNA was used for PCR. A gene-specific primer pair with sequences of 5′-TGATGCCTCTGCAAACTTCC (forward) and 5′-CGTCCTTCCCAATTTCCTGT (reverse) was used to measure the mRNA level of the human FUT8 gene.
Conjugation of Oligonucleotides to Antibodies
Double-stranded oligonucleotides were prepared by incubating 10 μl each of biotinylated 70-mer oligonucleotides (100 pm) with 40-mer oligonucleotides (100 pm) with unique sequences and a hydrazine-modified 30-mer oligonucleotide (100 pm) containing T7 promoter sequences in a thermocycler (MyCycler, Bio-Rad). Ten micrograms of antibodies was treated with 1 m NaIO4 in PBS buffer under complete darkness. The oxidized antibodies were incubated with the double-stranded oligonucleotides at room temperature for 12 h and the formed aldehyde-hydrazine linkage was stabilized by treatment with 5 mm NaBH4 at room temperature for 1 h. The DNA-tagged antibody fraction was prepared and preserved following desalting on a Zeba desalting column with a molecular weight cut-off of 5 kDa (Thermo Scientific).
Immunoprecipitation and Lectin Chromatography
Secreted proteome was retrieved from the conditioned medium of Hep3B or HepG2 cells following filter-concentration using a Centricon filter (Millipore) with a molecular weight cut-off of 10kDa. For detection of targets in sera, serum samples were precleared with Protein G-coupled Sepharose beads (Millipore) at 4 °C, and the supernatants were retrieved for immunoprecipitation. One hundred microliters of the conditioned media or the precleared, PBS-diluted serum was incubated with 5 μg of an oligonucleotide-tagged anti-alpha-2-macroglubulin (Santa Cruz Biotechnology), anti-AFP (Abcam), and anti-hemopexin (Abcam) monoclonal antibodies for 2 h at 4 °C. Antibody-antigen complex was separated on various lectin columns. Beads were extensively washed with 1 ml of PBS at 4 °C. The bound antibody-antigen complexes for lectin chromatography were either eluted or assayed as a bound form on lectin beads. The beads-bound glycoforms were directly used for T7 polymerization reactions and lectin/Western blot analyses following extensive washing.
Synthesis of RNA Transcripts
RNA transcripts were synthesized using a T7 RNA polymerase kit (Promega, Madison, WI) according to the manufacturer's instruction. Briefly, DNA-tagged antibodies alone or antigen-bound antibody conjugates were incubated at 37 °C in the presence of 20 units of T7 polymerase in 50 μl of reaction buffer containing 40 mm Tris (pH 7.9), 6 mm MgCl2, 2 mm spermidine, 10 mm DTT, 10 mm NaCl, and 0.25 mm UTP-depleted NTPs plus either 0.25 mm Cyanine3- or Cyanine5-UTP (Enzo Life Sciences, Inc., Farmingdale, NY).
DNA Microarray
Amine-coated slides (Luminano) were incubated in 1% (w/v) glutaraldehyde (Sigma-Aldrich, St. Louis, MO) in PBS for 2 h, washed with distilled water, and air-dried. Oligonucleotide probes as listed in supplemental Table S1 were dissolved at 50 pm in 3×saline sodium citrate (SSC) buffer containing 0.05% SDS and spotted on a slide using a microarray machine (Proteogen, Seoul, Korea). After spotting, the slides were incubated in a humidity chamber (≥ 60% humidity) at room temperature for 12 h, blocked by 2 mg/ml NaBH4 for 5 min, washed by 0.2% SDS for 5 min, and air-dried. The RNA transcripts were diluted with a hybridization solution (5×SSC and 0.5% SDS) and hybridized with probes on a microarray chip with a coverslip at 55 °C for 12 h. The coverslips were removed and then the slides were washed with 2×SSC and 0.1% SDS for 10min and air-dried. Slides were scanned in a fluorescence scanner (GenePix 4200 professional, Axon, Molecular Devices, USA). The fluorescence intensity was measured using GenePix Pro 6.1 software (Axon).
Enzyme-linked Immunosorbent Assay
ELISA kits for AFP and alpha-2-macroglobulin (A2M) were purchased from Abcam and hemopexin (HPX) from USCN. All assays were performed basically according to the manufacturers' recommendations. Sera were diluted 2-, 50-, and 200- fold prior to assay with PBS for AFP, HPX, and A2M, respectively.
Statistical Test
All statistics were conducted with MedCalc software (Mariakerke, MedCalc Software bvba, Belgium) including the derivation of the receiver operating characteristic (ROC) curve and the area under the ROC (AUROC) values. The diagnostic performances were compared by constructing the ROC curve, from which the AUROC values and sensitivity and specificity that best discriminate between non-HCC and HCC were derived. p < 0.05 was considered statistically significant.
RESULTS
Scheme for Development of Analytical Method to Quantify Glycoproteins with a Specific Glycan Structure
Many lines of evidence indicate that a subtle change in protein–glycan structures is associated with biological functions and various diseases (1, 14, 18). Although protein glycan synthesis is a nontemplate process and thus the glycan structures are heterogeneous, it is still necessary to identify and quantify specific glycoforms. Because an aberrant glycoform can be developed as a disease-specific biomarker, a multiplexing technique with high analytical sensitivity and specificity is increasingly demanded in the biomarker development pipeline. These unmet needs prompted us to develop an analytical method to quantify biomarkers of interest with a specific glycan structure.
For this, immunoglobulin G-type antibodies were tagged with a double-stranded oligonucleotide with an identifiable DNA sequence at the core mannosyl residues of N-glycan in antibody (Fig. 1A). The IgG-type antibodies have a pair of N-glycans at the CH2 domain in the constant region of the heavy chain. The mannosyl dihydroxyl groups are oxidized by NaIO4 treatment, thereby generating paired aldehyde groups following ring opening (19), and these groups participate in covalent bonding with a hydrazide functional group at the 5′-end of an oligonucleotide (Fig. 2B). The double-stranded oligonucleotides are comprised of a pair of nucleotides, one of which has a T7 promoter and an identifiable unique mRNA coding sequence. The unique coding sequence serves as a barcode and is used to specify an antibody and the bound antigen. The overall procedure for quantification of targets is depicted in Fig. 1C; the DNA-tagged antibody is admixed with biofluidic sources of biomarkers, usually blood or conditioned media, which are pretreated with RNase. A DNA-antibody-antigen complex is trapped on a lectin affinity column through interactions between glycans on an antigen and a lectin. The DNA-tagged antibody is co-eluted with an antigen during the elution step, and the amount of eluted antibody is proportional to that of a lectin-bound glycoform of an antigen. Accordingly, a specific glycoform of an antigen can be quantified from the co-eluted, DNA-bound antibody, which is used as a template for T7 transcription to produce fluorescent transcripts. The transcripts are specifically identified and quantified on a DNA microarray chip.
Fig. 1.

Overall scheme for quantitation of a specific glycoform in bio-fluids using DNA-tagged antibodies. A, A pair of N-glycans of an antibody are oxidized with NaIO4 and then coupled with double-stranded oligonucleotides containing T7 promoter sequences. For multiplexed tests, a probe mixture is prepared from multiple DNA-tagged antibodies, each of which has a distinct DNA sequence for identification. B, The covalent bond is formed from an aldehyde group in N-glycans of an antibody and a hydrazide group at the 5′ of the oligonucleotides. The bond is stabilized with NaBH4 treatment. The oligonucleotide is a double-stranded DNA composed of a single strand with a T7 promoter and a unique sequence and its complementary strand with biotin at the 5′-terminus. C, The probe mixture is mixed with a bio-fluid such as serum or conditioned media to allow the formation of biomarker-antibody complexes. The biomarker-antibody complexes are purified on a lectin column and used as a template for T7 transcription. Fluorescent dye-labeled UTP is used and the produced transcripts are quantified on a DNA microarray chip.
Fig. 2.

Attachment of a DNA tag to the N-glycan of an antibody and the resultant erasure of lectin-bound glycan moieites. A, N-glycans of an anti-AFP antibody was oxidized with 1 m NaIO4 to yield aldehyde functional groups, which were reacted with either hydrazine biotin or 5′-hydrazine double-stranded oligonucleotide labeled with biotin. The formed bond was stabilized in the presence of 5 mm NaBH4. Tagging was confirmed by an immunoblot analysis using HRP-conjugated streptavidin. B The erasure of lectin-bound glycan moieties was tested by lectin-affinity chromatography. The DNA-tagged antibody was run on a Con-A column with a minimal flow rate and the presence of the DNA-tagged antibody was tested by ab immunoblot analysis. The DNA-tagged antibody was found only in the pass-through (P) and washing (W) fractions, but not in the elution (E) fractions. C, The DNA-tagged anti-AFP antibody was incubated with AFP to form an antigen-antibody complex, and the complex was again run on a Con-A column under the same protocol as that in B. The lectin blot analysis indicates the binding of the complex on a Con-A column. D, The binding of either intact or DNA-tagged antibody with various lectins was tested including Con-A, LCA, AAL, DSA, l-PHA, E-PHA, SSA, and E-selectin. The lectin beads were precipitated by centrifugation and the lectin-bound antibodies were assessed by an immunoblot analysis. Relative binding in the y axis indicates the ratio of lectin-bound antibodies to the starting amounts after three rounds of washing with PBS. Values are means of three independent experiments with standard error.
It was assumed that this method would be compatible with multiplexed and highly sensitive quantification of targeted glycoforms. Multiplexity becomes possible by using probe cocktails containing a mixture of DNA-tagged antibodies.
An Antigen-unbound DNA-tagged Antibody does not Participate in the Quantification
As described in Fig. 1, the DNA-antibody-antigen complex can be captured through antigen-attached glycan-lectin interactions. An analytical validation of our method began with tagging an anti-AFP monoclonal antibody with oligonucleotides labeled with biotin. The DNA-tagging procedure consists of a consecutive step comprising oxidation with NaIO4, covalent bonding between aldehyde-hydrazine groups, and stabilization with NaBH4. The aldehyde-hydrazide reaction was found to occur spontaneously by simple incubation as assessed by incubation with biotin hydrazide. The Western blot analysis indicates that, despite the marginal presence of a heavy chain with two molar nucleotides bound, the heavy chain of an antibody was linked with oligonucleotides with a 1:1 stoichiometry (Fig. 2A), which may be explained by competition between mannose-oligonucleotide binding. It appears that the attachment of one oligonucleotide molecule confers significant hindrance to the attachment of another.
For a targeted glycoform of a biomarker to be quantified by RNA transcripts that are produced from the antibody-tagged DNA as a template, it is critical that any free DNA-antibody conjugates, that is, an antigen-unbound form, be separated from the DNA-antibody-antigen complex. To this end, a binding test was performed where the DNA-tagged antibody was run on a concanavalin-A (Con-A) column and the presence of the DNA-tagged antibody was investigated in all fractions. As seen in Fig. 2B, antibody was not detected in the elution fractions, indicating that the DNA-tagged antibody can be removed from Con-A beads by simple washing. It is assumed that the lectin-glycan interactions were disturbed by alterations in the N-glycan structure of the antibody during the oxidation and attachment of bulky oligonucleotides. In contrast, the AFP-antibody complex was captured on a Con-A column (Fig. 2C). These results indicate that glycans of AFP, but not of the antibody, participated in the lectin-affinity chromatography, thereby supporting the notion that a specific glycoprotein can be quantified without the interference of free DNA-tagged antibody.
Next, we examined which lectin-glycan interactions were disturbed by the DNA-tagging procedure, because it is necessary to define the types of lectins that are applicable without background during assays. To this end, five lots of commercially available monoclonal antibodies were tagged with oligonucleotides and their lectin-binding properties were monitored (Fig. 2D). It was found that lectins recognizing the glycan moiety including the core N-glycan structure were applicable to our strategy, including Con-A, LCA, L4-PHA, and E4-PHA. Some lots of antibodies still carry affinity with AAL and DSA. None of the antibodies were affected in the interaction with SSA. It was interpreted that there exists a fraction of antibodies that carry a certain glycoform that is not affected by DNA attachment. However, when precleared with the corresponding lectins, the undesirable glycoforms of the antibody could be completely removed, and thus a few rounds of a preclearing step allowed most antibodies to be applicable to our purposes (supplemental Fig. S1), except for sialic acid-binding lectins. Because most commercially available and home-made antibodies are not quality-controlled for glycan structures, the preclearing step should be accompanied for analytical robustness and reproducibility.
Production of Transcripts by T7 RNA-polymerase Using an Antibody-attached Oligonucleotide as a Template
Double-stranded oligonucleotide attached to an antibody has a T7-promoter sequence that enables production of transcripts by a RNA-polymerization reaction. When incubated with a DNA-tagged antibody, T7 RNA-polymerase synthesized transcripts in the presence of NTPs (Fig. 3A). A detectable amount of molecules were observed in the absence of NTPs; this turned out to be a fraction of oligonucleotides that had been attached to antibodies and leaked during incubation. Treatment with DNase could remove the DNA molecules and thus any possible interference in the analysis on a DNA microarray chip (Fig. 3B). The produced molecule was confirmed to be RNA transcripts by RNase treatment.
Fig. 3.

Production of RNA transcripts using the antibody-bound oligonucleotides as a template. A, The DNA-tagged antibody was incubated with T7 polymerase in the presence or absence of NTPs. The transcribed products were run on a 2.0% (w/v) agarose gel. B, Production of RNA transcripts were confirmed by treatment with DNase, RNase, or RNase inhibitor. The transcripts produced in the presence of NTPs and RNase inhibitor were not observed when RNase, not DNase, was added. C, The time-course production of RNA transcripts was monitored on an agarose gel. The RNA production was nearly saturated 20 min after on-set of T7 transcription.
The production of transcripts was assessed with reaction time. It increased with time and became saturated after 30 min of incubation (Fig. 3C). The T7 polymerase reaction time was fixed at 30 min for the ensuing experiments.
An Analytical Feasibility Test
To test the feasibility of our method, stable cell lines of Hep3B with overexpression or down-regulation of fucosyltransferase 8 (hFUT8) gene were generated by either forcible expression of hFUT8 gene or a short hairpin RNA for hFUT8. Data obtained from the real-time PCR indicated the establishment of two stable cell lines (Fig. 4A). For a more quantitative analysis, quantitative real-time PCR was performed. From the analysis, the relative expression ratios for up- and down-regulation cells were 8.39 ± 1.70 and 0.47 ± 0.12, respectively, when compared with the expression level of parental cells (Fig. 4B). Total secreted proteins were prepared from conditioned media of stably transfected and parental cells, and each protein preparation was differently diluted so that the input of A2M was equal as assessed by an immunoblot analysis (Fig. 4C). An equal amount of A2M was subjected to immunoprecipitation and the immunoprecipitated proteins were blotted against anti-A2M and AAL. Even though A2M was detectable by an immunoblot analysis, the fucoform of A2M could not be detected in these conditions. In contrast, our method using DNA-tagged anti-A2M antibody could differentiate the fucosylation status under the same conditions as those for the immunoblot, and the measured levels were proportional to the values obtained from the quantitative RT-PCR (Fig. 4D). In addition to high sensitivity, specificity was also obtained in the assay, where the RNA transcript of interest was detected on an intended spot only.
Fig. 4.

Highly sensitive and quantitative detection of fucoforms for alpha-2-macroglobulin in Hep3B cells with a varied expression of FUT8. A–B, Fucosyltrasferase 8 (FUT8) was stably over-expressed or down-regulated by transfection of an FUT8 vector construct or shRNA, respectively, into Hep3B cells. The alterations of FUT8 transcription levels were assessed by reverse-transcription polymerase chain reaction. The quantitative analysis indicates an 8.39-fold increase and 53% suppression by stable transfection and RNA interference, respectively. C, A2M expression was confirmed by an immunoblot analysis. Equal amounts of A2M were subjected to immunoprecipitation using an anti-A2M antibody, and the immunoprecipitated proteins were investigated by blots against an anti-A2M antibody and the core-fucose-reactive AAL. D, The same amounts of A2M as in C, were used to bind to a DNA-tagged anti-A2M antibody. The A2M-antibody complexes were allowed to bind again on AAL-column beads, and the fluorescent RNA transcripts were produced in the presence of cy3-UTP and the bound complexes as a template. The produced transcripts were quantified on a microarray chip.
Despite the evidence presented in Fig. 4, we reasoned that the feasibility of our method should be tested in a more demonstrative setting. Fig. 4 shows that the fucosylation level of A2M could be differentiated between the parental and shFUT8 cells. A characteristic of protein glycosylation is that the level of a specific glycoform may differ depending on the availability of substrate, cell conditions, etc. As shown in Fig. 5A, the glycan level is not likely to be uniformly altered by shFUT8, and there appears to be a subset of proteins that show an equivalent or even higher level of fucosylation in the FUT8 knock-down cells, compared with the parental cells. Because these nonanalytical variations need to be controlled for improved test robustness and reproducibility of our method, we performed a feasibility study with FUT8-knockout cells in comparison with the parental cells. A lectin-blot analysis using AAL confirmed the complete disappearance of fucosyltransferase activity (Fig. 5A). Human AFP was forcibly expressed in both cell lines and purified (purity≥95%) on an anti-hAFP antibody-coupled affinity chromatography column (Fig. 5B). The core-fucosylated and fucosylation-null hAFP were expressed in the parental and MEF:FUT8−/− cells, respectively.
Fig. 5.

Improved sensitivity of the DNA-tagged antibody-based approach compared with the immunoprecipitation-immunoblot modality. A, Conditioned media were retrieved from Hep3B cells with either endogenously expressed or interfered levels of FUT8 expression. Media were also taken from the wild-type and FUT8-knockout MEF cells. Responses of each secretome were tested against ALL. B, Human AFP gene was forcibly expressed in either wild-type or FUT8-knockout MEF cells. The recombinant hAFP was purified on an anti-hAFP antibody-conjugated column and the binding property in each fraction was investigated using an anti-hAFP antibody and ALL. HepG2 cells were used as a positive control because the cell line shows a high expression of FUT8. C, The analytical sensitivity for the detection of fucoforms was investigated through the immunoprecipitation (IP)-lectin blot modality. The conditioned media retrieved from the wild-type or FUT-knockout cells were subjected to immunoprecipitation using an anti-hAFP antibody with protein inputs in a range of 0–300 μg. Cy3-labeled secondary antibody was used for sensitive detection. D, The analytical sensitivity for the detection of fucoforms was also investigated by the DNA-tagged antibody-based approach using the same conditioned media as used for C. Sub-microgram levels of proteins were sufficient for fuco-hAFP to be detected on a DNA microarray chip. E, The analytical sensitivity of the DNA-tagged antibody-based approach was compared with that of IP-lectin blot modality. The inset indicates the fluorescence intensities according to varied protein amounts used for the IP-lectin blot analysis as described in C. Compared with the result obtained from an extrapolated curve for the IP-lectin blot analysis, the DNA-tagged antibody-based approach allowed an approximately 114-fold increment in the analytical sensitivity in the measurement of hAFP fucoforms. Values are means of three independent experiments with standard error.
Next, we compared the analytical sensitivity of our method with that of immunoprecipitation coupled with a lectin-blot analysis on a fluorescence basis. Various amounts of secreted protein concentrates were subjected to immunoprecipitation with an anti-hAFP antibody and resolved on a SDS-PAGE gel (Fig. 5C). The hAFP bands were visualized with a secondary antibody labeled with a fluorescent dye. As expected, only hAFP produced from the parental MEF cells was detected by AAL and a threshold value was observed at around 50 μg of total proteins. When the same sample was used in our method, less than 1 μg of total proteins was sufficient for quantitative measurement of the fucoform of hAFP (Fig. 5D). An extrapolation indicates an approximate 114-fold increase in the analytical sensitivity (Fig. 5E). An increased analytical sensitivity of our method was also confirmed by an experiment using a serum specimen (supplemental Fig. S2). Possible modalities for quantification of a glycoform were compared including immunoprecipitation/lectin blot analysis, ELISA test using Fab fragment antibody as capture antibody, ELISA test using PNGase-F-treated capture antibody, and chemical labeling methods. Our method showed a far higher analytical sensitivity compared with the other modalities. ELISA tests using PNGase-F treated capture antibody and chemically labeled capture antibody also turned out to be incompatible to this analytical purpose because of significantly high threshold values. Besides analytical sensitivity, our method was shown to be most compatible to the quantitative measurement of a glycoform; ELISA tests using PNGase-F treated capture antibody and chemically labeled capture antibody showed significantly high threshold values, which is thought to arise from the incomplete PNGase-F cleavage and chemical binding reactions, respectively. Furthermore, a reproducibility test (n = 9 for each concentration) resulted in an average coefficient of variation (CV) of 9.65% (supplemental Table S2). We concluded that our method is suitable for a quantitative analysis of an otherwise undetectable specific glycoform of a biomarker in bio-samples.
Clinical Application and Cross-validation
To apply our method to the quantitative analysis of a fucoform of a biomarker, a standard curve was drawn from cy3- and cy5-labeled RNA transcripts produced in separate tubes containing an antibody with an identical DNA template. The ratios of the template were varied from 10:0 to 0:10, and the RNA transcripts produced from each template were mixed. The fluorescent intensity of the RNA mixture was measured on a DNA microarray chip (Fig. 6A). Linearity at a log scale was observed with R2 = 0.99 between the template ratio and the Log2 ratio of fluorescence intensity at 532 nm and 635 nm in a ratio range of 1:9 to 9:1 (Fig. 6B). Standard curves were separately obtained in external ranges of 1:100–1:9 and 9:1–100:1 (supplemental Fig. S3).
Fig. 6.

Application of the DNA-tagged antibody-based glycol-detection method to clinical specimens. A, An antibody with a DNA tag was split into two vials with varied ratios ranging from 10:0 to 0:10. RNA transcripts were produced in each vial using cy3- or cy5-labeled UTP and the transcripts were quantified on a DNA microarray chip with triplicate probe spots. B, A standard curve was drawn from the fluorescent intensity obtained from A. The log2 ratio of fluorescence intensity at 532 nm and 635 nm was plotted against two template ratios with a range of 1:9 to 9:1. Linearity was observed at a logarithmic scale with a correlation coefficient (R2) of 0.99 (n = 3) and a separate standard curve was obtained outside the ranges, as seen in supplemental Fig. S3. C, Fucoforms of AFP, hemopexin (HPX), and alpha-2-macroglobulin (A2M) were simultaneously analyzed from a control and an HCC specimen. The separately produced transcripts were pooled and spotted on a microarray chip with a control and each target-complementary sequence. Cy3- and cy5-UTP were used for HCC and control specimens, respectively. D, The log2 ratio of fucoforms obtained from C was plotted together with that of the serum level of the three biomarkers, which was derived from the ELISA results. The normalized fucoform ratios were derived from equation 1. E, The normalized fucoform ratios of the three biomarkers were plotted for 196 specimens obtained from 41 healthy volunteers, 29 hepatitis B, 34 cirrhosis, and 92 HCC patients. Each result is an average value of triplicate tests.
Our unpublished results revealed that AFP, HPX, and A2M were differentially fucosylated depending on the disease states in the liver. We attempted to apply our method to clinical validation of the biomarker candidates. Oligonucleotides with a specified DNA sequence were labeled to one of anti-AFP, HPX, or A2M antibodies and a mixture of the DNA-tagged antibodies was reacted with their respective antigens in both non-HCC and HCC sera. After isolating the antigen-antibody complexes on an AAL-conjugated column, RNA transcripts were produced using cy3 (HCC) or cy5 (non-HCC)-labeled UTP from the oligonucleotides as a template, and the ratio of fluorescence intensity was measured on a microarray chip, as seen in Fig. 6C. The representative results showed a higher fucosylation ratio for each biomarker candidate in HCC serum. The ratios of the fucoforms were calculated from the relative fluorescence intensity, as fitted from the standard curve shown in Fig. 6B.
We hypothesized that the level of a fucoform may be a discriminator when normalized by the total amount of biomarker proteins. Accordingly, a logarithmic ratio of the normalized fucoform can be derived by the following equation.
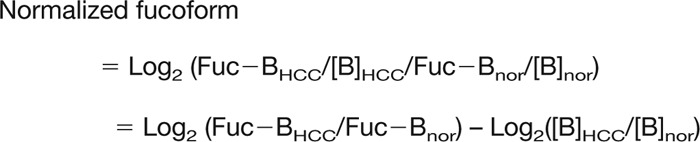 |
[where Fuc-B and [B] indicate the fucoform and total amount of the biomarker (B), respectively, in normal (nor), or hepatocellular carcinoma (HCC) sera].
As expressed in the above equation, the normalized fucoform ratio was calculated by subtracting the Log2 ([B]HCC/[B]nor) from the Log2 (Fuc-BHCC/Fuc-Bnor) value. This equation can be interpreted that the fucoform ratio is normalized by the abundance ratio. This normalization is necessary in that a simple change in abundance without alterations in fucosylation was more often than not observed in non-HCC specimens. This often brings about a misinterpretation that a fucoform appears to change. Normalization by an amount ratio (that is, Log2 ([B]HCC/[B]nor), which was obtained from ELISA tests, serves to rule out a possibility of such false positivity for non-HCC specimens and thus to enhance specificity of our method. Fig. 6D shows the Log2 ratios of a fucoform, the total amount, and the normalized fucoform for AFP, HPX, and A2M in a clinical specimen used in Fig 6C. We performed a larger-scale validation with 196 sera consisting of 104 non-HCC and 92 HCC sera. The non-HCC sera are again composed of sera obtained from 41 healthy volunteers, 29 hepatitis B patients, and 34 cirrhosis patients. Subjects with HCV infection, NASH, and a record of alcohol abuse were excluded, and the number of HBV subjects was set to be almost equal (p < 0.05) between non-HCC and HCC. Their baseline characteristics are provided in Table I. In this case-control study, sera of three healthy volunteers who showed no indications for liver diseases in the blood tests and developed no liver-associated diseases during 5-year follow-ups were combined and used for reference sera. Their baseline characteristics are described in supplemental Table S3. Fig. 6E shows the normalized fucoform ratio for AFP, HPX, and A2M obtained from the fucoform ratio. The abundance ratios used for normalization are shown in supplemental Fig. S4, and one can follow up how the normalized fucoform ratios for AFP were derived by measuring on microarray chips and ELISA tests through supplemental Table S4. The normalized fucoform ratio shows an increasing tendency as liver disease advances from healthy conditions to hepatocellular carcinoma. In addition, there was a distinct fucoform pattern for HCC, as differentiated by the pattern for healthy volunteers and non-HCC patients.
Table I. Baseline characteristics of the subjects.
| Characteristic | Non-HCC (n = 104) |
HCC (n = 92) | ||
|---|---|---|---|---|
| Healthy volunteers (n = 41) | Chronic hepatitis B (n = 29) | Cirrhosis (n = 34) | ||
| Age (yr) | 42 ± 13 | 45 ± 11 | 48 ± 9 | 49 ± 10 |
| Gender (M/F) | 28/13 | 21/8 | 25/9 | 66/26 |
| Etiology | ||||
| HBV | 0 | 29 | 34 | 69 |
| HCV | 0 | 0 | 0 | 0 |
| Alcohol | 0 | 0 | 0 | 0 |
| NASH | 0 | 0 | 0 | 0 |
Statistical Analysis Proves Clinical Validity of a Fuco-index Obtained from the AFP/HPX/A2M Test
An in vitro diagnosis multivariate index assay (IVDMIA) is defined as a test that “combines the values of multiple variables using an interpretation function to yield a single, patient-specific result that is intended for use in the diagnosis of disease or other conditions, or in the cure, mitigation, treatment, or prevention of disease” (20). Although there are ongoing debates surrounding the issue, the concept is based on the premise that combined information derived from multiple biomarkers may be mutually complementary and outperform any individual biomarker. We tested whether this approach would render enhanced diagnostic performance for HCC when applied to our method.
Each of the normalized fucoform values for AFP, HPX, and A2M was variably weighted and fuco-indices were calculated from the sum of the weighted values. Modeling to derive the best diagnostic performance resulted in weight values of 0.53, 0.29, and 0.18 for AFP, HPX, and A2M, respectively. The overall diagnostic fuco-index (If) was derived from the equation in Fig. 7A. Fig. 7B shows a dot plot for the distribution of the indices derived from 196 clinical specimens. The If index values lay in the range of approximately −0.5–2.5, and the cut-off value of 0.38 gave sensitivity and specificity of 83.7% and 86.5%, respectively. The receiver operating curve revealed a significantly improved diagnostic performance for the fuco-index in this case-control study, compared with the diagnostic values for the AFP level or AFP-L3 alone (p < 0.001). The area under ROC value was 0.889 for the fucoform index, which was significantly higher than those obtained from the AFP-L3 (0.809) and AFP level (0.723) tests (Fig. 7C). The ROC curves and related AUROC values are compared with different combinations of weight values in supplemental Fig. S5, and a statistical analysis showed that a weight combination of 0.53/0.29/0.18 gives the highest AUROC value. As summarized in Table II, the ROC-based statistical analysis indicates improved diagnostic performance for HCC with sensitivity and specificity values of 83.7% and 86.5%, respectively, when compared with those derived by either AFP level or AFP-L3 alone. Significantly improved sensitivity was achieved by the panel of biomarkers over AFP-L3 with 77 cases diagnostically positive among 92. More importantly, improvements in both sensitivity and specificity were achieved over the AFP-level test with 90 negative results among 104 non-HCC subjects (Fig. 7D). The preliminarily built model needs to be further validated in an independent test set so that the model can be fixed and universally applied to diagnostic purpose for HCC. For this, we prepared an independent test set comprising 27 non-HCC (13 normal, six hepatitis B, and eight cirrhosis specimens) and 23 HCC specimens collected from an independent hospital and measured the fucoform ratio and protein levels using the DNA-tagged antibody method and ELISA, respectively. We also applied the same equation 1 and formula in Fig. 7A to the test set to derive the normalized fuco-indices for the respective biomarkers and the fuco-index (If), respectively. The application of this identical method to the independent test set also showed a similar diagnostic performance to that of the training set, yielding a sensitivity of 82.6% and a specificity of 81.4% with an AUROC value of 0.857. Not only did the use of any of individual biomarkers yield a lower AUROC value, but the application of the formula in Fig. 7A also gave the best diagnostic performance in terms of sensitivity, specificity and AUROC (supplemental Fig. S6), demonstrating that our method was fixed and established for subsequent applications to other sample sets.
Fig. 7.

Derivation of a fuco-index through an in vitro diagnostic multivariate index assay and the classification performance among HCC and non-HCC specimens. A, A fuco-index (If) was derived from an algorithm with weight values of 0. 53, 0.29, and 0.18 for AFP, HPX, and A2M, respectively. The ROC curve was simulated with varied weight values and the fixed weight values were obtained from the highest AUROC. B, The fuco-index was dot-plotted for non-HCC and HCC specimens. C, AFP level alone, AFP focuform ratio, and the fuco-index were used to derive ROC curves. The AUROC value obtained from the If was 0.889, which was significantly higher than the values for the fucoform ratio and AFP level alone (0.809 and 0.723, respectively) (p < 0.001). D, The IVDMIA analysis resulted in diagnostic performance for HCC with sensitivity and specificity values of 83.7% and 86.5%, respectively, where 77 of 92 cases were diagnostically positive, and 90 of 104 non-HCC subjects were negative. E, The previously built model was applied to a test set to validate in an independent set, which comprised 27 non-HCC (13 normal, six hepatitis B, and eight cirrhosis specimens) and 23 HCC specimens, and were collected independently of the training set (i.e. 196 specimens). The results gave a similar diagnostic performance to that of training set with a sensitivity of 82.6% (versus 83.7%) and a specificity of 81.4% (versus 86.5%).
Table II. Diagnostic performances of If index for HCC.
| Fuc-{AFP,HPX,A2M} | Fuc-AFP | AFP | |
|---|---|---|---|
| AUROC (S.E.) | 0.889 (0.0261) | 0.809 (0.0343) | 0.723 (0.0377) |
| 95% CI | 0.836–0.929 | 0.746–0.861 | 0.655–0.784 |
| Sensitivity (%) | 83.7 | 75.0 | 64.1 |
| Specificity (%) | 86.5 | 83.7 | 72.1 |
| p value | p < 0.001 | p = 0.048 | N/A |
| (vs. AFP and Fuc-AFP) | (vs. AFP) |
Taken together, the present results indicate that our method provides a sophisticated and sensitive way of measuring the levels of specific glycoforms of biomarkers. The analytical validity of our method was cross-validated by proving the clinical validity of the triple-biomarker fuco-index for HCC in a case-control study. The fuco-index (If) derived from the normalized fucoform level of AFP, HPX, and A2M rendered improved discriminatory power over the existing diagnostic options at hand.
DISCUSSION
Aberrant protein glycosylation has been observed during cancer development and progression and the pathological implications of aberrant glycosylation have been elucidated in several functional studies (2, 21–23). One of the best characterized features is the role of aberrant glycans of tissue inhibitor of metalloproteinase-1 during invasion of colon cancer cells (2). The tetra-antennary adducts created by GnT-V play an interfering role in the tissue inhibitor of metalloproteinase-1/gelatinases interactions, thereby resulting in elevated gelatinase activity and enhanced invasive potential in colon cancer. Given the functional role of aberrant glycosylation in cancer, many groups have attempted to utilize pecific glycoforms as cancer biomarkers for various clinical purposes. Despite the plausibility of this strategy, rapid progress has not been made, particularly because of the absence of an efficient validation method that guarantees sensitive traceability of aberrant glycosylation, compatibility with multiplexed analysis, and analytical robustness.
One feasible analytical platform would be to modify sandwich ELISA by replacing the primary antibody with various lectins of interest. However, there is a critical problem about platform in that immunoglobulin G-based antibodies used as a capture antibody have a pair of N-glycans (17) and that lectin can bind to the capture antibody, thereby interfering with intended biomarker-lectin interactions. Several approaches to remove the lectin-bound N-glycan have been explored (24–26), but they require time-consuming steps and are inefficient for various reasons. Firstly, PNGase-F treatment has been attempted to enzymatically cleave N-glycans off an IgG molecule to generate deglycosylated antibody, but the enzymatic reaction is quite inefficient: N-glycans of an IgG molecule is located inside a pair of Fc domains and thus PNGase-F treatment produces quite a small fraction of deglycosylated IgGs. Denatured conditions using detergents following reducing agents enhances the cleavage process but it adversely affects the binding properties of an antibody. The cleavage of glycan-containing Fc region from IgGs would provide another option to address the interference by N-glycan. However, the digestion is imperfect and, moreover, an additional clearing step based on protein-A or G affinity chromatography should be accompanied to remove the cleaved Fc fragments. A significant amount of loss of antibodies could occur during the clearing step and the integrity of antibody may not be preserved because of relatively harsh elution conditions of low pH. Lastly, chemical modifications of N-glycans using small molecules are conceptually similar to our method, but the applications were not proven for various lectins. On the contrary, our method was applied under chemically mild conditions and, more importantly, compatible to the usage of most lectins, except for such sialic acid-bound lectins as SSA, through a simple DNA-tagging procedure (Fig. 2 and supplemental Fig. S1). Another possible platform would be to combine immunoprecipitation (IP) and a lectin-blot analysis, as shown in Fig. 5C. However, this method did not appear to be sensitive enough to monitor a specific glycoform of sparse proteins. In particular, it was thought to be even more difficult to apply the IP/lectin blot method to validate glycan biomarkers in serum or plasma that shows a significantly high dynamic range of proteins and severe complexity. Compared with the IP/lectin-blot method, our method showed far higher analytical sensitivity, which was demonstrated for biomarkers both from conditioned media and sera (Figs. 5D–E and 6, supplemental Fig. S2). We expect that our method can also be applied to the monitoring and validation of various lectin-traceable aberrant glycosylations of biomarkers, thereby advancing aberrant glycosylation-targeted biomarker development.
Biomarker development pipeline is believed to consist of three distinct phases as proposed by Rifai et al. (15); initial discovery phase, prevalidation phase including verification and qualification, and final validation phase. Prevalidation is conducted through multiplexing analytical methods by which potentially promising biomarkers are squeezed from a pool of biomarker candidates characterized by a high false-positive rate. On the contrary, the final validation phase must be implemented by a low-plexity, but high-throughput analysis in a more user-friendly manner. Our method is compatible to multiplexity but may require relatively more time and sera than single-step analysis platforms such as microarray. Thus, our method is thought to be best applicable to prevalidation step in which a mixture of oligonucleotide-tagged antibodies can be used to select final biomarker candidates showing good diagnostic performances.
Several modalities are available for diagnosis and surveillance of HCC, and they can be classified into instrumentation-based imaging including ultrasonography and blood tests. AFP has been the core biomarker for HCC, but because of the low sensitivity of the biomarker guidelines of the American Association for the Study of Liver Diseases do not include the usage of the AFP test for HCC surveillance for high-risk patients (27). AFP-L3%, an LCA-retained fuco-fraction of AFP, has been suggested as a means to complement the unsatisfactory clinical outcomes that are particularly observed for HCC patients with low AFP serum level (28, 29). However, studies failed to support the increased validity of AFP-L3% over the use of AFP alone. Instead, a marginal gain is that the ratio may be useful in risk stratification when combined with the total AFP level test (30). Because it is widely accepted that total AFP level and AFP-L3% are less discriminative between cirrhosis and HCC groups, comparison of sensitivity and specificity values between case-control studies may not provide meaningful information. That is, the comparison is only meaningful between tests within a case-control study. Our method enabled comparison of the diagnostic performance of the tests using either total AFP alone, AFP-L3%, or multi-panel fuco-biomarkers composed of A2M, hemopexin, and AFP. The outcome was that the fuco-index derived from the three biomarkers may be useful for improved diagnosis and surveillance of HCC. It should be noted that our study is unique in that AAL was used instead of LCA and the fuco-index was derived from the weighted sum of the individual biomarker values as an approach termed “in vitro diagnostic multivariate index assays.” Our preliminary data (supplemental Fig. S7) suggested that AAL, but not LCA, clearly discriminates between fuco- and non-fucoforms.
IVDMIA is based on the test results of multiple biomarkers and their weighted values to capture a signature or pattern of diseases. Modeling of the variation of the contribution by each component produces an index by which the classification performance can be improved compared with a single biomarker assay, as demonstrated in the OVA1 blood test (31). Because the algorithm derived from the computational analysis does not include any rational hypothesis or interpretations, it may weaken confidence in the adoption of results obtained from IVDVIA. Conversely, this may imply that great care must be taken during the process of algorithm derivation in IVDVIA and the process should be based on a rigorous and sound statistical background (32). The fuco-index (If) was generated from promising and portable evidence in this preliminary validation study and this became possible as a result of the sensitive, multiplex assay platform of our method. However, we recognize that the algorithm in Fig. 7A must be further refined with multi-site clinical specimens with minimal biases through a sufficiently large-scale study. In particular, it is worthwhile to note that IVDMIA is vulnerable to risks that disease-independent artifacts may be captured, particularly when depending on unintended biased samples with confounding factors (33). In this sense, our method warrants validation through prospective collections of clinical specimens that include random subsets of cases and controls. It is also important to test whether a nonlinear modeling will render better discriminatory power for diagnosis and surveillance in such clinical settings (32).
The modality of our method is based on comparative measurements of a fraction of a specific glycoform between reference and test sets. This raises a critical issue about designating reference specimens. Reference samples with unidentified bias or confounding factors may endanger the reliability of our method. We secured three sets of serum samples with serum levels of AFP, HPX, and A2M that belong to the median ranges observed for normal healthy subjects (34–36), and designated them as a reference set. Moreover, a 3-year follow-up investigation minimizes the uncontrollable or unperceived bias, such as lead-time bias. Nonetheless, the issue of bias or confounding factors during sample collection, storage, and processing may remain (33, 37). For this reason, it would be of paramount importance to secure a true “gold-standard reference set” that can be fully applied to our method through more vigorous investigation.
Conclusively, our method makes it possible to trace various disease-specific glycan alterations in various bio-fluids in a highly sensitive and robust manner. This platform can be in particular deployed to biomarker development in which aberrant glycoforms are targeted and quantified. We expect that fine-tuned methods according to researchers' various purposes will facilitate the development of aberrant glycosylation-based biomarkers, a field of research that is currently faltering.
Supplementary Material
Footnotes
Author contributions: J. Ko and Y.K. designed research; J.L., C.C., and S.K. performed research; J.Y. and C.L.C. contributed new reagents or analytic tools; J.L., J. Kang, J.Y., and Y.K. analyzed data; Y.K. wrote the paper.
* This work was supported by grants of the “KRIBB Research Initiative Program” funded by the Ministry of Science, ICT and Future Planning, and the “Korea Health Technology R&D Project” through the Korea Health Industry Development Institute (KHIDI) funded by the Ministry of Health & Welfare, Republic of Korea (HI13C0831).
 This article contains supplemental Figs. S1 to S7 and Table S1 to S4.
1 The abbreviations used are:
- AFP
- α-fetoprotein
- LCA
- Lens culinaris lectin
- AAL
- Aleuria aurantia lectin
- A2M
- alpha-2-macroglobulin
- Con-A
- concanavalin-A
- E-PHA
- phytohemagglutinin-E4
- FUT8
- fucosyltransferase 8
- GnT-V
- N-acetylglucosaminyl transferase V
- HCC
- hepatocellular carcinoma
- HPX
- hemopexin
- IVDMIA
- in vitro diagnostic multivariate index assays
- L-PHA
- phytohemagglutinin-L4
- MEF
- mouse embryonic fibroblast
- ROC
- receiver operating curve
- SSA
- Sambucus sieboldiana lectin.
REFERENCES
- 1. Christiansen M. N., Chik J., Lee L., Anugraham M., Abrahams J. L., Packer N. H. (2014) Cell surface protein glycosylation in cancer. Proteomics 14, 525–546 [DOI] [PubMed] [Google Scholar]
- 2. Kim Y. S., Hwang S. Y., Kang H. Y., Sohn H., Oh S., Kim J. Y., Kim C. H., Jeon J. H., Lee J. M., Kang H. A., Miyoshi E., Taniguchi N., Yoo H. S., Ko J. H. (2008) Functional proteomics study reveals that N-acetylglucosaminyltransferase V reinforces the invasive/metastatic potential of colon cancer through aberrant glycosylation on tissue inhibitor of metalloproteinase-1. Mol. Cell. Proteomics 7, 1–14 [DOI] [PubMed] [Google Scholar]
- 3. Häuselmann I., Borsig L. (2014) Altered tumor-cell glycosylation promotes metastasis. Front. Oncol. 4, 28. [DOI] [PMC free article] [PubMed] [Google Scholar]
- 4. Meany D. L., Chan D. W. (2011) Aberrant glycosylation associated with enzymes as cancer biomarkers. Clin. Proteomics 8, 7. [DOI] [PMC free article] [PubMed] [Google Scholar]
- 5. Kim Y. S., Yoo H. S., Ko J. H. (2009) Implication of aberrant glycosylation in cancer and use of lectin for cancer biomarker discovery. Protein Pept. Lett. 16, 499–507 [DOI] [PubMed] [Google Scholar]
- 6. Adamczyk B., Tharmalingam T., Rudd P. M. (2012) Glycans as cancer biomarkers. Biochim. Biophys. Acta 1820, 1347–1353 [DOI] [PubMed] [Google Scholar]
- 7. Cheng J., Wang W., Zhang Y., Liu X., Li M., Wu Z., Liu Z., Lv Y., Wang B. (2014) Prognostic role of pretreatment serum AFP-L3% in hepatocellular carcinoma: systematic review and meta-analysis. PLOS One 9, e87011. [DOI] [PMC free article] [PubMed] [Google Scholar]
- 8. Xia Y., Yan Z. L., Xi T., Wang K., Li J., Shi L. H., Wu M. C., Shen F. (2012) A case-control study of correlation between preoperative serum AFP and recurrence of hepatocellular carcinoma after curative hepatectomy. Hepatogastroenterol. 59, 2248–2254 [DOI] [PubMed] [Google Scholar]
- 9. Potapovich A. I., Pastore S., Kostyuk V. A., Lulli D., Mariani V., De Luca C., Dudich E. I., Korkina L. G. (2009) alpha-Fetoprotein as a modulator of the pro-inflammatory response of human keratinocytes. Br. J. Pharmacol. 158, 1236–1247 [DOI] [PMC free article] [PubMed] [Google Scholar]
- 10. Androutsopoulos G., Gkogkos P., Decavalas G. (2013) Mid-trimester maternal serum HCG and alpha fetal protein levels: clinical significance and prediction of adverse pregnancy outcome. Int. J. Endocrinol. Metab. 11, 102–106 [DOI] [PMC free article] [PubMed] [Google Scholar]
- 11. Shiraki K., Takase K., Tameda Y., Hamada M., Kosaka Y., Nakano T. (1995) A clinical study of lectin-reactive alpha-fetoprotein as an early indicator of hepatocellular carcinoma in the follow-up of cirrhotic patients. Hepatology 22, 802–807 [PubMed] [Google Scholar]
- 12. Duffy M. J., Evoy D., McDermott E. W. (2010) CA 15–3: uses and limitation as a biomarker for breast cancer. Clin. Chim. Acta 411, 1869–1874 [DOI] [PubMed] [Google Scholar]
- 13. Galli C., Basso D., Plebani M. (2013) CA 19–9: handle with care. Clin. Chem. Lab. Med. 51, 1369–1383 [DOI] [PubMed] [Google Scholar]
- 14. Kang J. G., Ko J. H., Kim Y. S. (2011) Pros and cons of using aberrant glycosylation as companion biomarkers for therapeutics in cancer. BMB Rep. 44, 765–771 [DOI] [PubMed] [Google Scholar]
- 15. Rifai N., Gillette M. A., Carr S. A. (2006) Protein biomarker discovery and validation: the long and uncertain path to clinical utility. Nat. Biotechnol. 24, 971–983 [DOI] [PubMed] [Google Scholar]
- 16. Anderson N. L., Anderson N. G. (2002) The human plasma proteome: history, character, and diagnostic prospects. Mol. Cell. Proteomics 1, 845–867 [DOI] [PubMed] [Google Scholar]
- 17. Hong Q., Lebrilla C. B., Miyamoto S., Ruhaak L. R. (2013) Absolute quantitation of immunoglobulin G and its glycoforms using multiple reaction monitoring. Anal. Chem. 85, 8585–8593 [DOI] [PMC free article] [PubMed] [Google Scholar]
- 18. Kościelak J. (1995) Diseases of aberrant glycosylation. Acta Biochim. Pol. 42, 1–10 [PubMed] [Google Scholar]
- 19. Zhang H., Li X. J., Martin D. B., Aebersold R. (2003) Identification and quantification of N-linked glycoproteins using hydrazide chemistry, stable isotope labeling, and mass spectrometry. Nat. Biotechnol. 21, 660–666 [DOI] [PubMed] [Google Scholar]
- 20.US Department of Health and Human Services, authors. Draft Guidance for Industry, Clinical Laboratories, and Staff: In Vitro Diagnostic Multivariate Index Assays. [Accessed April 2, 2012]. http://www.fda.gov/downloads/MedicalDevices/DeviceRegulationandGuidance/GuidanceDocuments/ucm071455.pdf.
- 21. Ihara S., Miyoshi E., Ko J. H., Murata K., Nakahara S., Honke K., Dickson R. B., Lin C. Y., Taniguchi N. (2002) Prometastatic effect of N-acetylglucosaminyltransferase V is due to modification and stabilization of active matriptase by adding beta 1–6 GlcNAc branching. J. Biol. Chem. 277, 16960–16967 [DOI] [PubMed] [Google Scholar]
- 22. Guo H. B., Lee I., Kamar M., Akiyama S. K., Pierce M. (2002) Aberrant N-glycosylation of beta1 integrin causes reduced alpha5beta1 integrin clustering and stimulates cell migration. Cancer Res. 62, 6837–6845 [PubMed] [Google Scholar]
- 23. Guo H. B., Lee I., Kama M., Pierce M. (2003) N-acetylglucosaminyltransferase V expression levels regulate cadherin-associated homotypic cell–cell adhesion and intracellular signaling pathways. J. Biol. Chem. 278, 52412–52424 [DOI] [PubMed] [Google Scholar]
- 24. Zhou H., Briscoe A. C., Froehlich J. W., Lee R. S. (2012) PNGase F catalyzes de-N-glycosylation in a domestic microwave. Anal. Biochem. 427, 33–35 [DOI] [PMC free article] [PubMed] [Google Scholar]
- 25. Wilson D. S., Wu J., Peluso P., Nock S. (2002) Improved method for pepsinolysis of mouse IgG(1) molecules to F(ab′)(2) fragments. J. Immunol. Methods 260, 29–36 [DOI] [PubMed] [Google Scholar]
- 26. Chen S., LaRoche T., Hamelinck D., Bergsma D., Brenner D., Simeone D., Brand R. E., Haab B. B. (2007) Multiplexed analysis of glycan variation on native proteins captured by antibody microarrays. Nat. Methods 4, 437–444 [DOI] [PubMed] [Google Scholar]
- 27. Bruix J., Sherman M.; American Association for the Study of Liver Diseases. (2011) Management of hepatocellular carcinoma: an update. Hepatology 53, 1020–1022 [DOI] [PMC free article] [PubMed] [Google Scholar]
- 28. Sterling R. K., Jeffers L., Gordon F., Venook A. P., Reddy K. R., Satomura S., Kanke F., Schwartz M. E., Sherman M. (2009) Utility of Lens culinaris agglutinin-reactive fraction of alpha-fetoprotein and des-gamma-carboxy prothrombin, alone or in combination, as biomarkers for hepatocellular carcinoma. Clin. Gastroenterol. Hepatol. 7, 104–113 [DOI] [PubMed] [Google Scholar]
- 29. Shiraki K., Takase K., Tameda Y., Hamada M., Kosaka Y., Nakano T. (1995) A clinical study of lectin-reactive alpha-fetoprotein as an early indicator of hepatocellular carcinoma in the follow-up of cirrhotic patients. Hepatology 22, 802–807 [PubMed] [Google Scholar]
- 30. Marrero J. A., Feng Z., Wang Y., Nguyen M. H., Befeler A. S., Roberts L. R., Reddy K. R., Harnois D., Llovet J. M., Normolle D., Dalhgren J., Chia D., Lok A. S., Wagner P. D., Srivastava S., Schwartz M. (2009) Alpha-fetoprotein, des-gamma carboxyprothrombin, and lectin-bound alpha-fetoprotein in early hepatocellular carcinoma. Gastroenterology 137, 110–118 [DOI] [PMC free article] [PubMed] [Google Scholar]
- 31. Ueland F. R., Desimone C. P., Seamon L. G., Miller R. A., Goodrich S., Podzielinski I., Sokoll L., Smith A., van Nagell J. R., Jr., Zhang Z. (2011) Effectiveness of a multivariate index assay in the preoperative assessment of ovarian tumors. Obstet. Gynecol. 117, 1289–1297 [DOI] [PubMed] [Google Scholar]
- 32. Zhang Z. (2012) An in vitro diagnostic multivariate index assay (IVDMIA) for ovarian cancer: harvesting the power of multiple biomarkers. Rev. Obstet. Gynecol. 5, 35–41 [PMC free article] [PubMed] [Google Scholar]
- 33. Ransohoff D. F. (2005) Bias as a threat to the validity of cancer molecular-marker research. Nat. Rev. Cancer 5, 142–149 [DOI] [PubMed] [Google Scholar]
- 34. Bellet D. H., Wands J. R., Isselbacher K. J., Bohuon C. (1984) Serum alpha-fetoprotein levels in human disease: perspective from a highly specific monoclonal radioimmunoassay. Proc. Natl. Acad. Sci. U.S.A. 81, 3869–3873 [DOI] [PMC free article] [PubMed] [Google Scholar]
- 35. Delanghe J. R., Langlois M. R. (2001) Hemopexin: a review of biological aspects and the role in laboratory medicine. Clin. Chim. Acta 312, 13–23 [DOI] [PubMed] [Google Scholar]
- 36. McMahon M. J., Bowen M., Mayer A. D., Cooper E. H. (1984) Relation of alpha 2-macroglobulin and other antiproteases to the clinical features of acute pancreatitis. Am. J. Surg. 147, 164–170 [DOI] [PubMed] [Google Scholar]
- 37. Ransohoff D. F. (2007) How to improve reliability and efficiency of research about molecular markers: roles of phases, guidelines, and study design. J. Clin. Epidemiol. 60, 1205–1219 [DOI] [PubMed] [Google Scholar]
Associated Data
This section collects any data citations, data availability statements, or supplementary materials included in this article.