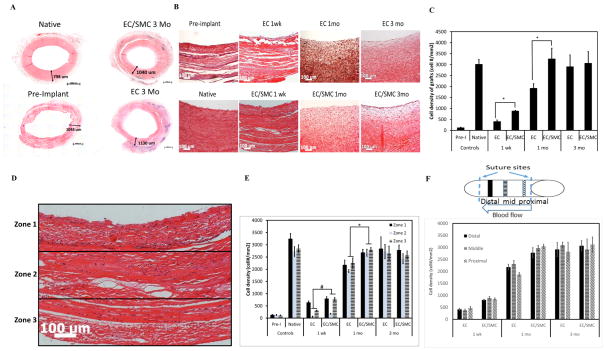
Figure 2. Histological examination of explanted TEVs.

(A) H&E images of TEV ring sections. Each number represents wall thickness. Bar: 1000 μm. (B) H&E staining of cross-sections of explanted TEVs at the indicated times. Bar: 100 μm. (C) Quantification of cell density using Image J (*: p<0.05, n=3; 5 tissue sections per graft for 3 grafts). (D) Each H&E image was divided into three zones indicating the luminal, extramural and intermediate section of each graft. Bar: 100 μm. (E) Cell density in each zone at the indicated times (#: p<0.03; *: p<0.05). (F) Cell density in the distal end, mid-section and proximal end of each graft at the indicated times. The schematic shows the proximal, middle and distal sections of the graft. (G) Masson’s Trichrome staining of explanted grafts at the same time points. Bar: 100 μm. (H) Quantification of collagen staining intensity (blue) using Image J (*: p<0.05, n=3).

