

Abstract
All human cells are covered by glycans, the carbohydrate units of glycoproteins, glycolipids, and proteoglycans. Most glycans are localized to cell surfaces and participate in events essential for cell viability and function. Glycosylation evolves during carcinogenesis, and therefore carcinoma-related glycan structures are potential cancer biomarkers. Colorectal cancer is one of the world's three most common cancers, and its incidence is rising. Novel biomarkers are essential to identify patients for targeted and individualized therapy. We compared the N-glycan profiles of five rectal adenomas and 18 rectal carcinomas of different stages by matrix-assisted laser desorption-ionization time-of-flight mass spectrometry. Paraffin-embedded tumor samples were deparaffinized, and glycans were enzymatically released and purified. We found differences in glycosylation between adenomas and carcinomas: monoantennary, sialylated, pauci-mannose, and small high-mannose N-glycan structures were more common in carcinomas than in adenomas. We also found differences between stage I–II and stage III carcinomas. Based on these findings, we selected two glycan structures: pauci-mannose and sialyl Lewis a, for immunohistochemical analysis of their tissue expression in 220 colorectal cancer patients. In colorectal cancer, poor prognosis correlated with elevated expression of sialyl Lewis a, and in advanced colorectal cancer, poor prognosis correlated with elevated expression of pauci-mannose. In conclusion, by mass spectrometry we found several carcinoma related glycans, and we demonstrate a method of transforming these results into immunohistochemistry, a readily applicable method to study biomarker expression in patient samples.
Glycans, the carbohydrate units of glycoproteins, glycolipids, and proteoglycans, that cover all human cells. Around 1% of the human genome participates in the biosynthesis of glycans(1). This biosynthesis is the most complex post-translational modification of proteins, and the great variability in glycan structures contains a tremendous ability to fine-tune the chemical and biological properties of glycoproteins. The glycosylation process occurs most abundantly in the Golgi apparatus and the endoplasmic reticulum, but also occurs in the cytoplasm and nucleus (2). Most glycoconjugates are localized to cell surfaces, where glycans participate in events essential for cell viability and function, such as cell adhesion, motility, and intracellular signaling (2). Changes in these functions are key steps seen when normal cells transform to malignant ones, and these are also reflected in changes of a cell's glycan profile, observed in many cancers (3, 4). Specific structural changes in glycans may serve as cancer biomarkers (5, 6), and changes in glycosylation profiles are related to aggressive behavior in tumor cells (7–9).
Cancer-associated asparagine-linked glycan (N-glycan) structures may play specific roles in supporting tumor progression; growth (10, 11), invasion (12, 13), and angiogenesis (14). Changes in the N-glycan profile emerge in numerous cancers, including lung (15, 16), breast (17), and colorectal cancer (CRC)1 (16, 18). Balog et al. (18) comparing the N-glycomic profile of CRC tissue to adjacent normal mucosa, reported differences in specific glycan structures. Moreover, serum N-glycosylation profile from patients with CRC differ from those of healthy controls (19).
Colorectal cancer is the third most common cause of cancer-related death worldwide and its incidence is rising; 40% of CRCs are of rectal origin. Roughly 40% of patients have localized disease (stage I–II; Dukes A–B), another 40% loco regional disease (stage III; Dukes C), and 20% metastasized disease (stage IV; Dukes D) (20). Although stage at diagnosis is the most important factor determining prognosis, clinical outcome, and response to adjuvant treatment can markedly vary within each stage. Adjuvant therapy routinely goes to stage III patients, but the benefit of adjuvant treatment for stage II patients is unclear. Of stage II patients, 80% are cured by radical surgery alone. To identify patients who will benefit from postoperative treatment, we need novel biomarkers. The glycan profile of the tumor tissue could provide new biomarkers for diagnosis and prognosis of cancer.
In this study, we characterized the N-glycomic profiles of rectal adenomas and carcinomas by MALDI-TOF mass spectrometric (MS) profiling of asparagine-linked glycans. Our aim was to identify differences between adenomas and carcinomas, and also between cancers of different stages. Based on glycan profiling, we also chose, for immunohistochemical expression studies of a series of 220 CRC patients, two glycan markers: sialyl Lewis a and pauci-mannose.
EXPERIMENTAL PROCEDURES
Patients
For MS analysis we chose 18 rectal carcinoma patients (four each at stages I–III and six at stage IV) and five rectal adenoma patients. Tissue samples were stored in the archives of the Department of Pathology, University of Helsinki. All selected cases were blood group A Rh+ in order to minimize the possible influence of blood group antigens on glycan profiles. Detailed patient characteristics are in Table I.
Table I. Description of the sample cohort.
| Stagea | TNMb | Agec | Sex | Tumor size(cm) | Tumor histologyd |
|---|---|---|---|---|---|
| Adenoma | 84 | F | Large | Severe dysplasia | |
| Adenoma | 79 | F | Large | Severe dysplasia | |
| Adenoma | 72 | F | 2 | Severe dysplasia | |
| Adenoma | 64 | M | 10 | Severe dysplasia | |
| Adenoma | 52 | M | 2 | Severe dysplasia | |
| A | T2N0M0 | 49 | F | 4 | Adeno, G1 |
| A | T2N0M0 | 59 | M | 3 | Adeno, G2 |
| A | T2N0M0 | 59 | M | 14 | Adeno, G2 |
| A | T2N0M0 | 53 | M | 2 | Adeno, G2 |
| B | T3N0M0 | 87 | M | 5 | Adeno, G2 |
| B | T3N0M0 | 71 | M | 7 | Adeno, G2 |
| B | T3N0M0 | 76 | F | 7 | Adeno, G2 |
| B | T3N0M0 | 56 | M | 5 | Adeno, G2 |
| C | T3N1M0 | 74 | M | 3 | Adeno, G2 |
| C | T3N1M0 | 61 | M | 4 | Adeno, G2 |
| C | T3N1M0 | 55 | F | 5 | Adeno, G2 |
| C | T3N2M0 | 84 | M | 4 | Adeno, G2 |
| D | T3N1M1 | 56 | F | 7 | Adeno, G2 |
| D | T3N2M1 | 82 | M | 5 | Adeno, G2 |
| D | T3N2M1 | 66 | M | 5 | Adeno, G3 |
| D | T4N2M1 | 28 | M | 6 | Adeno, G3 |
| D | T3N1M1 | 50 | M | 5 | Adeno, G3 |
| D | T3N2M1 | 64 | F | 3 | Adeno, G3 |
a Dukes A-D,
b TNM, tumor node metastasis,
c Age at diagnosis,
d Dysp.gravis = Dysplasia gravis, Adeno = Adenocarcinoma, G = Grade(1–4, WHO).
The study population for the immunohistochemistry comprised 220 consecutive colorectal cancer patients operated on from 1998 to 2001 at the Department of Surgery, Helsinki University Hospital (21). The Finnish Population Register Center provided the follow-up vital-status data needed to compute survival statistics, and Statistics Finland provided cause of death for all those deceased. Median follow-up was 5.1 years (range 0–13.2), with a 5-year disease-specific survival (DSS) rate of 64.8% (95%Cl, 58.1–71.5%). This study was approved by the local ethics committee (Dnro HUS 226/E6/06, extension TMK02 §66 17.4.2013) and the National Supervisory Authority of Welfare and Health (TEO Dnro 3990/04/046/07).
Tissue Samples for Mass Spectrometry
Representative areas of adenoma and carcinoma tissue were marked on HE slides. Paired adjacent samples were taken from the corresponding formalin-fixed, paraffin-embedded tissue blocks with a 3.0-mm puncher. The amount of harvested tissue was at least 1 mm3. The samples were deparaffinized with xylene and with ethanol-water series according to standard procedures.
Glycan Isolation
Glycans were detached from cellular glycoproteins by PNGase F digestion (Prozyme, Hayward, CA). First, soluble contaminants were removed by precipitating the proteins with ice-cold 75% ethanol at −20 °C. Precipitated proteins were recovered by centrifugation, followed by PNGase F digestion to the protein pellet in 20 mm sodium phosphate buffer (pH 7.3) in overnight digestion. The detached glycans then passed in water through Hypersep C18 (Thermo Scientific, Waltham, MA) and absorbed to Hypersep Hypercarb 50 mg (Thermo Scientific), both in a 96-well format. The carbon wells were washed with water, and neutral glycans were eluted with 25% acetonitrile in water (v/v); and acidic glycans with 0.05% (v/v) trifluoroacetic acid in 25% acetonitrile in water (v/v). The acidic glycans were further purified by adsorbing them first to a MassPREPTM HILIC μElution Plate (Waters, Milford, MA) in 90% acetonitrile, and eluting by 50 mm NH4HCO3. Both glycan fractions were additionally passed in water through strong cation-exchange resin (Bio-Rad Laboratories, Hercules, CA) and C18 silica resin (Millipore, Billerica, MA).
Mass Spectrometry
Matrix-assisted laser desorption-ionization time-of-flight (MALDI-TOF) mass spectrometry was performed by a Bruker Ultraflex III TOF/TOF instrument (Bruker Daltonics Inc, Bremen, Germany). Neutral N-glycans were detectable in positive ion reflector mode as [M + Na]+ ions, and acidic N-glycans in negative ion linear mode as [M - H]− ions. Relative molar abundances of neutral and acidic glycan components were assigned based on their relative signal intensities in the mass spectra when analyzed separately as the neutral and acidic N-glycan fraction. The mass spectrometric raw data underwent transformation into the present glycan profiles by removal of the effect of isotopic pattern overlapping, multiple alkali-metal adduct signals, products of elimination of water from reducing oligosaccharides, and other interfering mass spectrometric signals not arising from the sample similarly as previously described (22). Resultant glycan signals in the glycan profiles were normalized to 100% to allow relative quantitative sample comparison. The glycan signals were then assigned to biosynthetic groups based on their proposed monosaccharide composition (16, 22), see supplemental Table S1.
Preparation of Tissue Microarrays and Immunohistochemistry
Formalin-fixed and paraffin-embedded tumor samples came from the archives of the Department of Pathology, Helsinki University Hospital. Representative areas on hematoxylin- and eosin-stained tumor slides were marked by an experienced pathologist. Three 1.0-mm-diameter punches from each sample were mounted on paraffin blocks by a semiautomatic tissue microarray instrument (TMA) (Beecher Instruments, Silver Spring, MD) as described (21).
TMA blocks were freshly cut into 4-μm sections. After deparaffinization in xylene and rehydration through a gradually decreasing concentration of ethanol to distilled water, slides were treated in a PreTreatment module (Lab Vision Corp., Fremont, CA) in Tris-HCl (pH 8.5) buffer for 20 min at 98 °C for antigen retrieval. The staining procedure utilized the Dako REAL EnVision Detection system, Peroxidase/DAB+, Rabbit/Mouse (Dako, Glostrup, Denmark) used an Autostainer 480 (Lab Vision). Dilution for anti-sialyl Lewis a antibody (CA19–9,Novocastra Laboratories Ltd, Newcastle upon Tyne, UK) was 1:300 and for the anti-pauci-mannose N-glycan antibody, 1:100 (mouse monoclonal antibody 100–4G11-A that binds to Man3 pauci-mannose N-glycans) (23).
Immunohistochemical Scoring
For anti-sialyl Lewis a and anti-pauci-mannose antibodies, negative cytoplasmic expression was scored 0, weakly positive as 1, moderately positive as 2, and strongly positive as 3. For statistical purposes, scores were dichotomized as low (0–1) and high (2–3). Stainings were scored independently by T.K. and J.H., who were blinded to clinical data and outcome. Differences in scoring were discussed until consensus.
Statistical Analyses
MS Analysis
For statistical analyses, we used the mean values of the relative intensities of N-glycan signals of each patient's paired samples. Mean relative intensities and the error of means of all N-glycan signals from the whole study group were calculated for neutral and acidic glycans separately. The Mann-Whitney-test served to compare differences of glycomic structures between adenomas and carcinomas, and between carcinomas of different stages. When a statistically significant difference was seen by the Mann-Whitney-test we also calculated the mean of glycan structures' relative amounts, the standard errors of the mean, and the fold change of the means between groups. Error propagation served to assess standard error for the fold change. For principal component analysis (PCA), we used the relative intensities of structures, whose relative intensities differed significantly, by the Mann-Whitney-test, between adenomas and carcinomas. Two components were extracted for both neutral and acidic N-glycans. Bartlett's was the test showing whether the correlation matrix was identity matrix, and the Kaiser-Meyer-Olking was to test the adequacy of PCA for the data.
Immunohistochemistry
Evaluation of the association between sialyl Lewis a and pauci-mannose expression and clinicopathological parameters was by the Pearson chi-square exact-test. Disease-specific overall survival was counted from date of surgery until date of death from colorectal cancer, or until end of follow-up. Survival analysis was by the Kaplan-Meier method and was compared by the log rank test. All tests were two-sided. A p value of 0.05 was considered significant. All statistical analyses were done by SPSS version 20.0 (IBM SPSS Statistics, version 20.0 for Mac; SPSS, Inc., Chicago, IL, an IBM Company).
RESULTS
Asparagine-linked Glycan Profiles
To gain statistically significant information on asparagine-linked glycan structural changes in malignant transformation of rectal tumors, we analyzed 18 paired carcinoma samples (four each of stages I–III, six of stage IV) and five paired adenoma samples from 23 patients. Figs. 1C and 2C show the overall profile analysis results, which differed markedly between malignant and benign samples, prompting more detailed investigation.
Fig. 1.

Neutral N-glycan profile of rectal adenoma and carcinomas of different stages. MALDI-TOF mass spectrometric profiles of neutral asparagine-linked glycans between m/z 750–2750 Da, isolated from paraffin-embedded archival tissue samples of an adenoma A, and a stage IV carcinoma B. C, shows the relative intensities of the 35 most abundant glycan signals of rectal adenomas and carcinomas of different stages (I–IV). Error bars represent error of means. All glycan signals have been assigned to proposed monosaccharide compositions (see Abbreviations). All glycan signals were analyzed as sodium adduct ions, [M+Na]+. Major N-glycans are described with symbol methodology based on previous structural analyses (16, 18): Blue square = N-acetylhexosamine, green circle =, hexose, red triangle = deoxyhexose/fucose, yellow circle = mannose.
Fig. 2.

Acidic N-glycan profile of a rectal adenoma and carcinomas, and carcinomas of different stages. MALDI-TOF mass spectrometric profiles of neutral asparagine-linked glycans between m/z 1000–2800 Da, isolated from paraffin-embedded archival tissue samples of an adenoma A, and a stage IV carcinoma B. C, shows the relative intensities of the 35 most abundant glycan signals of rectal adenomas and carcinomas of different stages (I–IV). Error bars represent error of means. All glycan signals have been assigned to proposed monosaccharide compositions (see Abbreviations). All glycan signals were analyzed as deprotonated ions, [M-H]-. * = four major acidic N-glycan signals in each sample. The brackets indicate that position of the acid ester (SP) in the structure is not specified. Major N-glycans are described with symbol methodology based on previous structural analyses (16, 18): Blue square = N-acetylhexosamine, green circle =, hexose, red triangle = deoxyhexose/fucose, yellow circle = mannose, purple diamond = N-acetylneuraminic acid.
Neutral Asparagine-linked Glycan Profiles
Neutral N-glycan profiles generated from an individual rectal adenoma sample versus a stage IV rectal carcinoma sample were quantitatively clearly different (Fig. 1A and B). For example, in stage IV carcinoma, the most abundant glycan signal m/z 1257 was (corresponding to the sodium adduct ion of the monosaccharide composition H5N2), in contrast to the adenoma. In addition, numerous glycan signals, such as m/z 917 (H3N2F1) and m/z 1663 (H5N4) were among the most abundant in the carcinoma profile, but low in the adenoma. Thus, in this sample pair many neutral N-glycan signals were characteristic of carcinoma.
There was considerable overall similarity between the major glycan signals observed in the present study and the previous study by Balog et al. (18) describing detailed analysis of N-glycans from both colorectal carcinoma and corresponding normal tissue. Comparison to the results of the previous study allowed us to derive initial structural information and support for the proposed monosaccharide compositions directly from the mass spectrometric glycan profiles of the present study. Importantly, the present sample cohort included patients with benign adenomas that were not included in the report by Balog et al. (18). Therefore the present comparison to benign abnormal growth allowed us to pinpoint the glycans that are specifically cancer-associated. Further, we were able to detect distinct N-glycans associated with either locoregional or metastatic rectal carcinoma.
Fig. 1C shows the comparison of MALDI-TOF mass spectrometric profiles of neutral N-glycans from rectal adenomas and carcinomas. Glycan compositions H5N2, H6N2, H7N2, H8N2, and H9N2, identified as high-mannose type N-glycans, (18) were the most abundant glycan signals of the neutral N-glycan fractions of both adenomas and carcinomas. However, in comparison to adenoma, the relative amount of the smallest high-mannose type glycan H5N2 was increased in all carcinoma stages compared with the other high-mannose glycans. Further, a group of glycans more abundant in carcinomas than adenoma, were neutral complex-type N-glycans, most notably H3N4F1, H4N4F1, H5N4, and H5N4F1. The first two were indicative signals to cancer-associated terminal N-acetylglucosamine glycan modifications that were characterized in our previous study of colon glycosylation, these are caused by accumulation of nongalactosylated glycan structures in carcinomas (16). These glycans were identified to carry terminal N-acetylhexosamine in colorectal carcinoma samples (18). The third notable group of neutral glycan signals in the present study was pauci-mannose type N-glycans, which were more abundant in carcinomas than in adenomas, e.g. H2N2F1, H3N2, H3N2F1, and H4N2. This glycan group was already identified to be cancer-associated in the previous study of colorectal carcinoma (18),whereas the present results demonstrated that these glycans were not up-regulated in benign tumors. Further, the fucosylated pauci-mannose type N-glycans (compositions with F, e.g. H2N2F1 and H3N2F1) were more abundant at higher stages, whereas nonfucosylated structures (e.g. H3N2 and H4N2) were common at stage I.
Acidic Asparagine-linked Glycan Profiles
Fig. 2A and 2B present corresponding profiles of acidic N-glycans from the same adenoma and carcinoma samples as the neutral N-glycan profiles in Fig. 1A and 1B. Here we observed even larger differences between the N-glycan structures of the two sample types. For example, the four major acidic N-glycan signals of the stage-IV sample (marked with asterisks in Fig. 2B), comprising the bulk of the total acidic N-glycan signals, were different from the four major acidic N-glycan signals in the adenoma sample (marked with asterisks in Fig. 2A). All four signals in this individual adenoma sample profile, contained an acid ester (sulfate or phosphate) in the proposed composition, whereas all four signals in this individual carcinoma sample profile contained a sialic acid residue as the acidic group in the structure, and acid-ester modified glycans were found only as minor glycans in the carcinoma (for example m/z 1646). In the average glycan profile of the sample group (Fig. 2C), the same phenomenon was seen; acid esters were abundant in adenoma, whereas sialylation dominated in carcinoma. Sulfate esters (SO3) and phosphate esters (PO3H) have nearly identical mass (79.957 and 79.966 Da, respectively) and cannot be distinguished by the time-of-flight mass spectrometer used in the present work. Balog et al. (18) could identify the modifications in their colorectal carcinoma glycans as sulfate using high-resolution mass spectrometry. Sulfated glycans are also commonly found in protein-linked glycans of digestive tract epithelia (13, 20). However, in the present study, these modifications are referred to as acid esters and marked with the symbol P in glycan compositions.
In the acidic N-glycan profiles (Fig 2C), the acid ester-containing structures were major glycans in adenomas but not in carcinomas, (H5N4F2P1, H4N5F2P1, H5N4F3P1, and H4N5F3P1). Sialylated structures (compositions with S indicating sialic acid residues in the monosaccharide composition) dominated the carcinoma acidic N-glycan profiles, for example sialylated N-glycans S1H5N4F1 and S2H5N4F1. Larger sialylated N-glycans, like S1H6N5F1, were more common in carcinomas than in adenomas.
Glycosylation Differences between Adenomas and Carcinomas
When we compared N-glycan structures between adenomas and carcinomas, we saw statistically significant changes in numerous structures in neutral and acidic N-glycans (Fig. 3A and 3B). A prominent cancer-associated glycan group was characterized by composition of only three N-acetylhexosamine (N) and four hexose residues (H), indicating that the corresponding molecular structures only had the building blocks for one N-glycan antenna. Balog et al. also identified such signals as monoantennary N-glycans in colorectal carcinoma patient samples (18). There was a significant increase in these monoantennary-size structures for both acidic (p = 0.030) and neutral N-glycans (p = 0.0001) in carcinomas compared with levels in adenomas.
Fig. 3.
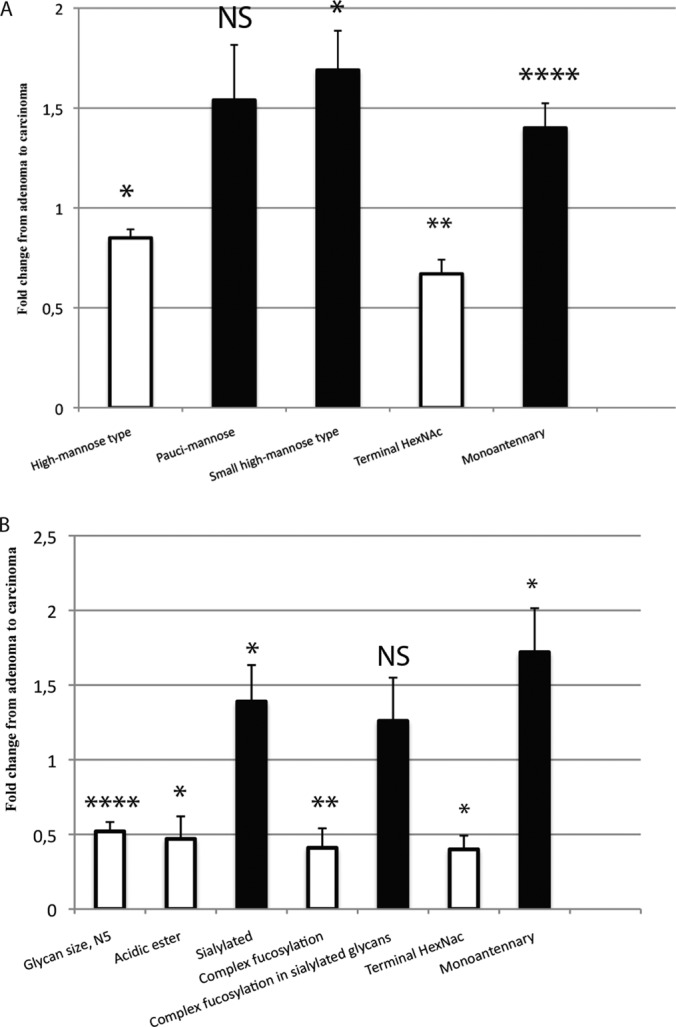
Differences of neutral A, and acidic B, N-glycosylation between adenomas and carcinomas. Fold change of the mean relative intensity of glycan structures from adenomas to carcinomas. Statistical analysis by the Mann-Whitney-test: * = (p < 0.05), ** = (p < 0.01), *** = (p < 0.001), **** = (p < 0.0001), NS = Nonsignificant. Structural assignments based on: (16, 18).
Similarly, we could readily observe that sialylated structures were more common in carcinomas, whereas acid ester-modified N-glycans were especially abundant in adenomas. Also, neutral complex- and hybrid-type N-glycans were more common in carcinomas as evidenced in their significantly increased relative presence in the neutral N-glycan fraction. In carcinomas, we saw an increase, although statistically nonsignificant, of pauci-mannose structures among neutral N-glycans. We also analyzed the relative amount of those glycan signals that could potentially contain sialylated Lewis-type structures, already characterized by Balog et al. (18), that is, sialylated glycans that contained at least two fucose residues: such glycan signals were increased in carcinomas compared with adenomas, although the difference was statistically nonsignificant. All p values and ratios of means are in Supplemental Table S2A and B.
When we included the structures with statistically significant differences between adenomas and carcinomas (five structure types in neutral N-glycans and six in acidic N-glycan structures) in principal component analysis, we saw that the neutral N-glycans were homogenous in adenomas, but not in carcinomas. The profiles of carcinomas differed from those of adenomas, but they also differed among themselves (Fig 4A). A similar phenomenon was apparent for acidic N-glycan profiles (Fig 4B).
Fig. 4.

Principal component analysis separates rectal adenomas and carcinomas based on neutral A, and acidic B, N-glycosylation. Black dots represent carcinomas and red triangles represent adenomas. For neutral glycans (Bartlett's test: p = 0.005, Kaiser-Meyer-Olking test: 0.588, PC1 (42.5%) versus PC2 (25.6%)). For acidic glycans (Bartlett's test: p < 0.00001, Kaiser-Meyer-Olking test: 0.741, PC1 (83.3%) versus PC2 (8.1%).
Glycosylation Differences between Local Disease and Locoregional Disease
Acidic N-glycan signals with five N-acetylhexosamine residues (compositions with N5) were significantly more abundant in locoregional carcinoma (stage III) compared with local disease (stage I–II), whereas monoantennary-size N-glycans (compositions with H4N3) were more abundant in local disease samples compared with locoregional (Fig 5A). p values and ratios of means are in supplemental Table S2C.
Fig. 5.
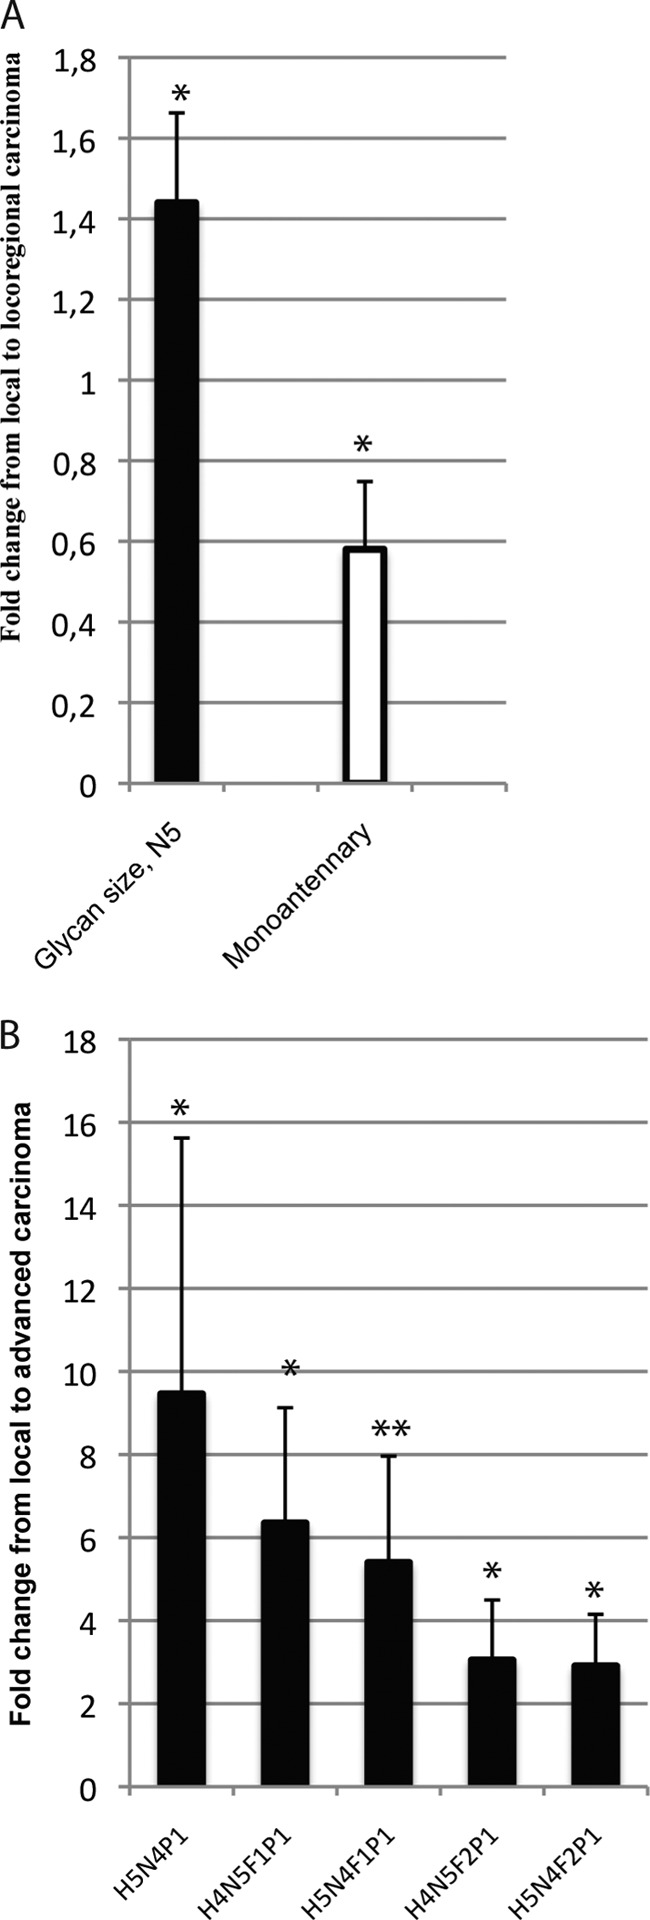
Differences of acidic N-glycosylation between A, local and locoregional rectal carcinoma, B, local and advanced rectal carcinoma. Fold change of the mean relative intensity of glycan structures from A local (stage I–II) to locoregional carcinomas (stage III), and local to advanced carcinoma (stage III–IV). Statistical analysis by the Mann-Whitney-test: * = (p < 0.05), ** = (p < 0.01), *** = (p < 0.001), **** = (p < 0.0001), NS = Nonsignificant. Structural assignments based on: (16, 18).
Glycosylation Differences between Local Disease and Advanced Disease
A group of acid ester-modified N-glycans, namely H5N4P1, H5N4F1P1, H5N4F2P1, H4N5F1P1, and H4N5F2P1, were increased in advanced disease (stage III–IV) compared with local disease (stage I–II), (Fig. 5B). p values and ratios of means are in supplemental Table S2D.
Sialyl Lewis a and Pauci-Mannose Expression in Colorectal Cancer
Immunohistochemistry
Because glycome analysis indicated major cancer-related changes in expression in sialylated glycans and in pauci-mannose glycans, we decided to study these structures by immunohistochemistry. For this purpose, we used antibodies detecting sialyl Lewis a and pauci-mannose N-glycans. Sialyl Lewis a expression was membranous with apical membrane predilection and partially cytoplasmic, but with no visible nuclear staining. Sialyl Lewis a cytoplasmic expression was negative or low in 143 (66.5%) and moderate or high in 72 (33.5%) carcinomas. Pauci-mannose expression was mostly cytoplasmic and often granular, with only minor membranous accumulation and no visible nuclear staining. Pauci-mannose expression was negative or low in 105 (55.3%) and moderate or high in 93 (44.7%) carcinomas. Representative immunostainings are in supplemental Figs. S1 and S2.
Correlation with Clinicopathological Parameters
An association emerged between high sialyl Lewis a expression and low differentiation (p < 0.035); expression associated neither with age, gender, tumor histology (nonmucinous versus mucinous), disease stage, nor tumor location (colon versus rectum or right versus left). High expression of pauci-mannose associated with nonmucinous histology (p = 0.014), but with no other clinicopathological parameters (supplemental Table S3A and S3B).
Survival
Kaplan-Meier analysis showed a significantly poorer 5-year disease-specific survival (DSS) of colorectal cancer patients with high sialyl Lewis a expression, being for patients with high sialyl Lewis a expression, 42.5% (95% CI, 27.2–57.8%) and for low expression being 59.8% (95% CI, 56.1–63.5%, p < 0.009, log-rank-test). Five-year DSS was significantly poorer for patients with advanced colorectal cancer with high pauci-mannose expression being 31.1% (95% CI, 15.8–46.4%) and for those with low expression 55.7% (95% CI, 42.4–69.0%, p = 0.022, log-rank-test).
DISCUSSION
Here we show by MALDI-TOF MS analysis that the acidic and neutral N-glycan profiles of rectal adenomas and carcinomas clearly differ, and that principal component analysis of specific N-glycans can separate adenomas from carcinomas. We identified several specific N-glycan structure types whose amounts in carcinomas either increase or decrease during adenoma-carcinoma transition or cancer progression. We report for the first time that the amount of monoantennary N-glycan structures in cancer tissues is significantly increased as compared with corresponding benign tumor tissue. We also found differences in the amount of N-glycan structures between local and locoregional disease and between local and advanced cancer.
Sulfate esters are recognizable as typical modifications of digestive tract glycans (24), and they were also observable in previous glycosylation analyses of colorectal carcinoma and normal tissue samples(18). In contrast, sialylation is more common in most tissues in the human body. Here, we observed that N-glycan profiles of adenomas were complex and rich in terminal glycan modifications typical of colon glycosylation. These included acidic esters partly replacing sialylation and complex fucosylation of N-glycans. In comparison, in the acidic N-glycan profiles of the carcinomas we observed a drastic loss of rectal epithelial glycosylation features including the acid ester modifications. Thus, the carcinomas showed dedifferentiation from the normal tissue-specific glycosylation, which was especially prominent at advanced stages. However, many glycan structures were increased in carcinomas and could serve as novel cancer biomarkers.
The homogeneity of adenomas' N-glycan profiles and the difference between carcinomas N-glycan profiles and those of adenomas, and difference between themselves, were clearly visible in principal component analysis. Similar differences are seen between serous ovarian cystadenomas and serous carcinomas (Satomaa et al., manuscript in preparation). Our results indicate that a distinction between benign and malignant tumors is apparent in mass spectrometric glycosylation analysis. Further studies are, however, necessary to transform the mass spectrometric results into clinically applicable methods. Immunohistochemical or serum biomarker assays would be useful if performed with specific antibodies. Based on our PCA results, we see that complex MS profile can be transformed into a simple equation, predicting malignancy. A prospective study with a larger sample cohort is needed to analyze the sensitivity and specificity of the MS method. Currently we routinely use multiwell sample preparation procedures. Because both MS and data analysis can be automated, we see possible clinical utility for the MS, as well.
The serum N-glycomic profile differs in CRC patients from that of normal controls; adenoma patients' N-glycan profiles also differ from those of CRC patients (19). However, seeing directly the changes in the glycomic profiles of tumor cells, requires MS analysis of the tissue, because changes in serum glycosylation have been associated with altered glycosylation of immunoglobulin and acute phase proteins (25, 26).
Balog et al. (18) compared colorectal cancer samples from 13 patients with control samples taken 6 cm away from the tumor. They identified pauci-mannocidic (pauci-mannose) structures, sulfated N-glycans (acid esters), and sialyl Lewis-type epitopes to be more abundant in carcinomas than in control samples. Similarly, in our sample series, we saw an increase in pauci-mannose structures and same glycan signals as in the previous study that indicated sialyl-Lewis type structures from adenomas to carcinomas, although the differences were not statistically significant. Our amounts of sulfated N-glycans were lower in carcinomas than in adenomas. Balog et al. studied the difference between carcinoma tissue and adjacent normal tissue, but did not study adenomas. Our finding that acidic esters are highly abundant in benign tumors, suggests that they are not carcinoma specific biomarkers. We detected minor acidic ester modified glycans in carcinomas; whether they carry carcinoma specific sulfated structures warrants further studies. Balog et al. studied tumors originating from all colorectum, whereas our tumors were all of rectal origin. Our results correspond at a general level with those of Balog et al., a sign of this method's repeatability.
To our knowledge, the increase in amount of monoantennary structures in any cancer tissue is reported here for the first time. Previously, an increased amount of monoantennary structures in serum has been reported for lung cancer (15).
By MS it was possible to identify a large number of glycan structures whose expression differed between carcinomas and adenomas; these included increased sialylated and pauci-mannose structures. Also differences between local carcinomas and metastasized tumors were found. These glycan structures are potential tumor markers deserving of investigation in large patient series. In this report, we included the analysis of two candidate glycan markers; sialyl Lewis a, better known as serum tumor marker CA19–9, and pauci-mannose. High tissue expression of sialyl Lewis a has been correlated with poor prognosis and unfavorable clinicopathological parameters in CRC (27–29). Our results confirm these findings. Elevated expression of pauci-mannose N-glycans correlated with nonmucinous histology and also associated significantly in advanced CRC with poor prognosis. These structures have been associated with lysosomal glycoproteins, but the mechanism of their accumulation in malignant tumors is currently not known. In addition to strong intracellular staining with the pauci-mannose antibody, we detected membranous accumulation of the structures in cancer cells, which suggests potential utility of this glycan group as a source of novel cancer-associated antigens. We also identified several other potential glycan structures identified by MS analysis, and expect further studies with specific antibodies to reveal their potential role in CRC.
Analysis of the full N-glycan profile of tumor samples is time consuming and laborious, we kept the number of tumor samples relatively low. We tried to eliminate possible variance in glycosylation resulting from tumor location by including only tumors of the rectum. As blood-group antigens are built of glycan structures, we chose only patients with blood group A Rh+, to eliminate the possible influence. Such strict inclusion criteria allowed us to use a reasonably small sample cohort to identify significant glycosylation changes apparently related to carcinoma progression.
Here we show that glycosylation of colorectal tumors differs at various stages of the adenoma-carcinoma sequence. We did not identify glycosylation differences only between adenomas and carcinomas, but also between local and more advanced carcinomas, differences that may reflect tumor ability to invade and metastasize (Fig. 6). Most colorectal cancers arise from adenomas, a slow process taking years, even decades. Colorectal cancer is traditionally considered to be caused by accumulating mutations of key tumor-suppressor genes and oncogenes. Based on sequential analysis of the colon cancer genome, a subset of 12 key genes are proposed as most likely to be involved in the formation of an individual carcinoma (30). In addition, epigenetic changes, like chromatin conformation, nucleosomal occupancy and remodeling, and chromatin looping play important roles in carcinogenesis (31, 32). Here, we observed a major protein glycosylation shift from strictly tissue-specific N-glycan structures in adenomas into dedifferentiated glycosylation already in early-stage carcinomas. Colorectal carcinomas, but not adenomas, have the capability of invading basement membranes. Later in their progress, carcinomas have the potential to send metastases to local lymph nodes and to distant organs. Further studies are warranted to study the possible role of such changed glycosylation in carcinoma invasion and metastasis.
Fig. 6.

Changes in N-glycosylation during progression of colorectal carcinoma. N-glycosylation changes during carcinoma progression via the adenoma-carcinoma pathway. Transition from adenoma to carcinoma is seen in up-regulation of numerous N-glycan structures. N-glycomic structures characteristic to digestive tract are seen also in adenomas. Results based on findings reported here and by Balog et al. (2012) (18) = *.
Here we show that the N-glycan profiles of rectal adenomas and carcinomas differ. We have identified several specific N-glycan structures either up-regulated or down-regulated in carcinomas as compared with benign adenomas. Glycosylation differences existed between local and more advanced carcinoma. MS analysis of N-glycan profiles can identify specific glycan structures, and we demonstrate how the glycan structures identified can be tested as potential prognostic biomarkers by detection of these glycan structures in situ by immunohistochemistry.
Supplementary Material
Acknowledgments
We thank Päivi Peltokangas and Elina Aspiala for their excellent technical assistance, and DDS Laura Kaprio for the illustration in Fig. 6.
Footnotes
Author contributions: T.K., H.M., O.C., J.S., and C.H. designed research; T.K., T.S., and A.H. performed research; T.S., C.H.H., A.M.D., and J.S. contributed new reagents or analytic tools; T.K., T.S., A.H., H.M., J.H., and C.H. analyzed data; T.K., T.S., A.H., C.H.H., A.M.D., H.M., J.H., O.C., J.S., and C.H. wrote the paper.
* This study was supported by grants from Finska Läkaresällskapet, the Kurt och Doris Palander Foundation, the Sigrid Jusélius Foundation, and Medicinska understödsföreningen Liv och Hälsa, K. Albin Johansson Foundation, and a special governmental subsidy for research and training.
 This article contains supplemental Tables S1 to S3 and Figs. S1 and S2.
1 The abbreviations used are:
- CRC
- colorectal cancer
- DSS
- disease-specific survival
- F
- deoxyhexose
- G
- N-glycolylneuraminic acid
- H
- hexose
- N
- N-acetylhexosamine; N-glycan asparagine-linked glycan
- P
- acid ester (sulphate or phosphate)
- PCA
- principal component analysis
- S
- N-acetylneuraminic acid
- TMA
- tissue microarray.
REFERENCES
- 1. Lowe J. B., Marth J. D. (2003) A genetic approach to mammalian glycan function. Annu. Rev. Biochem. 72, 643–691 [DOI] [PubMed] [Google Scholar]
- 2. Marth J. D., Grewal P. K. (2008) Mammalian glycosylation in immunity. Nat. Rev. Immunol. 8, 874–887 [DOI] [PMC free article] [PubMed] [Google Scholar]
- 3. Hakomori S. (1989) Aberrant glycosylation in tumors and tumor-associated carbohydrate antigens. Adv. Cancer Res. 52, 257–331 [DOI] [PubMed] [Google Scholar]
- 4. An H. J., Kronewitter S. R., de Leoz M. L. A., Lebrilla C. B. (2009) Glycomics and disease markers. Curr. Opin. Chem. Biol. 13, 601–607 [DOI] [PMC free article] [PubMed] [Google Scholar]
- 5. Okuyama N., Ide Y., Nakano M., Nakagawa T., Yamanaka K., Moriwaki K., Murata K., Ohigashi H., Yokoyama S., Eguchi H., Ishikawa O., Ito T., Kato M., Kasahara A., Kawano S., Gu J., Taniguchi N., Miyoshi E. (2006) Fucosylated haptoglobin is a novel marker for pancreatic cancer: a detailed analysis of the oligosaccharide structure and a possible mechanism for fucosylation. Int. J. Cancer 118, 2803–2808 [DOI] [PubMed] [Google Scholar]
- 6. Arnold J. N., Saldova R., Hamid U. M. A., Rudd P. M. (2008) Evaluation of the serum N-linked glycome for the diagnosis of cancer and chronic inflammation. Proteomics 8, 3284–3293 [DOI] [PubMed] [Google Scholar]
- 7. Ravindranath M. H., Yesowitch P., Sumobay C., Morton D. L. (2007) Glycoimmunomics of human cancer: current concepts and future perspectives. Per. Med. 3, 201–214 [DOI] [PubMed] [Google Scholar]
- 8. Mungul A. A., Cooper L. L., Brockhausen I. I., Ryder K. K., Mandel U. U., Clausen H. H., Rughetti A. A., Miles D. W. D., Taylor-Papadimitriou J. J., Burchell J. M. J. (2004) Sialylated core 1 based O-linked glycans enhance the growth rate of mammary carcinoma cells in MUC1 transgenic mice. Int. J. Oncol. 25, 937–943 [PubMed] [Google Scholar]
- 9. Kobata A., Amano J. (2005) Altered glycosylation of proteins produced by malignant cells, and application for the diagnosis and immunotherapy of tumors. Immunol. Cell Biol. 83, 429–439 [DOI] [PubMed] [Google Scholar]
- 10. Girnita L. L., Wang M. M., Xie Y. Y., Nilsson G. G., Dricu A. A., Wejde J. J., Larsson O. O. (2000) Inhibition of N-linked glycosylation down-regulates insulin-like growth factor-1 receptor at the cell surface and kills Ewing's sarcoma cells: therapeutic implications. Anticancer Drugs 15, 67–72 [PubMed] [Google Scholar]
- 11. Komatsu M. M., Jepson S. S., Arango M. E. M., Carraway C. A. C. C., Carraway K. L. K. (2001) Muc4/sialomucin complex, an intramembrane modulator of ErbB2/HER2/Neu, potentiates primary tumor growth and suppresses apoptosis in a xenotransplanted tumor. Oncogene 20, 461–470 [DOI] [PubMed] [Google Scholar]
- 12. Yoshimura M. M., Ihara Y. Y., Matsuzawa Y. Y., Taniguchi N. N. (1996) Aberrant glycosylation of E-cadherin enhances cell–cell binding to suppress metastasis. J. Biol. Chem. 271, 13811–13815 [DOI] [PubMed] [Google Scholar]
- 13. Granovsky M., Fata J., Pawling J., Muller W. J., Khokha R., Dennis J. W. (2000) Suppression of tumor growth and metastasis in Mgat5-deficient mice. Nat. Med. 6, 306–312 [DOI] [PubMed] [Google Scholar]
- 14. Pili R. R., Chang J. J., Partis R. A. R., Mueller R. A. R., Chrest F. J. F., Passaniti A. A. (1995) The alpha-glucosidase I inhibitor castanospermine alters endothelial cell glycosylation, prevents angiogenesis, and inhibits tumor growth. Cancer Res. 55, 2920–2926 [PubMed] [Google Scholar]
- 15. Arnold J.N., Saldova R., Calligan M.C., Murphy T.B., Mimura-Kimura Y., Telford J.E., Godwin A.K., Rudd P.M. (2011) Novel glycan biomarkers for the detection of lung cancer. J. Proteome Res. 10, 1755–1764 [DOI] [PubMed] [Google Scholar]
- 16. Satomaa T., Heiskanen A., Leonardsson I., Angstrom J., Olonen A., Blomqvist M., Salovuori N., Haglund C., Teneberg S., Natunen J., Carpen O., Saarinen J. (2009) Analysis of the human cancer glycome identifies a novel group of tumor-associated N-acetylglucosamine glycan antigens. Cancer Res. 69, 5811–5819 [DOI] [PubMed] [Google Scholar]
- 17. Abd Hamid U. M., Royle L., Saldova R., Radcliffe C. M., Harvey D. J., Storr S. J., Pardo M., Antrobus R., Chapman C. J., Zitzmann N., Robertson J. F., Dwek R. A., Rudd P. M. (2008) A strategy to reveal potential glycan markers from serum glycoproteins associated with breast cancer progression. Glycobiology 18, 1105–1118 [DOI] [PubMed] [Google Scholar]
- 18. Balog C. I. A., Stavenhagen K., Fung W. L. J., Koeleman C. A., McDonnell L. A., Verhoeven A., Mesker W. E., Tollenaar R. A. E. M., Deelder A. M., Wuhrer M. (2012) N-glycosylation of colorectal cancer tissues: a liquid chromatography and mass spectrometry-based investigation. Mol. Cell Proteomics 11, 571–585 [DOI] [PMC free article] [PubMed] [Google Scholar]
- 19. Zhao Y.-P. Y., Ruan C.-P. C., Wang H. H., Hu Z.-Q. Z., Fang M. M., Gu X. X., Ji J. J., Zhao J.-Y. J., Gao C.-F. C. (2012) Identification and assessment of new biomarkers for colorectal cancer with serum N-glycan profiling. Cancer 118, 639–650 [DOI] [PubMed] [Google Scholar]
- 20. Siegel R., Naishadham D., Jemal A. (2012) Cancer statistics, 2012. CA. Cancer J. Clin. 62, 10–29 [DOI] [PubMed] [Google Scholar]
- 21. Böckelman C., Koskensalo S., Hagström J., Lundin M., Ristimäki A., Haglund C. (2012) CIP2A overexpression is associated with c-Myc expression in colorectal cancer. Cancer Biol. Ther. 13, 289–295 [DOI] [PubMed] [Google Scholar]
- 22. Satomaa T., Heiskanen A., Mikkola M., Olsson C., Blomqvist M., Tiittanen M., Jaatinen T., Aitio O., Olonen A., Helin J., Hiltunen J., Natunen J., Tuuri T., Otonkoski T., Saarinen J., Laine J. (2009) The N-glycome of human embryonic stem cells. BMC Cell Biol. 10, 42. [DOI] [PMC free article] [PubMed] [Google Scholar]
- 23. van Remoortere A., Bank C. M. C., Nyame A. K., Cummings R. D., Deelder A. M., van Die I. (2003) Schistosoma mansoni-infected mice produce antibodies that cross-react with plant, insect, and mammalian glycoproteins and recognize the truncated biantennaryN-glycan Man3GlcNAc2-R. Glycobiology 13, 217–225 [DOI] [PubMed] [Google Scholar]
- 24. Robbe C., Capon C., Coddeville B., Michalski J.-C. (2004) Structural diversity and specific distribution of O-glycans in normal human mucins along the intestinal tract. Biochem. J. 384, 307–316 [DOI] [PMC free article] [PubMed] [Google Scholar]
- 25. Saldova R., Royle L., Radcliffe C. M., Hamid U. M. A., Evans R., Arnold J. N., Banks R. E., Hutson R., Harvey D. J., Antrobus R., Petrescu S. M., Dwek R. A., Rudd P. M. (2007) Ovarian cancer is associated with changes in glycosylation in both acute-phase proteins and IgG. Glycobiology 17, 1344–1356 [DOI] [PubMed] [Google Scholar]
- 26. Bones J., Byrne J. C., O'Donoghue N., McManus C., Scaife C., Boissin H., Nastase A., Rudd P. M. (2011) Glycomic and glycoproteomic analysis of serum from patients with stomach cancer reveals potential markers arising from host defense response mechanisms. J. Proteome Res. 10, 1246–1265 [DOI] [PubMed] [Google Scholar]
- 27. Itzkowitz S. H., Yuan M., Fukushi Y., Palekar A., Phelps P. C., Shamsuddin A. M., Trump B. F., Hakomori S., Kim Y. S. (1986) Lewisx- and sialylated Lewisx-related antigen expression in human malignant and nonmalignant colonic tissues. Cancer Res. 46, 2627–2632 [PubMed] [Google Scholar]
- 28. Hanski C., Bornhoeft G., Topf N., Hermann U., Stein H., Riecken E. O. (1990) Detection of a mucin marker for the adenoma-carcinoma sequence inhuman colonic mucosa by monoclonal antibody AM-3. J. Clin. Pathol. 43, 379–384 [DOI] [PMC free article] [PubMed] [Google Scholar]
- 29. Portela S. V., Martín C. V., Romay L. M., Cuevas E., Martín E. G., Briera A. F. (2011) sLea and sLex expression in colorectal cancer: implications for tumourigenesis and disease prognosis. Histol. Histopathol. 26, 1305–1316 [DOI] [PubMed] [Google Scholar]
- 30. Cummins J. M., He Y. P., Leary R. J., Pagliarini R., Diaz L. A., Sjoblom T., Barad O., Bentwich Z., Szafranska A. E., Labourier E., Raymond C. K., Roberts B. S., Juhl H., Kinzler K. W., Vogelstein B., Velculescu V. E. (2006) The colorectal microRNAome. Proc. Natl. Acad. Sci. U.S.A. 103, 3687–3692 [DOI] [PMC free article] [PubMed] [Google Scholar]
- 31. van Engeland M., Derks S., Smits K. M., Meijer G. A., Herman J. G. (2011) Colorectal cancer epigenetics: complex simplicity. J. Clin. Oncol. 29, 1382–1391 [DOI] [PubMed] [Google Scholar]
- 32. Sharma S., Kelly T. K., Jones P. A. (2010) Epigenetics in cancer. Carcinogenesis 31, 27–36 [DOI] [PMC free article] [PubMed] [Google Scholar]
Associated Data
This section collects any data citations, data availability statements, or supplementary materials included in this article.