

Abstract
Nucleotide sequence differences on the whole-genome scale have been computed for 1,092 people from 14 populations publicly available by the 1000 Genomes Project. Total number of differences in genetic variants between 96,464 human pairs has been calculated. The distributions of these differences for individuals within European, Asian, or African origin were characterized by narrow unimodal peaks with mean values of 3.8, 3.5, and 5.1 million, respectively, and standard deviations of 0.1–0.03 million. The total numbers of genomic differences between pairs of all known relatives were found to be significantly lower than their respective population means and in reverse proportion to the distance of their consanguinity. By counting the total number of genomic differences it is possible to infer familial relations for people that share down to 6% of common loci identical-by-descent. Detection of familial relations can be radically improved when only very rare genetic variants are taken into account. Counting of total number of shared very rare single nucleotide polymorphisms (SNPs) from whole-genome sequences allows establishing distant familial relations for persons with eighth and ninth degrees of relationship. Using this analysis we predicted 271 distant familial pairwise relations among 1,092 individuals that have not been declared by 1000 Genomes Project. Particularly, among 89 British and 97 Chinese individuals we found three British–Chinese pairs with distant genetic relationships. Individuals from these pairs share identical-by-descent DNA fragments that represent 0.001%, 0.004%, and 0.01% of their genomes. With affordable whole-genome sequencing techniques, very rare SNPs should become important genetic markers for familial relationships and population stratification.
Keywords: population genetics, haplotype, bioinformatics, vrGV
Introduction
Accomplishment of “1000 Genome Project” revealed immense amount of information about variation, mutation dynamics, and evolution of the human DNA sequences. The obtained critical data were originally reported by the Project Consortium (Abecasis et al. 2010, 2012). These genomes have been already used in a number of studies, which added essential information about human populations, allele frequencies, local haplotype structures, distribution of common and rare genetic variants, and determination of human ancestry and familial relationships (see, e.g., articles most relevant to this study [Gravel et al. 2013; Harris and Nielsen 2013; Hochreiter 2013; Moore et al. 2013; Fagny et al. 2014]).
Knowledge of population stratification is important for medicine, specifically, in case–control association and cohort studies as unknown distant familial relationships could potentially compromise interpretation of collected data. Proper genetic identification of familial relationships is also critical for forensic identification, in criminal investigations, inheritance claims, and in other areas of human life.
Widely used haplotype data such as Y chromosome or mitochondrial DNA for identification of distant genetic relationships have limited applications due to the consideration of male or female lines of descent (Parson and Bandelt 2007; Willuweit et al. 2011). Estimation of genetic relatedness on autosomal genomic sequences is mainly based on genome-wide averages of the estimated number of alleles shared identically by descent (IBD) (Weir et al. 2006; Huff et al. 2011; Browning BL and Browning SR 2013). Various methods have been used to detect IBD familial relationships (Thompson 1975; Boehnke and Cox 1997; Li et al. 2014). The most commonly used GEMLINE, fastBD, ISCA, and ERSA. A most sophisticated approach, ERSA2.0, for IBD identification depends on the complicated statistical methods. Yet, only with confidence (97%) it can identify up to fifth-degree relatives while deeper relations with confidence of less than 80% in simulated or mixed populations using genome-wide genotyping arrays and whole-genome sequencing (Huff et al. 2011; Li et al. 2014). Recent analysis by Durand et al. (2014) demonstrated that GEMLINE method when applied for analysis of nearly 3,000 real, nonsimulated, father–mother–child trios had over 67% of false positive rate. The same authors introduced nonprobabilistic additional computationally effective metric to score IBD fragments, HaploScore, to improve accuracy of IBD detection methods. However, the efficiency and reliability of such approach to testing of familial relationship in generations deeper than first was not tested.
Aiming to advance identification of distant familial relationships, we undertook computational examination of publicly available 1,092 genomes. Genomic differences across all autosomes (total number of different genetic variants) have been computationally assessed for all possible 45,747 human pairs from the same populations and also for 50,717 pairs of individuals taken from different populations, which represent 9% of all possible interpopulation pairs and chosen randomly. We found that in-line with previous publications most genetic variations are found within human populations (Barbujani et al. 1997; Jobling and Gill 2004). We also observed that pairs with declared familial genetic relations have the least genomic differences compared with other nonrelated pairs from the same population. By simply counting the total number of genomic differences it is possible to infer familial relations for people that share down to 6% of common IBD genetic materials. Here, we demonstrated that the detection of familial relations would be drastically improved (by the order of magnitude) when only very rare genetic variants (vrGVs, with frequencies less than 0.2%) are taken into account. This article demonstrates that simple counting of total number of shared vrGVs from whole-genome sequences allows establishing with high certainty (P < 0.001) distant familial relations for persons with eighth and ninth degrees of relationship (people that have merely a fraction of a percentage of a coefficient of relationship [r] as defined by Wright [1922]). This is a very simple and powerful method for estimation of familial relationship based on vrGVs comparison, which requires whole-genome sequencing. With the availability of Illumina’s new HiSeq X Ten device, the price of human genome sequencing this year was reduced three times to $1000 per genome. After accomplishment of the technology race to $100 per genome in the nearest future, vrGVs should become affordable important genetic markers for familial relationships and a broad range of population genetics studies.
Materials and Methods
Assessing the Total Number of the Genomic Variants Differences
We used data from the 1000 Genomes Project that are available through public ftp site ftp://ftp-trace.ncbi.nih.gov/1000genomes/ftp/release/20110521/ (last accessed January 22, 2015) (Abecasis et al. 2012). Specifically, Variant Call Format (VCF) files version 4.1 that contained a total of 38.2 million single nucleotide polymorphisms (SNPs), 3.9 million short insertions/deletions, and 14,000 deletions for all the human chromosomes have been used. Information about genotype for each sequenced individual was extracted from the GT-field of VCF files “as is” in the 1000 Genomes data set. The genotype likelihood information (GL field) has not been considered.
A large-scale computational analysis using a combination of Perl programs was carried out to process and assess the total genetic differences between each pair of individuals. The programs were run on the Oakley supercomputer (https://www.osc.edu/supercomputing/computing/oakley, last accessed January 22, 2015) in the Ohio Supercomputer Center or their optimized versions on our local Linux workstation. All Perl Programs utilized in this project are available at our web page “http://bpg.utoledo.edu/∼afedorov/lab/prog.html (last accessed January 22, 2015).” These programs include the following: 1) Intra_PopGenomeDif.pl and Inter_PopGenomeDif.pl that computes the total number of genetic variant differences between pairs of individuals from the same and different populations, respectively; 2) shell script Batch_Populations.sh for batch-distributing the program to multiple cores in Oakley; 3) 2individualsGenomeDif_vrGVs.pl; 4) IDs_seperator_rareSNPs.pl; and 5) Intra_PopGenomeDif_vrGVs.pl and Inter_PopGenomeDif_vrGVs.pl that computes the total number of shared vrGVs between individuals from the same and different populations, respectively. The step-by-step description how to use these programs is presented in the supplementary file S1, Supplementary Material online.
Computer modeling of genomic differences has been performed with the program GenomeDiffSimulation.pl. The explicit instructions to this program are inserted as the comments into this script.
Each insertion or deletion has been counted as a single disparity not taking into account the length. Both parents’ alleles have been considered. As an example, for a polymorphic site containing alleles A1 and A2, we counted as two differences between persons homozygous with A1 and homozygous with A2 and as a single difference between a heterozygous person and a homozygous one. For a population of size N, all possible pairs (N2/2) have been computationally processed for their intrapopulation genomic differences.
Supplementary table S1, Supplementary Material online, shows a summary of the samples the 1000 Genomes Project has sequenced and been used in this project. Our analysis included the entire set of human autosomes, whereas X- and Y-chromosomes have been omitted to allow a proper comparison between males and females.
Statistics
A nonparametric statistical method (Kruskal–Wallis test; Kruskal and Wallis 1952) for testing equality of population medians among groups is used to assess for significant differences among populations and among continental ancestors.
Kruskal–Wallis test is identical to an ANOVA (5.1.4) with the data replaced by their ranks. The data analysis is performed using R commander package.
Number of vrGVs Shared between Relatives
We set our frequency threshold for vrGVs as less than 0.2% based on the number of studied individuals (1,092) that provide data for the 2,184 haploid genomes. With this threshold, the genetic variants with less than five minor allele counts (in other words, singletons, doubletons, tripletons, and quadrupletons) among 2,184 studied haploid genomes were considered as vrGVs.
A subset table of the autosomal vrGVs information for the 1,092 individuals is created using a Perl program (IDs_seperator_rareSNPs.pl). The table included solely variants (very rare genomic variants) with frequency as less as 0.2%. Using the rare variants table, a second Perl program (Intra_PopGenomeDif_vrGVs.pl) used to assess the number of rare variants shared between each pair of individuals within the same population. In order to assess the rare variants shared between individuals from different population, a Perl program named (Inter_PopGenomeDif_vrGVs.pl) was developed.
We referred to familial relations following Wright (1922) in degree of relationship and coefficient of relationship (r). However, 1000 Genomes Project uses another term—first, second, and third order of relations, which is not well defined. As we examined 1000 Genomes data sets, we also used “order of relations” referring to the 1000 Genomes Project data.
Results
Genomic Differences among Humans
We have computed the total number of genomic differences between pairs of individuals whose DNA sequences are available from the “1000 Genomes” project. Our analysis included the entire set of human autosomes, whereas X- and Y-chromosomes have been omitted to allow a proper comparison between males and females. Figure 1 illustrates the intrapopulation results for 14 populations from Africa, America, Asia, and Europe. All pairs of individuals with declared family relationships are marked by stars in figure 1B. These pairs have significantly fewer genomic differences than the remaining nonrelated pairs from the same population. Statistical examination of the intrapopulation distributions using Kruskal–Wallis test showed that, with the 0.05 significance level, the distributions are different from each other except for CHB and JPT populations (see statistical details in supplementary file S2, Supplementary Material online). The interpopulation genomic differences are presented in the supplementary figure S1, Supplementary Material online.
Fig. 1.—

Distribution of number of genetic variants (GVs) between all possible pairs of individuals within the same population. Three populations from Africa (ASW, LWK, and YRI), three populations from America (CLM, MXL, and PUR), three from Asia (CHB, CHS, and JPT), and five from Europe (CEU, FIN, GBR, IBS, and TSI) have been examined. Numbers of individuals in the populations are shown on the graph behind the population identifier (e.g., 66 people for MXL-66). The number of pairs has been calculated for bins (X; X + 10,000), where number of genetic variants X is plotted on the graph and the bin size was 10,000 genetic variations. (A) Two-dimensional view of the distribution. (B) Three-dimensional view of the distribution where all pairs with declared genetic relations are marked by stars. The color of a star reflects a specific genetic relationship: Red stands for siblings, blue—parent/child pair, green—second order relations, and yellow—third order.
Computer Modeling of Genomic Differences
Intriguingly, the number of genomic differences within Asian, European, and African populations are shaped as narrow peaks with mean values of 3.5, 3.8, and 5.1 million, respectively, and standard deviations in the range of 0.03–0.1 million (fig. 1A). As a majority of human genes have several major mutually exclusive haplotypes, comprising dozens to hundreds of frequent SNPs (International HapMap Consortium 2003), the number of genomic differences for a particular gene between pairs of human individuals should range from 0 (when compared individuals carry the same gene haplotypes) to dozens or hundreds of differences (when compared individuals carry different haplotypes of the gene under analysis). In order to understand the reason why the genomic differences for African, Asian, and European populations on the figure 1 are distributed as single narrow peaks, a computer program GenomeDiffSimulation.pl has been created. This program models the genomes of virtual individuals that, on an average, contain 3,800,000 different SNPs between them. In addition, these SNPs are grouped into several (four by default) mutually exclusive haplotypes for each genomic locus of the virtual individuals. The variable parameter for this program is the total number of loci that are in linkage equilibrium with each other.
The computational results for the distribution of the total differences in SNPs between pairs of virtual individuals are shown in figure 2. The width of the peaks in the figure 2A essentially depends on the number of genomic loci, in which SNPs are in linkage equilibrium with each other. In the model where the number of loci with linkage equilibrium is 5,000, the peak for the total genomic differences between virtual individuals (shown in blue) closely matches the shape of the peak computed for the actual Great Britain population (which, for comparison, is also present in figure 2A and shown as a red bold line). This number (5,000) of chromosomal loci with linkage equilibrium with each other roughly corresponds to that in the human genome. There is an ambiguity in the estimation of the exact number of such loci in humans because of the fact that linkage disequilibrium between SNPs in humans decays continuously with increasing physical distance between SNPs, and also depends on the local recombination rate, which is highly variable along chromosomes (Arnheim et al. 2003). If the human genome consisted of 5,000 loci with mutual linkage equilibrium, the average size of the locus would have to be 600 kb. This nucleotide length in the human genome corresponds to 0.6 cM for genetic distance, which seems reasonable for modeling of the locus size. Hence, 5,000 loci with mutual linkage equilibrium give a rough approximation of the human genome. This estimation is congruent to common view in Hartl and Clark (2007) textbook (page 543). However, for more precise estimation, the population history and demography should be taken into account. All in all, we attribute the narrow width of the peaks for the genomic differences in long-established African, Asian, and European populations to the presence of several thousand chromosomal loci in mutual linkage equilibrium. In each of these relatively old populations, the haplotypes of the loci have been well shuffled and all individuals have equal chances of carrying a particular haplotype. Figure 1 also reveals much wider peaks for the American populations. We attribute this increased width to the recent admixture in populations of the New World, where European, African, and Native American genomic ancestry may be observed in various proportions in different people.
Fig. 2.—

Distribution of number of GVs between pairs of individuals from the same real and modeling populations. (A) Two-dimensional expanded view of the distribution. Real population from Great Britain (GBR) is shown as a red bold line, whereas the five other curves represent model populations of virtual individuals. Virtual individuals in all models have on average 3.8 million differences of genetic variants between them. Various models have different number of genomic loci that are in linkage equilibrium with each other. The model with the lowest number (50) of loci with equilibrium is shown by orange line and has the widest span. The model with the highest number of loci in linkage equilibrium, 25,000, has the narrowest peak (brown line). When the number of loci with equilibrium in the modeling genome is 5,000 (navy blue line) the modeling distribution is most similar to the real one from GBR population (red line). (B) Three-dimensional view of the distribution where pairs with known genetic relations are marked with stars. The color of a star reflects a specific genetic relationship: Red stands for siblings, green—second order relations, yellow—third order, pink—fourth order, and black—fifth order of genetic relations. The front most distribution (red) represents the real population from Great Britain (GBR). The next five curves represent distributions for five model populations of virtual individuals (M1–M5). In each of these five models, the number of loci in linkage equilibrium with each other is the same—5,000. Three pairs of virtual individuals mimic genetic relationships in every model. In M1, these three pairs are represented by siblings (that share 50% of common genetic materials from the most recent common ancestor). M2 represents three pairs with the second order of relations that share 25% of common genetic materials (e.g., aunt/niece). M3 represents three pairs with third order of relations that share 12.5% of common genetic materials (e.g., cousins). M4—fourth order with 6.25%; and M5—fifth order with 3.12% of common genetic materials. All three pairs with fifth order of genetic relations from M5 model are located in the same left-most bin together with one pair of virtual individuals that does not have genetic relations.
Our GenomeDiffSimulation.pl program has an option to mimic close genetic relations for several pairs of virtual individuals. A user may assign specific genetic relations for these pairs such as siblings (which share 50% of common genetic material IBD), second order of genetic relations (e.g., aunt/niece with 25% of common genetic material IBD), third order of relations (cousins with 12.5% of common IBD loci), or other more distant relatives with any user-defined percentage for common genetic loci. The genetically related pairs of virtual individuals have been simulated and five of these computational experiments are presented on the figure 2B, where positions of pairs with genetic relations are marked by stars. Positions of virtual individual pairs with first and second order of genetic relationships (50% and 25% of common IBD loci, respectively) correspond well to the positions of the actual human pairs having declared family relationships from the 1000 Genomes. For example, genetically related pairs of virtual individuals are compared with pairs from Great Britain populations in figure 2B. We observed that positions of siblings and parent/child pairs are always located in the extreme left of their corresponding population peak, followed by pairs with the second order of relations, which are closer to the corresponding peaks, and so on.
In the figure 1B, the positions of several pairs within Luhya in Webuye, Kenya (LWK), Southern Han Chinese, China (CHS), British in England and Scotland (GBR) populations that are located close to the left slopes of their respective population peaks should correspond to the fourth or fifth order of genetic relations (6.2–3.1% of shared IBD genetic materials). The genetic relations for these pairs have not been declared, yet with this analysis we can infer their putative genetic relations (which also has been confirmed by the distributions of very rare SNPs, see next paragraph). However, according to our computer simulations, the pairs with the fifth and higher order of relations (3.1% and less percentage of common genetic materials) may frequently be located within the left slopes of the corresponding peaks together with genetically nonrelated pairs (see fig. 2B). Thus, prediction of fifth and higher orders of genetic relations based on the total number of genomic differences appears to be unreliable. This limitation in identifying genetic relationships exists because a majority of genomic differences between pairs of individuals is contributed by frequent SNPs that form several (usually from two to five) major haplotypes in each loci (International HapMap Consortium 2003). These major haplotypes have a high probability of being the same between genetically nonrelated individuals. This obstacle can be overcome if we consider only the very rare SNPs, for which probabilities of being shared by chance in nonrelated individuals drop dramatically (in the direct reverse proportion to the frequency of the considered SNPs).
Distributions of Shared vrGVs in Humans
In order to explore this possible method for predicting distant genetic relations in humans, we computationally filtered a complete subset of vrGVs from the “1000 Genomes” database having frequencies of less than 0.2% in the 2,184 chromosomes from 1,092 sequenced individuals. The distributions of positions of vrGVs along chromosomes are uniform and cover a vast majority of genomic regions, as exemplified in figure 3 and detailed in the supplementary table S2, Supplementary Material online. About 99% of these vrGVs are inside introns or intergenic regions. The number of shared vrGVs between each pair of individuals from the same population has been calculated (fig. 4). The graph reveals that a vast majority of examined pairs from American, Asian, and European populations shared from 50 to 300 vrGVs and form unimodal peaks for each population (fig. 4A). A majority of pairs from three African populations (African Ancestry in Southwest United States [ASW], LWK, and Yoruba in Ibadan, Nigeria [YRI]) share from 200 to 800 vrGVs, and also form unimodal peaks for each population. However, among all 14 populations, 311 pairs shared much higher number of vrGVs (more than a thousand per pair) with the highest number of shared vrGVs being 46,745. Such extra-long tails in the distributions of shared vrGVs were even problematic to illustrate in the same figure together with the main peaks. Therefore, we presented these tails separately in figure 4B, which has a 50-fold different scale compared with the peaks in figure 4A. All 40 pairs with declared genetic relationships from 1000 Genomes are marked by stars in figure 4B. These declared relatives share 6,252–46,745 vrGVs and represent the right-most points in the tails of distributions in figure 4B. Besides these 40 pairs of known relatives, there are 271 pairs on figure 4B that shared more than a thousand vrGVs (see supplementary table S3, Supplementary Material online) and also dozens of pairs in figure 4A that share several hundreds of vrGVs, which are on the right side of corresponding peaks and clearly separated from the peaks.
Fig. 3.—
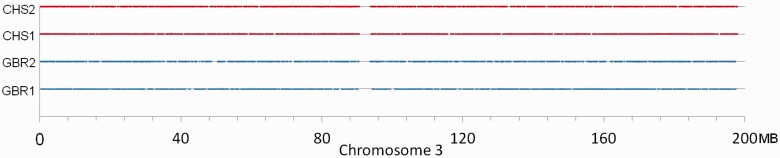
Distribution of vrGVs along chromosome 3 for four randomly picked individuals: Two from Chinese (CHS) population (HG00404 and HG00407 individuals) and two from British (GBR) population (HG00097 and HG00099). Every vrGV is represented by a dot. The detail information about distribution of vrGVs along all chromosomes for these individuals is available from supplementary table S2, Supplementary Material online.
Fig. 4.—

Distribution of number of shared vrGVs between all possible pairs of individuals from the same population. Three populations from Africa (ASW, LWK, and YRI), three populations from America (CLM, MXL, and PUR), three from Asia (CHB, CHS, and JPT), and five from Europe (CEU, FIN, GBR, IBS, and TSI) have been examined. (A) Three-dimensional view of the part of the distributions where the majority of pairs are located. (B) Two-dimensional view of the tails of the distributions, where pairs are presented by circles, triangles, rectangles, and crosses specific for each population. All pairs with declared genetic relations are marked by stars. The color of a star reflects a specific genetic relationship: Red stands for siblings, blue—parent/child pair, green—second order relations, and yellow—third order relations. Scale for the number of shared vrGVs in the graph 4A is expanded 50-fold compared with 4A.
Interestingly, these right tails of distributions of vrGVs have population-specific patterns. For example, one of the African populations, LWK, has the highest number of pairs (260), each with more than a thousand of shared vrGVs. At the same time, another African population (YRI) has only two of such pairs that share 1,193 and 1,841 vrGVs. As the information about the individuals and strategies of their sampling for 1000 Genome Project is publicly unavailable, it is impossible to investigate this issue further. We hypothesize that pairs of individuals that share more than a thousand of vrGVs should have family relationships. Even those pairs, which share hundreds of vrGVs and are clearly separated from the main peaks, are likely formed by distant relatives.
This hypothesis is strongly supported by the calculations of the number of shared vrGVs between populations, shown in supplementary table S4, Supplementary Material online. All studied 44,278 pairs formed by individuals from two different continents have less than 118 shared vrGVs (e.g., the highest number of shared vrGVs between LWK and JPT is 37, LWK–FIN is 80, and GBR–CHB is 117). The number of shared vrGVs between populations from the same Asian or European continent is also low (e.g., maximal number between GBR and FIN is 159 and between CHB and JPT is 78). This means that a pair of European and/or Asian individuals that shares more than 300 vrGVs very likely has a familial relationship. The distributions of shared vrGVs between African populations (LWK vs. YRI and LWK vs. ASW) are demonstrated in figure 5. With three exceptions, all studied 14,453 pairs formed by individuals from two different African populations have less than 623 shared vrGVs (these three exception pairs are discussed in the next section). Detailed examination of the interpopulation distribution of shared vrGVs was performed on the entire set of 8,633 British–Chinese pairs formed by one individual from GBR and another individual from CHB population (see table 1). This table demonstrates that a vast majority (8,547) of these pairs have only single digit numbers of shared vrGVs. Only 3 of 8,633 pairs have 30 or more shared vrGVs. The distribution of shared vrGVs along chromosomes for these three pairs has been analyzed with a Perl program—2individualsGenomeDif_vrGVs.pl. The results for the HG00255–NA18614 pair, which has 30 shared vrGVs, are shown in the table 2, whereas the data for other two pairs with 59 and 117 shared vrGVs are shown in the supplementary table S5, Supplementary Material online. Table 2 demonstrates that 27 of 30 shared vrGVs are located inside a 71-kb genomic segment (positions from 90787654 to 90858949 nt) within chromosome 11. All clustered vrGVs do not show correlations with structural variants in this region. In addition, supplementary table S6, Supplementary Material online, demonstrates that shared vrGVs for HG00255 and NA18614 individuals are present on the same haplotype background. Similar clustering of shared vrGVs was observed for two other British–Chinese pairs (see supplementary table S5, Supplementary Material online). The pair HG01334–NA18627 has all 59 shared vrGVs located within 284-kb locus on chromosome 1, whereas another HG00263–NA18541 pair has 115 shared vrGVs within a 806-kb region inside chromosome 6. Given the enormous size of the human genome (3,300 Mb), the probability (P) of occurrence by chance for the case presented in the table 2 that corresponds to 27 of 30 shared vrGVs located inside 71-kb region is less than 10−117, according to the formula (1):
| (1) |
Fig. 5.—

Distribution of number of shared vrGVs between pairs of individuals from different African populations. First distribution (shown in red) represents pairs in which one individual belongs to LWK population whereas another person to ASW. Second distribution (blue) represents pairs in which one individual is from LWK whereas the other is from YRI.
Table 1.
Distribution of Numbers of Shared vrGVs for 8,633 Human Pairs, Where One Person of a Pair Represents British population, whereas Another Person Represents Chinese population
| No. of Shared | No. of Human |
|---|---|
| vrGVs | Pairs |
| 0 | 903 |
| 1 | 1,828 |
| 2 | 2,045 |
| 3 | 1,584 |
| 4 | 1,009 |
| 5 | 605 |
| 6 | 298 |
| 7 | 149 |
| 8 | 68 |
| 9 | 58 |
| 10 | 22 |
| 11 | 20 |
| 12 | 13 |
| 13 | 3 |
| 14 | 3 |
| 15 | 5 |
| 16 | 4 |
| 17 | 2 |
| 18 | 2 |
| 19 | 0 |
| 20 | 0 |
| 21 | 3 |
| 22 | 1 |
| 23 | 1 |
| 24 | 0 |
| 25 | 0 |
| 26 | 0 |
| 27 | 0 |
| 28 | 1 |
| 29 | 1 |
| 30 | 1* |
| — | 0 |
| 59 | 1* |
| — | 0 |
| 117 | 1* |
Note.—Detail characterization of shared vrGVs for the pair, which has 30 shared vrGVs, is shown in the table 2. Detail characterization of shared vrGVs for three pairs at the bottom of this table (marked by *) is shown in the supplementary table S5, Supplementary Material online.
Table 2.
Characterization of 30 Shared vrGVs for the British–Chinese Pair Composed by HG00255 and NA18614 Individuals
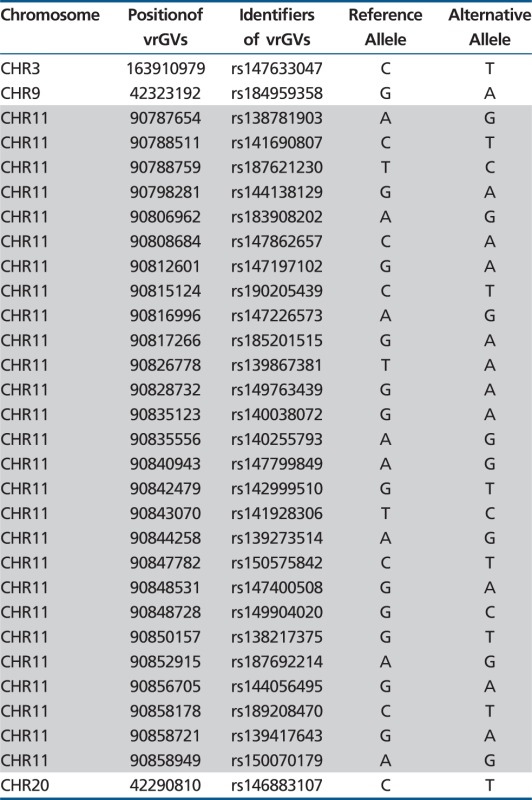 |
Note.—Those vrGVs that are located in the same locus on chromosome 11 are shaded. The detailed description of shared vrGVs for this pair and also for eight other pairs, described in the Results section, is provided in the supplementary table S5, Supplementary Material online.
This formula (1) assumes that all 30 vrGVs are independent and in equilibrium with each other. Therefore, undoubtedly, 27 of 30 independent vrGVs cannot be located within the same short locus by chance. This means that these three British–Chinese pairs represent very distant genetic relatives and their shared vrGVs located in the same locus are IBD and are in linkage disequilibrium with each other. Our observations of the chromosomal distributions of shared vrGVs are in a complete accordance with the population genetics theory that genetic inheritance occurs through chromosomal IBD segments, which are likely to become smaller and smaller with generations due to meiotic recombination events (Browning SR and Browning BL 2010; Huff et al. 2011). In agreement with this theory, these three British–Chinese pairs with very distant genetic relations should likely have only one short IBD per pair. The percentage of common genetic materials (C%) IBD for the British–Chinese pairs under consideration may be calculated by the formula:
| (2) |
where Δl is the size of the IBD segment and L is the size of haploid genome. According to formula (2), these three pairs with 30, 59, and 117 shared vrGVs should have 0.0011%, 0.0043%, and 0.012% of common genetic materials, respectively.
If we consider relatively old population that existed for many hundreds of years (like GBR, FIN, or CHS), a majority of its individuals are likely to be in extremely distant genetic relations to each other (let’s say 20 generations apart). Hence, they should share multiple and very short IBD chromosomal segments (a few thousands of nucleotides) because these IBD segments have been divided by recombinations in multiple generations. All these short IBD segments should contain only a few vrGVs due to their small size. In this respect, let us consider for example the Chinese (CHS) population in which the distribution of shared vrGVs has a peak of 94 (see fig. 4A). A NA18548–NA18567 pair from this population has 303 shared vrGVs and is clearly separated from the corresponding peak on the figure 4A. The distribution of shared vrGVs for this pair is demonstrated in the supplementary table S5, Supplementary Material online. This pair also has a single 36.9-Mb IBD segment on chromosome 2 that contains 199 shared vrGVs. The rest 104 vrGVs have a relatively random distribution across all chromosomes. Several of these 104 shared vrGVs may occasionally be grouped within a short chromosomal region (see supplementary table S5, Supplementary Material online). On the contrary, if we consider a pair from CHS that has a number of shared vrGVs around the peak value of 94 (e.g., pair HG00557–HG00610 with 80 shared vrGVs) the distribution of shared vrGVs along chromosomes for this pair does not have any prominent IBD that contains more than nine shared vrGVs (see supplementary table S5, Supplementary Material online). Supplementary table S5, Supplementary Material online, also contains examples of two intrapopulation pairs for GBR individuals (HG00109–HG00117 and HG00101–HG00099) containing 276 and 324 shared vrGVs, respectively. The number of shared vrGVs corresponding to the two pairs are significantly higher than the peak value of 42 for this population. These pairs have several IBD segments on different chromosomes each containing dozens of shared vrGVs, so these individuals should be in distant genetic relation to each other.
Finally, we examined the interpopulation distribution of shared vrGVs for three populations with African origin (see fig. 5). There are three pairs that have the highest numbers of shared vrGVs and they are clearly separated from the rest of the pairs illustrated in figure 5. They are the following: (NA19443–NA18508) pair for LWK–YRI populations with 1,121 shared vrGVs and two pairs for LWK–ASW populations, NA19350–NA20348 and NA19397–NA20348 with 903 and 939 shared vrGVs, respectively. Distributions of shared vrGVs along chromosomes for these three pairs are also presented in the supplementary table S5, Supplementary Material online. The LWK–YRI pair has a prominent 8.5-Mb IBD region on chromosome 8 that contains a vast majority (1,037) of all shared vrGVs. Therefore, this pair has 0.13% of common genetic material according to formula (2). The other two pairs from LWK–ASW share the same person NA20348 from the ASW population. These two pairs also have a single prominent IBD spanning 14-Mb genomic segment on chromosome 11, which contains more than half (709) of all shared vrGVs for these two pairs. Therefore, these individuals share 0.21% of common IBD genetic materials and should be distantly related to one another.
We did not perform the exhaustive interpopulation comparisons of shared vrGVs because of the enormous amount of computational space required for computation of 549,842 pairs in total, which is beyond the scope of our resources. However, we expect that many more cases for inter- and intrapopulation distant genetic relationships will be revealed for the 1,092 sequenced individuals. All in all, our approach is able to detect distant genetic relations that may share as small as 0.001% of genomic DNA.
Discussion
We demonstrated that human populations are distinct from one another by distribution of genomic differences among their individuals (see fig. 1) and also distribution of shared vrGVs (see fig. 4). Those populations that were formed 1,000 years ago—African (LWK and YRI), Asian (CHS, CHB, and JPT), and European (GBR, FIN, TSI, and CEU)—have sharp and narrow peaks in the corresponding distributions of genomic differences, whereas populations from America that experienced admixture a few hundred years ago, through inclusion of people from different continents, have much wider distributions of genomic differences (see fig. 1A).
Some human populations differ from others by distribution of shared vrGVs. For example, in the LWK population we observed the largest number of pairs (156) that shared more than 800 vrGVs. However, another African population, YRI, has only seven of such pairs shared greater than 800 vrGVs (see fig. 4). LWK population has the widest peak of the distribution of shared vrGVs with the mean-to-SD ratio of 1.2, whereas this ratio in European populations is about 0.3. One of the possible interpretations of this observation is that LWK might have experienced a high level of inbreeding, or it has a distinct subpopulation structure and the sample of LWK individuals was collected disproportionately from a few subpopulations.
Here, we showed that genetic relationships can be effectively determined by the analysis of distribution of shared vrGVs between individuals. This analysis should take into account population structure. For example, number of vrGVs per individual varies among different geographic regions, being the highest in Africa (average vrGVs per individual in LWK is 67,200 and standard deviation, σ, is 7,500) and dropping to 16,200 in Europe (GBR population; σ = 2,650) and 24,100 in Asia (CHB population; σ = 4,100). In these calculations, the threshold (0.2%) for vrGVs determination has been established based on the entire set of 1,092 people from 14 populations. It makes sense to put such a threshold for each population discretely. This has not been done in this article as we have not got enough statistics (the number of people in each population is less than 100). Due to the differences in population structures, we observed significant variations in the number of shared vrGVs between the first and the second order relatives in different populations (see fig. 4 and supplementary table S3, Supplementary Material online). First order relatives (shared 50% common genetic materials) have 28,000–46,000 shared vrGVs in Africa and only about 14,000–20,000 in Asia. This number is proportionally decreased for the second order relatives and further on.
There is a constant and intense influx of novel mutations in humans and other species. On average, each person has from 40 to 100 novel mutations that are absent in the genome his/her parents (Kondrashov and Shabalina 2002; Conrad et al. 2011; Li and Durbin 2011). A majority of these novel mutations are eliminated soon after their arrival by genetic drift and selection. Yet the remaining portion of novel mutations is an important endless source for vrGVs, which pool continuously renovates and maintains at a very high level (14,000–40,000 vrGVs per individual in European and Asian populations). Recent computational analysis of the 1000 Genome database by Moore et al. (2013) also demonstrated the highest abundance of rare GVs, yet they used slightly higher threshold (0.3%) for their frequencies. In the review by Keinan and Clark (2012), the authors summarized the common viewpoint that an excess of rare genetic variants has resulted from the recent explosive growth of human population. Whole-genome dynamics of millions of genetic variants is a very intricate issue that only recently has been touched in computer simulations (Qiu et al. 2014) and also in large-scale computations of 1000 Genomes Project data (Moore et al. 2013).
Impact of Sequencing Errors on the Analysis of Shared vrGVs
As demonstrated on the figure 3, the distribution of vrGVs along chromosomes is relatively even. A majority of vrGVs occur inside largest genomics regions with the longest spans, namely the intergenic regions and introns. According to the publication of 1000 Genome consortium, these nonexome regions have the lowest sequencing coverage (on average x5 times), and thus they have the highest level of sequencing errors. On page 1065 of the 1000 Genome publication, the authors estimated that “in low-coverage project, the overall genotype error rate was 1–3%” (Abecasis et al. 2010). According to the same publication (page 1067), in some cases the error rate maybe approximately 4% (for CEU population) and approximately 10% for YRI depending on the sequence coverage for a genomic region. Misinterpretation of heterozygous sites with homozygous sites is the main cause of errors in interpreting genomic regions with low depth of sequencing coverage. For example, for a heterozygous person with a (G/A) SNP, when a sequence coverage is x6, there is a 1/32 chance that only G or only A nucleotides will be detected in all of the six reads (3% error). It means that, on average, 3% (and in some occasions up to 10%) of vrGVs are randomly missed in 1000 Genomes database. This effect partially explains the large intrapopulation variations in total number of vrGVs between individuals (see the Results section and supplementary table S2, Supplementary Material online). Another type of sequencing error is the misinterpretation of one nucleotide instead of another. The frequency of such type of errors has not been explicitly discussed in the reports of 1000 Genome. However, such errors should occur pretty randomly across the genome and in a majority of cases should be interpreted as an arrival of a novel mutation—a singleton. Such singletons should be sparsely distributed across the genome and should increase the number of vrGVs in individuals. As the length of the human genome is huge (3 billion nucleotides), one vrGV occurs, on an average, per 100-kb region. Hence the probability that nonrelated individuals share the same vrGV is very low (less than one shared vrGVs) per pair. Taking into account that mutations did not occur randomly, but rather at particular hot-spots, this estimation may be raised to a handful of randomly shared vrGVs between nonrelated individuals. Indeed, when we compared number of shared vrGVs between continents (see supplementary table S4, Supplementary Material online) the median number of shared vrGVs was 2 (for CHB–GBR populations), 6 (LWK–FIN), and 8 (for LWK–JPT). Therefore, sequencing errors due to nucleotide misinterpretation should be at most accountable for a handful of shared vrGVs between pairs of individuals and their impact on the overall vrGV analysis should be negligibly small.
In some populations, marriage between relatives is a common practice (http://www.consang.net/index.php/Global_prevalence, last accessed January 22, 2015). For example, we detected a pair from Colombian in Medellin, Colombia (CLM) (HG01277 and HG01278) that has the highest number (2,863) of shared vrGVs for this population. According to “1000 Genomes” annotation table, this pair represents a husband and wife, and we project that they share about 6% of common IBD genetic materials. Therefore, we expect that their child (HG01279, not sequenced yet) should have more than 50% of common genetic materials with each of his/her parents. Presumably, due to this reason, the observed variation of numbers of shared vrGVs among the first order relatives is very wide compared with our modeling. For instance, in LWK population, this variation is from 31,000 up to 46,500. We conjecture that the highest numbers may correspond to the families where marriage occurred between genetic relatives. It is also worth mentioning that actual relationship between siblings or parent/offspring pairs may fluctuate noticeably from 50% (Odegard and Meuwissen 2012). Finally, even within the same population, the number of vrGVs among individuals significantly varies. For example, in Chinese population CHB the average number of vrGVs per individual is 24,100 whereas σ = 4,100. In this population the lowest number of vrGVs (16,745) was detected in HG00403 person, whereas the highest 40,444 in HG00702 individual. All these facts together may explain the large variations in the numbers of shared vrGVs between the pairs of relatives with the same degree of relationship.
In summary, if two individuals share less than a dozen of vrGVs they should descend from different ethnic and geographically diverse populations. In case persons share several dozens of vrGVs located in the same chromosomal region they should have some degree of genetic relationship to each other. Finally, a pair may have dozens to hundreds of shared vrGVs that have a uniform spread over all chromosomes without a strong signal for preferential association or clustering within a particular locus. This means that some predecessors of these individuals belonged to the same population.
All in all, in addition to well-established DNA fingerprinting, application of vrGVs analysis for obtaining distant genetic relations could be a valuable molecular genetic technique in criminal investigations, in civil familial searching as well as for population, clinical, and association studies.
Supplementary Material
Supplementary files S1 and S2, figure S1, and tables S1–S6 are available at Genome Biology and Evolution online (http://www.gbe.oxfordjournals.org/).
Acknowledgments
The authors are grateful to Dr Robert Blumenthal, University of Toledo Health Science Campus, for his insightful discussion of the project. The computations were performed in Oakley supercomputer with support from Ohio Supercomputer Center. They also appreciate the financial support from the Department of Medicine to conduct our research.
Disclosure
The patent of our approach for detection of distant genetic relationships is pending.
Literature Cited
- Abecasis GR, et al. A map of human genome variation from population-scale sequencing. Nature. 2010;467:1061–1073. doi: 10.1038/nature09534. [DOI] [PMC free article] [PubMed] [Google Scholar]
- Abecasis GR, et al. An integrated map of genetic variation from 1,092 human genomes. Nature. 2012;491:56–65. doi: 10.1038/nature11632. [DOI] [PMC free article] [PubMed] [Google Scholar]
- Arnheim N, Calabrese P, Nordborg M. Hot and cold spots of recombination in the human genome: the reason we should find them and how this can be achieved. Am J Hum Genet. 2003;73:5–16. doi: 10.1086/376419. [DOI] [PMC free article] [PubMed] [Google Scholar]
- Barbujani G, Magagni A, Minch E, Cavalli-Sforza LL. An apportionment of human DNA diversity. Proc Natl Acad Sci U S A. 1997;94:4516–4519. doi: 10.1073/pnas.94.9.4516. [DOI] [PMC free article] [PubMed] [Google Scholar]
- Boehnke M, Cox NJ. Accurate inference of relationships in sib-pair linkage studies. Am J Hum Genet. 1997;61:423–429. doi: 10.1086/514862. [DOI] [PMC free article] [PubMed] [Google Scholar]
- Browning BL, Browning SR. Detecting identity by descent and estimating genotype error rates in sequence data. Am J Hum Genet. 2013;93:840–851. doi: 10.1016/j.ajhg.2013.09.014. [DOI] [PMC free article] [PubMed] [Google Scholar]
- Browning SR, Browning BL. High-resolution detection of identity by descent in unrelated individuals. Am J Hum Genet. 2010;86:526–539. doi: 10.1016/j.ajhg.2010.02.021. [DOI] [PMC free article] [PubMed] [Google Scholar]
- Conrad DF, et al. Variation in genome-wide mutation rates within and between human families. Nat Genet. 2011;43:712–714. doi: 10.1038/ng.862. [DOI] [PMC free article] [PubMed] [Google Scholar]
- Durand EY, Eriksson N, McLean CY. Reducing pervasive false-positive identical-by-descent segments detected by large-scale pedigree analysis. Mol Biol Evol. 2014;31:2212–2222. doi: 10.1093/molbev/msu151. [DOI] [PMC free article] [PubMed] [Google Scholar]
- Fagny M, et al. Exploring the occurrence of classic selective sweeps in humans using whole-genome sequencing data sets. Mol Biol Evol. 2014;31:1850–1868. doi: 10.1093/molbev/msu118. [DOI] [PubMed] [Google Scholar]
- Gravel S, et al. Reconstructing Native American migrations from whole-genome and whole-exome data. PLoS Genet. 2013;9:e1004023. doi: 10.1371/journal.pgen.1004023. [DOI] [PMC free article] [PubMed] [Google Scholar]
- Harris K, Nielsen R. Inferring demographic history from a spectrum of shared haplotype lengths. PLoS Genet. 2013;9:e1003521. doi: 10.1371/journal.pgen.1003521. [DOI] [PMC free article] [PubMed] [Google Scholar]
- Hartl DL, Clark AG. Principles of population genetics. Sunderland (MA): Sinauer Associates, Inc. Publishers; 2007. [Google Scholar]
- Hochreiter S. HapFABIA: identification of very short segments of identity by descent characterized by rare variants in large sequencing data. Nucleic Acids Res. 2013;41:e202. doi: 10.1093/nar/gkt1013. [DOI] [PMC free article] [PubMed] [Google Scholar]
- Huff CD, et al. Maximum-likelihood estimation of recent shared ancestry (ERSA) Genome Res. 2011;21:768–774. doi: 10.1101/gr.115972.110. [DOI] [PMC free article] [PubMed] [Google Scholar]
- International HapMap Consortium. The International HapMap Project. Nature. 2003;426:789–796. doi: 10.1038/nature02168. [DOI] [PubMed] [Google Scholar]
- Jobling MA, Gill P. Encoded evidence: DNA in forensic analysis. Nat Rev Genet. 2004;5:739–751. doi: 10.1038/nrg1455. [DOI] [PubMed] [Google Scholar]
- Keinan A, Clark AG. Recent explosive human population growth has resulted in an excess of rare genetic variants. Science. 2012;336:740–743. doi: 10.1126/science.1217283. [DOI] [PMC free article] [PubMed] [Google Scholar]
- Kondrashov AS, Shabalina SA. Classification of common conserved sequences in mammalian intergenic regions. Hum Mol Genet. 2002;11:669–674. doi: 10.1093/hmg/11.6.669. [DOI] [PubMed] [Google Scholar]
- Kruskal WH, Wallis WA. Use of ranks in one-criterion variance analysis. J Am Stat Assoc. 1952;47:583–621. [Google Scholar]
- Li H, Durbin R. Inference of human population history from individual whole-genome sequences. Nature. 2011;475:493–496. doi: 10.1038/nature10231. [DOI] [PMC free article] [PubMed] [Google Scholar]
- Li H, et al. Relationship estimation from whole-genome sequence data. PLoS Genet. 2014;10:e1004144. doi: 10.1371/journal.pgen.1004144. [DOI] [PMC free article] [PubMed] [Google Scholar]
- Moore CB, et al. Low frequency variants, collapsed based on biological knowledge, uncover complexity of population stratification in 1000 genomes project data. PLoS Genet. 2013;9:e1003959. doi: 10.1371/journal.pgen.1003959. [DOI] [PMC free article] [PubMed] [Google Scholar]
- Odegard J, Meuwissen TH. Estimation of heritability from limited family data using genome-wide identity-by-descent sharing. Genet Sel Evol. 2012;44:16. doi: 10.1186/1297-9686-44-16. [DOI] [PMC free article] [PubMed] [Google Scholar]
- Parson W, Bandelt HJ. Extended guidelines for mtDNA typing of population data in forensic science. Forensic Sci Int Genet. 2007;1:13–19. doi: 10.1016/j.fsigen.2006.11.003. [DOI] [PubMed] [Google Scholar]
- Qiu S, et al. Genome evolution by matrix algorithms: cellular automata approach to population genetics. Genome Biol Evol. 2014;6:988–999. doi: 10.1093/gbe/evu075. [DOI] [PMC free article] [PubMed] [Google Scholar]
- Thompson EA. The estimation of pairwise relationships. Ann Hum Genet. 1975;39:173–188. doi: 10.1111/j.1469-1809.1975.tb00120.x. [DOI] [PubMed] [Google Scholar]
- Weir BS, Anderson AD, Hepler AB. Genetic relatedness analysis: modern data and new challenges. Nat Rev Genet. 2006;10:771–780. doi: 10.1038/nrg1960. [DOI] [PubMed] [Google Scholar]
- Willuweit S, Caliebe A, Andersen MM, Roewer L. Y-STR Frequency Surveying Method: a critical reappraisal. Forensic Sci Int Genet. 2011;5:84–90. doi: 10.1016/j.fsigen.2010.10.014. [DOI] [PubMed] [Google Scholar]
- Wright S. Coefficients of inbreeding and relationship. Am Nat. 1922;56:330–338. [Google Scholar]
Associated Data
This section collects any data citations, data availability statements, or supplementary materials included in this article.