Abstract
Backgrounds:
The electroencephalogram (EEG) abnormalities in Alzheimer's disease (AD) have been widely reported, and medial temporal lobe atrophy (MTLA) is one of the hallmarks in early stage of AD. We aimed to assess the relationship between EEG abnormalities and MTLA and its clinical validity.
Materials and Methods:
A total of 18 patients with AD were recruited (the mean age: 77.83 years). Baseline EEGs were analyzed with quantitative spectral analysis. MTLA was assessed by a T1-axial visual rating scale (VRS).
Results:
In relative power spectrum analysis according to the right MTLA severity, the power of theta waves in C4, T4, F4, F8, and T5 increased significantly and the power of beta waves in T6, C4, T4, F8, T5, P3, T3, and F7 decreased significantly in severe atrophy group. In relative power spectrum analysis according to the left MTLA severity, the power of theta waves in T3 increased significantly and that of beta waves in P4, T6, C4, F4, F8, T5, P3, C3, T3, F3, and F7 decreased significantly in severe atrophy group.
Conclusion:
The severe MTLA group, regardless of laterality, showed more severe quantitative EEG alterations. These results suggest that quantitative EEG abnormalities are correlated with the MTLA, which may play an important role in AD process.
Keywords: Alzheimer's disease, medial temporal lobe atrophy, quantitative EEG
Introduction
The population of patients with Alzheimer's disease (AD) has been rapidly increased as ageing has been progressing worldwide. Various clinical assessment methods have been tried to evaluate the disease severity and progression. Changes in electroencephalogram (EEG) and medial temporal lobe atrophy (MTLA) may reflect the neurophysiologic and neuropathologic alterations in AD. However, the relations between the two parameters have not been clearly investigated. The aims of this study are to elucidate the relationships between EEG and MTLA and the clinical validity in the patients with AD.
Background
Since Hans Berger, who developed the EEG, reported the pathologic EEG sequences in AD patients, a substantial number of studies using EEG in AD patients have been conducted.[1,2] It has been revealed that AD patients show increased slow waves (delta and theta) and decreased fast waves (alpha and beta) compared with normal controls.[3,4] Moreover, significant correlations between cognitive decline and EEG abnormalities were reported.[5,6]
MTLA is regarded as a characteristic neuropathological change in the early stage of AD.[7,8] In addition, AD patients with severe MTLA on magnetic resonance imaging (MRI) showed severe memory impairment, and mild cognitive impairment patients with definite MTLA reported a higher risk of AD than patients without MTLA.[9] In brief, MTLA could be a surrogate marker of cognitive dysfunction and pathologic change in AD.
Accordingly, we planned to investigate the clinical validity of quantitative EEG and correlation with MTLA severity.
Materials and Methods
Subjects
This study was conducted on 18 patients with AD who visited the Department of Neurology at Seoul Medical Center. Patients who met the criteria of the Neurological and Communicative Disorders and Stroke-AD and Related Disorders Association (NINCDS-ADRDA) were diagnosed with AD.[10] Cognitive functions for analysis were assessed using the Korean Mini-Mental Status Examination (K-MMSE) and the Frontal Assessment Battery (FAB) scale.[11,12] All subjects provided written consent before the initiation of study. The study received approval by the Institutional Review Board of Seoul Medical Center.
Quantitative EEG
Digital EEG recordings (SynAmps2 Neuroscansystem, Compumedics, Charlotte, NC, USA) were performed in the resting condition (eyes closed) after regular sleep. The EEG was recorded from at 17 sites (F3, F4, F7, F8, Fz, T3, T4, T5, T6, C3, C4, Cz, P3, P4, Pz, O1, and O2) according to the international 10-20 system. The impedance of the electrode was kept below 5 kΩ at each electrode site. All EEGs were recorded with a sampling rate of 500Hz/channel and filtered using a 0.1–40 Hz bandpass filter. The recorded EEG data were analyzed in 20 epochs of 2 s without artifact or sleep waves by the neurologist. A digital fast fourier transforms (FFT)-based power spectrum analysis computed the power density of EEG with range of 1-25 Hz (1~4 Hz, 4~8 Hz, 8~12 Hz, 12~25 Hz). Absolute power is measured as EEG magnitude expressed as microvolts squared, and relative power is expressed by the power in an EEG component band, in proportion to other bands.
Brain MRI imaging and VRS
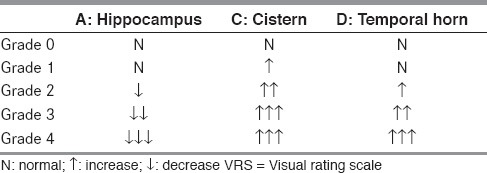
Brain imaging was performed with 1.5 Tesla MRI (SIEMENS, AvantoSyngo) on all the patients. Fast spin echo T1-weighted images with 5-mm thickness axial images parallel to the line connecting the anterior commissure (AC) and posterior commissure (PC) were obtained. The TR, TE, and flip angles were shown to be 500 ms, 11 ms, and 90°, respectively. The T1 axial imaging VRS, which has been already proven to demonstrate a high correlation with Schelten coronal VRS, was estimated as below [Table 1].[13] To sum up, in the images showing the midbrain where the hippocampus is the most clearly observed, the longest width of the hippocampus (A), the shortest distance between the hippocampus and brainstem, i.e. the width of the crural cistern and ambient cistern (C), and the width of the temporal horn of lateral ventricles (D) were assessed and scored from 0 to 4 points.[13,14]
Table 1.
Axial VRS (Adapted from Kim GH et al., 2009).

Statistical analysis
Statistical analyses were conducted using the Statistical Package for the Social Sciences (SPSS) (version 11.5). The required two-tailed level of significance for all tests was set at 0.05. Data were expressed as mean ± standard deviations (SD). The means and SD of the values were calculated and submitted to statistical analysis by Fisher's exact test and the Mann–Whitney U-test.
Results
A total of 18 AD patients participated in the study (15 women and three men). Subjects’ demographic characteristics are shown in Table 2. The mean age ± SD was 77.83 ± 7.96 years. The mean K-MMSE score was 17.11 ± 6.32, and the mean FAB score was 7.67 ± 3.88. Patients were divided into two groups: mild MTLA group (VRS ≤ 2) or severe MTLA group (VRS > 2). An analysis of the participants’ right hemispheres showed 10 mild MTLA patients and eight severe MTLA patients, and an analysis of participants’ left hemispheres showed 12 mild patients and six severe patients. In baseline characteristics analysis, no significant differences, except the apparent opposite MTLA, were found between the two groups.
Table 2.
Baseline characteristics of the subjects

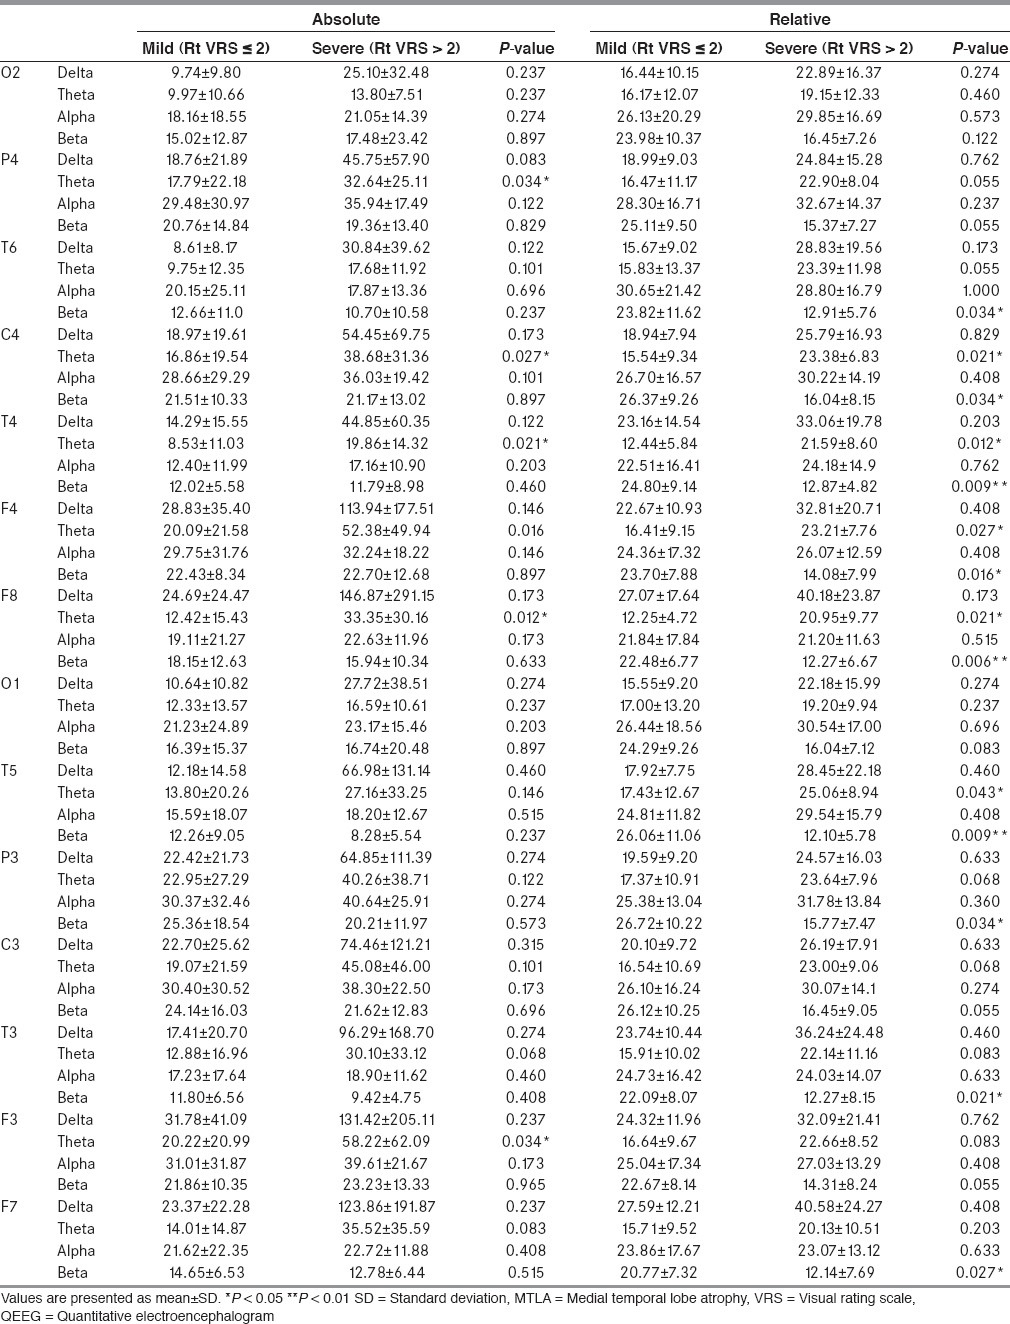
In the spectral analysis of right MTLA severity, absolute theta power in the severe MTLA group increased significantly in the right parietal (P4), central (C4), temporal (T4), and frontal (F3) areas [Table 3]. Relative theta power in the severe MTLA group increased significantly in the right central (C4), temporal (T4), frontal (F4, F8) areas, and the left temporal (T5) areas. Relative beta power in the severe MTLA group decreased significantly in both hemispheric multiple areas (T6, C4, T4, F8, T5, P3, T3, and F7).
Table 3.
QEEG according to right hemispheric MTLA severity

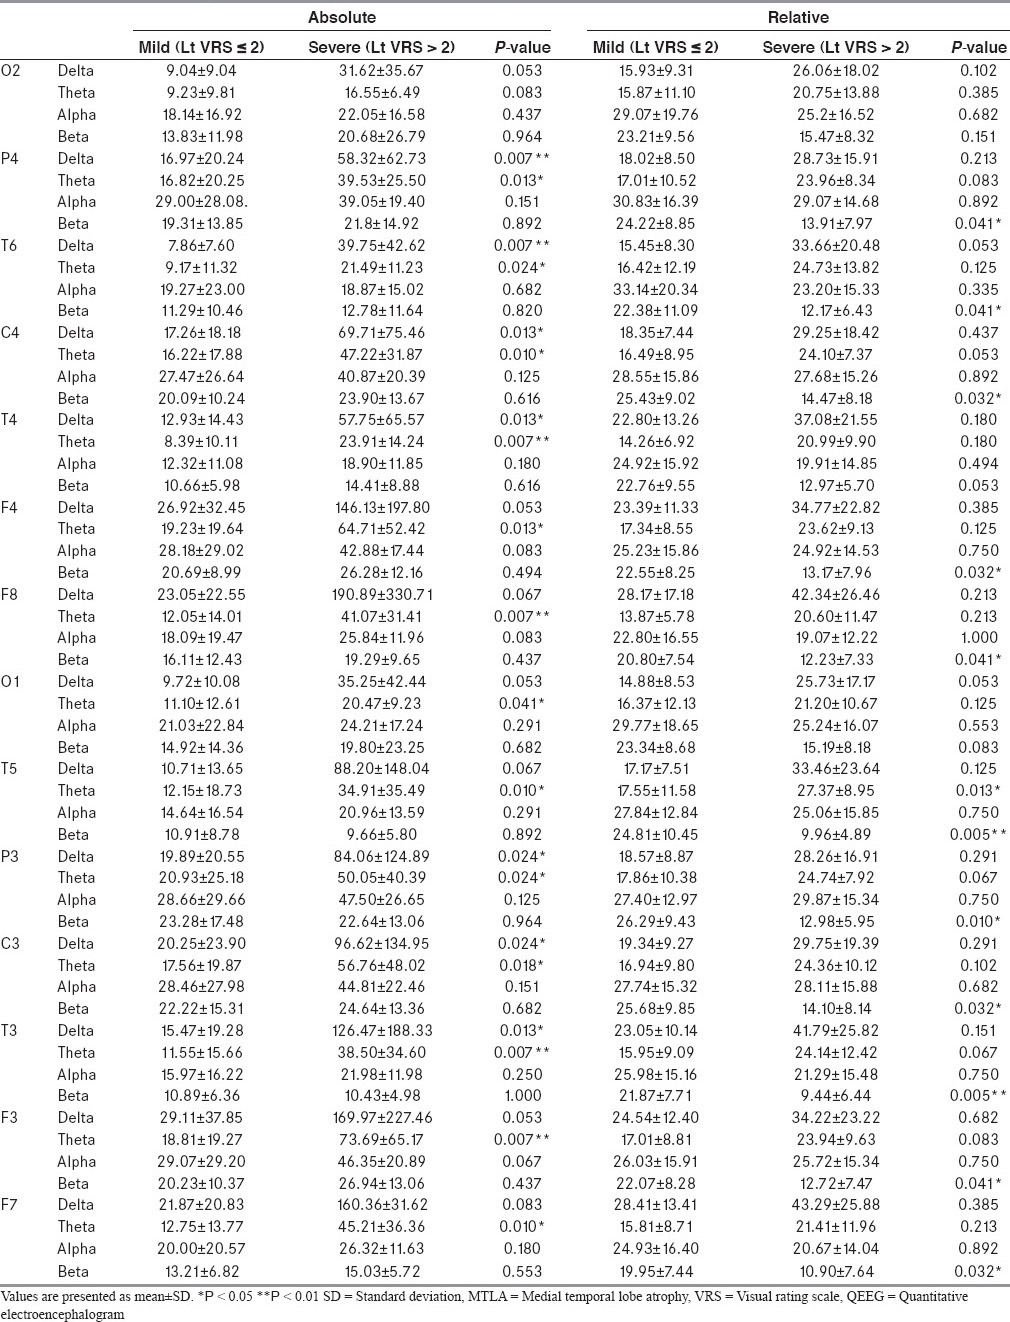
In the spectral analysis on the basis of left MTLA severity, absolute delta (P4, T6, C4, T4, P3, C3, and T3) and theta (P4, T6, C4, T4, F4, F8, O1, T5, P3, C3, T3, F3, and F5) power in the severe MTLA group increased significantly [Table 4]. In addition, relative beta power decreased significantly in multiple areas (P4, T6, C4, F4, F8, T5, P3, C3, T3, F3, and F7) and relative theta power increased significantly in the left temporal (T3) area of the severe MTLA group.
Table 4.
QEEG according to left hemispheric MTLA severity

Discussion
We confirmed that the severe MTLA group showed more severe quantitative EEG abnormalities in multiple areas than the mild MTLA group in this study. However, laterality in quantitative EEG abnormalities could not be clearly distinguished because most patients who showed severe unilateral MTLA also showed severe MTLA on the opposite side as well. Further research could clarify this issue by testing AD patients with asymmetric MTLA.
Despite the insufficient amount of information on detailed spatial distribution, the correlation between quantitative EEG abnormalities and MTLA was reported previously.[15] Our study revealed that the severe MTLA group showed more severe quantitative EEG abnormality than mild MTLA group in most of cerebral areas except for occipital areas regardless of atrophic side. Considering that MTLA appears as constructional changes, after pathophysiological changes such as beta amyloid deposition or tau hyperphosphorylation, the presence of electrophysiological changes of the brain in severe MTLA group might have preceded the atrophy, which could be reflected in quantitative EEG. Greater cortical atrophy in patients with mild AD than in patients with amnestic mild cognitive impairment (MCI) was seen in most of brain cortical areas.[16] The differences are greater in medial and inferior temporal, posterior cingulate, temporal, and parietal association corticies, which are affected earlier in the disease process. Our finding that the severe MTLA group showed more severe abnormal quantitative EEG findings in nearly the entire brain is in line with the previous report.[16] The quantitative EEG showed more prominent degradation in the severe MTLA group than in the mild MTLA group, especially in the left hemisphere. Therefore, quantitative EEG assessing MTLA could be a useful strategy in observing the progress of AD.
The present study has several limitations, such as small number of subjects, resulting in low statistical power, and no significant differences of MMSE and FAB scores between the severe and mild MTLA groups. Considering the previous studies reporting the correlation between cortical atrophy and cognition, however, cortical atrophy, quantitative EEG, and cognition may be closely related and future research could determine this with a large sample.[17] Because relation between beta amyloid load and cerebral atrophy has not been established in AD patients, degree of pathological change from quantitative EEG could not be inferred.[18] Contrary to MCI or AD, patients with subjective cognitive impairment showed a significant relationship between beta amyloid deposition and global/gray matter atrophy, which suggests that beta amyloid plays a major role in the very early stage, and other pathologic events may affect the subsequent atrophy process. Further study clarifying the usefulness of quantitative EEG as a neurophysiologic tool reflecting AD progress is needed.
Footnotes
Source of Support: Nil
Conflict of Interest: None declared.
References
- 1.Berger H. Uber das Elektrenkephalogramm des Menschen (On the Electroencephalogram of Man). Dritte Mitteilung (3rd report) Arch Psychiatr Nervenkr. 1931;94:16–60. [Google Scholar]
- 2.Jeong J. EEG dynamics in patients with Alzheimer's disease. Clinical Neurophysiology. 2004;115:1490–505. doi: 10.1016/j.clinph.2004.01.001. [DOI] [PubMed] [Google Scholar]
- 3.Bennys K, Rondouin G, Vergnes C, Touchon J. Diagnostic value of quantitative EEG in Alzheimer’ disease. Neurophysiol Clin. 2001;31:153–60. doi: 10.1016/s0987-7053(01)00254-4. [DOI] [PubMed] [Google Scholar]
- 4.Kwak YT, Kim DS, Hahm DS, Han IW. Usefulness of quantified-EEG in Alzheimer's disease. J Korean Neurol Assoc. 2000;18:575–80. [Google Scholar]
- 5.Schreiter-Gasser U, Gasser T, Ziegler P. Quantitative EEG analysis in early onset Alzheimer's disease: Correlations with severity, clinical characteristics, visual EEG and CCT. Electroencephalogr Clin Neurophysiol. 1994;90:267–72. doi: 10.1016/0013-4694(94)90144-9. [DOI] [PubMed] [Google Scholar]
- 6.Kwak YT. Quantitative EEG findings in different stage of Alzheimer's Disease. J Korean Neurol Assoc. 2005;23:356–62. doi: 10.1097/01.wnp.0000223453.47663.63. [DOI] [PubMed] [Google Scholar]
- 7.Mistur R, Mosconi L, Santi SD, Guzman M, Li Y, Tsui W, et al. Current challenges for the early detection of Alzheimer's disease: Brain imaging and CSF studies. J Clin Neurol. 2009;5:153–66. doi: 10.3988/jcn.2009.5.4.153. [DOI] [PMC free article] [PubMed] [Google Scholar]
- 8.Rusinek H, Endo Y, De Santi S, Frid D, Tsui WH, Segal S, et al. Atrophy rate in medial temporal lobe during progression of Alzheimer disease. Neurology. 2004;64:2354–9. doi: 10.1212/01.wnl.0000148602.30175.ac. [DOI] [PubMed] [Google Scholar]
- 9.Visser PJ, Verhey FR, Hofman PA, Scheltens P, Jolles J. Medial temporal lobe atrophy predicts Alzheimer's disease in patients with minor cognitive impairment. J Neurol Neurosurg Psychiatry. 2002;72:491–7. doi: 10.1136/jnnp.72.4.491. [DOI] [PMC free article] [PubMed] [Google Scholar]
- 10.McKhann G, Drachman D, Folstein M, Katzman R, Price D, Stadlan EM. Clinical diagnosis of Alzheimer's disease: Report of the NINCDS-ADRDA work group under the auspices of Department of Health and Human Services Task Force on Alzheimer's disease. Neurology. 1984;34:939–44. doi: 10.1212/wnl.34.7.939. [DOI] [PubMed] [Google Scholar]
- 11.Kang YW, Na DL, Hahn SH. A validity study on the korean mini-mental state examination (k-mmse) in dementia patients. J Korean Neurol Assoc. 1997;15:300–7. [Google Scholar]
- 12.Kim TH, Huh YS, Choe JY, Jeong JW, Park JH, Lee SB, et al. Korean version of frontal assessment battery: Psychometric properties and normative data. Dement Geriatr Cogn Disord. 2010;29:363–70. doi: 10.1159/000297523. [DOI] [PubMed] [Google Scholar]
- 13.Kim GH, Kwon HJ, Go SA, Kim JE, Park KD, Ghoi KG, et al. T1-axial medial temporal atrophy visual rating: A comparable study with schelten's t1-coronal visual rating. Dement Neurocogn Dis. 2009;8:37–44. [Google Scholar]
- 14.Heo JH, Kim MK, Lee JH, Lee JH. Usefulness of medial temporal lobe atrophy visual rating scale in detecting Alzheimer's disease: Preliminary study. Ann Indian Acad Neurol. 2013;16:384–7. doi: 10.4103/0972-2327.116951. [DOI] [PMC free article] [PubMed] [Google Scholar]
- 15.Ommundsen N, Engedal K, Oksengard AR. Validity of the quantitative EEG statistical pattern recognition method in diagnosing Alzheimer's disease. Dement Geriatr Cogn Disord. 2011;31:195–201. doi: 10.1159/000324878. [DOI] [PubMed] [Google Scholar]
- 16.Apostolova LG, Steiner CA, Akopyan GG, Dutton RA, Hayashi KM, Toga AW, et al. Three-dimensional gray matter atrophy mapping in mild cognitive impairment and mild Alzheimer disease. Arch Neurol. 2007;64:1489–95. doi: 10.1001/archneur.64.10.1489. [DOI] [PMC free article] [PubMed] [Google Scholar]
- 17.van der Vlies AE, Staekenborg SS, Admiraal-Behloul F, Prins ND, Barkhof F, Vrenken H, et al. Associations between magnetic resonance imaging measures and neuropsychological impairment in early and late onset Alzheimer's disease. J Alzheimers Dis. 2013;35:169–78. doi: 10.3233/JAD-121291. [DOI] [PubMed] [Google Scholar]
- 18.Chetelat G, Villemagne VL, Bourgeat P, Pike KE, Jones G, Ames D, et al. Australian Imaging Biomarkers and Lifestyle Research Group. Relationship between atrophy and beta-amyloid deposition in Alzheimer disease. Ann Neurol. 2010;67:317–24. doi: 10.1002/ana.21955. [DOI] [PubMed] [Google Scholar]


