

Abstract
Background
Many northern-hemisphere forests are dominated by oaks. These species extend over diverse environmental conditions and are thus interesting models for studies of plant adaptation and speciation. The genomic toolbox is an important asset for exploring the functional variation associated with natural selection.
Results
The assembly of previously available and newly developed long and short sequence reads for two sympatric oak species, Quercus robur and Quercus petraea, generated a comprehensive catalog of transcripts for oak. The functional annotation of 91 k contigs demonstrated the presence of a large proportion of plant genes in this unigene set. Comparisons with SwissProt accessions and five plant gene models revealed orthologous relationships, making it possible to decipher the evolution of the oak genome. In particular, it was possible to align 9.5 thousand oak coding sequences with the equivalent sequences on peach chromosomes. Finally, RNA-seq data shed new light on the gene networks underlying vegetative bud dormancy release, a key stage in development allowing plants to adapt their phenology to the environment.
Conclusion
In addition to providing a vast array of expressed genes, this study generated essential information about oak genome evolution and the regulation of genes associated with vegetative bud phenology, an important adaptive traits in trees. This resource contributes to the annotation of the oak genome sequence and will provide support for forward genetics approaches aiming to link genotypes with adaptive phenotypes.
Electronic supplementary material
The online version of this article (doi:10.1186/s12864-015-1331-9) contains supplementary material, which is available to authorized users.
Keywords: Oak, Transcriptome, de novo assembly, Comparative genomics, RNA-seq, Bud phenology
Background
Many northern-hemisphere forests are dominated by evergreen and deciduous oaks (Quercus spp.). The genus Quercus consists of about 400 species extending over a wide range of environmental conditions, from temperate to subtropical regions. Some sympatric species (such as Q. robur, Q. petraea, Q. pyrenaica, Q. faginea, and Q. pubescens in Europe) occupy different ecological niches [1] and are therefore interesting models for studies of plant adaptation [2] and ecological speciation [3]. An important question in biological science concerns the response of these long-lived organisms to rapid environmental change, their ability to evolve and the mechanisms involved. The genes and associated structural and expressional variants required for adaptation must be identified if we are to address these questions. To this end, a number of genomic tools and resources have been developed for oaks (reviewed in [4]), including two bacterial artificial chromosome (BAC) libraries [5], a large number of SSRs [6] that have been used to generate linkage maps [7] and expressed sequence tags (ESTs), mostly obtained by Sanger and Roche 454 sequencing [8,9]. Researchers can now use these tools to address concerns about the adaptability of forest trees at the genomic level. However, studies aiming to address this objective have been hampered by a lack of genomic resources. Ultra-deep sequencing methods, in particular, could help to expand the oak transcript catalog for studies of the genomic mechanisms underlying plastic responses and evolutionary adaptation to environmental change. RNA-seq is a method of choice for quantifying gene expression [10,11], and for identifying genes preferentially expressed at specific developmental stages [11] or in specific physiological conditions [12]. RNA-seq can be used to infer gene regulatory networks on the basis of enrichment analysis for pathways and gene ontology groups [13], using established knowledge from model organisms [14], or with dedicated statistical approaches [15] for the de novo identification of sets of co-expressed genes. In this study, RNAseq was used to identify genes regulated during bud dormancy release, an important phase of vegetative bud phenology, known to be strongly affected by temperature and photoperiod and therefore, likely to be greatly disturbed by the unprecedented warming associated with climate change [16]. Low temperatures are essential to overcome endo-dormancy (chilling requirement), but high temperatures are also required for bud break (heat requirement). The effect of climate change, with milder autumns and warmer winters, on the timing of bud flush and the impact of exposure to late spring frost are key questions in forestry requiring a detailed understanding of the physiological and molecular mechanisms (and their genetic variability) involved in dormancy release. We addressed these questions, by studying the dynamics of gene expression over this critical period, focusing on two successive phases of bud dormancy release: i) eco-dormancy, a dormancy state prevailing in late winter and spring imposed by environmental conditions unfavorable for growth (i.e. heat requirement not fulfilled), and ii) swelling bud, which occurs in spring, just before bud burst, when the heat requirement for bud break is almost satisfied.
Once established, transcriptome analysis can also be used in a comparative framework, to reveal some of the evolutionary features of a genome, through the inference of whole-genome duplication and speciation events, for example [17,18]. It has been proposed that modern eudicots have derived from a founder ancestral genome structured in 21 protochromosomes followed by series of whole genome duplications (WGD) or polyploidizations and ancestral chromosome fusions and fissions [19]. Polyploidization has been proposed as a key evolutionary mechanism in providing new genetic material leading to morphological and phenotypic innovations through neo and/or subfunctionalizations of duplicated gene pairs [19]. To this regards, how the twelve modern oak chromosomes evolved from the eurosid ancestor with respect to duplication and chromosome rearrangement patterns is still largely unknown. In this context, the main objectives of this study were: i) to enlarge the current oak EST resource through the use of ultrahigh-throughput sequencing technology and to combine the data obtained with available sequences expressed in different tissues, at different developmental stages, and in response to different biotic and abiotic stresses, to generate the most comprehensive annotated unigene set for oak, and ii) to use this resource to increase our understanding of the structure, function (focusing particularly on bud dormancy release) and macroevolution of the oak genome.
Results
Sequencing and assembly of the oak transcriptome
Transcriptomes are a valuable genomic resource for studies in non-model organisms for which genome sequences are not available, because they are smaller and less complex than genomes. The de novo assembly of transcriptome sequence data from a single sequencing platform has become a routine task, and a handful of de novo transcriptome assemblers have been developed [20], but combining the outputs from multiple sequencing platforms remains challenging [21] and involves the use of suitable assembler software for different types of datasets (short/long; single/paired-end reads). In this study, we used a combination of Sanger, Roche-454 and Illumina technologies and bioinformatic tools to generate a catalog of oak transcripts from RNA obtained from different tissues, developmental stages and in response to biotic and abiotic stresses (Additional file 1). Long and short reads were assembled independently, with robust assemblers (see workflow in Figure 1 and detailed procedure in Additional file 2) and the resulting assemblies were combined to produce a final meta-assembly (Oak Contig V3.0, OCV3). The main characteristics of these two pre-assemblies and the final meta-assembly are summarized in Table 1A.
Figure 1.
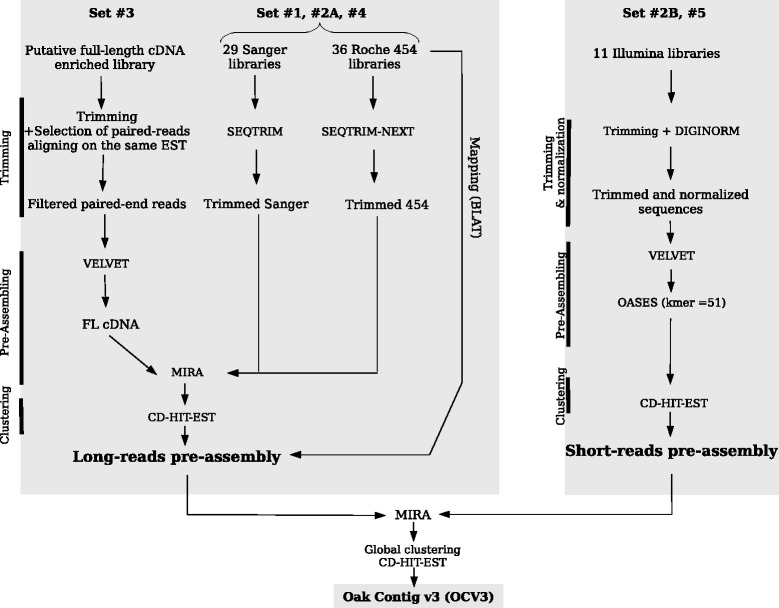
Schematic representation of the bioinformatic analysis.
Table 1.
Description of oak transcriptomic assemblies
| A/ Assembly | Long-reads | Short-reads | OCV3 | ||
|---|---|---|---|---|---|
| Number of trimmed sequences considered in the assembly | 2,888,537 | 417,337,626 | / | ||
| Number of trimmed sequences incorporated in the assembly | 2,003,295 | 417,337,626 | 274,867 | ||
| Number of contigs > 100bp, after redundancy reduction | 44,272 | 230,595 | 192,097 | ||
| Number of singletons | 300,373 | 40,119,145 | / | ||
| Consensus (total bp) | / | / | 199,278,344 | ||
| Average contig size (bp) | 937 | 877 | 1,037 | ||
| B/ | OCV1 | OCV2 | OCV3 | ||
| Number of contigs | 69,154 | 65,712 | 192,097 | ||
| Mean length (bp) | 705 | 1,003 | 1,037 | ||
| Median (bp) | 606 | 734 | 597 | ||
| N50 (bp) | 908 | 1,545 | 1,879 | ||
| Consensus (bp) | 48,751,826 | 65,913,455 | 199,278,344 | ||
| Nb of annotated contigs in SwissProt | 34,614 | 38,292 | 63,857 | ||
| Nb of unique SwissProt ID | 13,333 | 16,429 | 17,476 | ||
| C/ | Number of contigs > 100bp, after redundancy reduction | Assembly (total bp) | Mean contig size (bp) | Median contig size (bp) | N50 (bp) |
| OCV3-91k | 90,786 | 148,088,893 | 1,631 | 1,292 | 2,329 |
| OCV3-101k | 101,311 | 51,187,294 | 505 | 328 | 697 |
| OCV3 | 192,097 | 199,278,344 | 1,037 | 597 | 1,879 |
A Characteristics of the long-reads, short-reads and meta assemblies (OCV3).
B Side-by-side comparison of oak unigene sets (OCV1: assembly from Ueno et al. [8], OCV2: assembly from Tarkka et al. [22], and OCV3: this paper). N50 length is defined as the length for which the collection of all contigs of that length or longer contains at least half of the total of the lengths of the contigs.
C Comparison between OCV3-91k (Unigenes with BlastX hit) and OCV3-101k (Unigenes without BlastX hit) subsets: assembled sequences (in bp), mean and median contig sizes, N50.
Long-read pre-assembly
The sequencing of 29 and 36 cDNA libraries with Sanger and 454 technologies (sets #1, #2A and #4 in Figure 1) resulted in 94,174 and 2,790,004 trimmed reads respectively. The distribution of trimmed ESTs is shown in Additional file 3. A total of 6,571 putative FL-cDNA clones (set #3) sequenced with the Illumina/Solexa GA-II X (PGTB, Plateforme Génome transcriptome de Bordeaux), yielded 17,196,106 paired end reads. Then, de novo assembly with Velvet and TGICL software yielded 4,359 contigs. By combining Sanger, Roche-454 and reconstructed FL-cDNA data, we obtained 2,888,537 long sequences used to construct a long-read pre-assembly with MIRA. We finally obtained 44,272 contigs, with a mean sequence length of 937 bp (standard deviation: 521 bp; N50: 1,118 bp, defined as the largest entity E such that at least half of the total size of the entities is contained in entities larger than E; see the black curve in Additional file 4).
Short-read pre-assembly
A total of 961,151,725 Illumina reads (set #2B and #5), 80.2% corresponding to Illumina sequences generated in the present study, allowed to generate a short-read pre-assembly of 230,595 contigs with a mean sequence length of 877 bp (SD 1,069 bp; N50 1,758 bp, red curve in Additional file 4).
Meta-assembly
The meta-assembly was generated with MIRA. Using the 274,867 pre-assembly contigs (44,272 long-read contigs and 230,595 short-read contigs), we obtained a final assembly (OCV3) consisting of 192,097 contigs, which is available from the Quercus portal (https://w3.pierroton.inra.fr/QuercusPortal/index.php?p=est). In total, 1,623 (0.84%) and 2,747 (1.43%) contigs yielded significant hits with the oak chloroplast and mitochondrial genomes, respectively. The mean contig size for OCV3 was 1,037 bp (SD 1,150 bp; N50 1,879 bp, green curve in Additional file 4) which is close to the mean gene length in eukaryotes (1,346 bp, [23]). By assembling short and long reads together in a single unigene set, we were able to improve the first oak transcriptome assembly (OCV1) established by Ueno et al. 2010 [8] from Sanger and Roche-454 reads (Table 1B). Simultaneously, we improved OCV2 recently established for a single Q. robur genotype (Table 1B, [22]). It is difficult to compare the size of the meta-assembly (about 192 thousand contigs) with those of other projects with similar aims and approaches, because it is influenced by genome and transcriptome sizes, the diversity of tissues/developmental stages/environmental conditions, the number of cDNA sequences produced, and the assembly method used. However, if we consider recent studies on forest trees, the OCV3 meta-assembly is of a similar size to those of Pseudotsuga menziesii (170,859 contigs [24]) and Pinus pinaster (210,513 contigs [25]), larger than that of Castanea molissima (40,039 contigs [26]), and smaller than of Pinus contorta (303,450 contigs, [27]).
Functional annotation
Sequence similarity to SwissProt accessions and other plant proteomes
We characterized the oak transcriptome by a similarity-based approach, using proteomes of closely related plant species and SwissProt accessions. We used the BlastX algorithm to align the 192,097 OCV3 contigs with these proteomes, and obtained a significant match for 90,786 oak contigs (referred to hereafter as the OCV3-91 k subset). Similar numbers of hits were obtained with the selected gene models: 77,784 hits in Arabidopsis thaliana (At), the species most phylogenetically distant from Quercus considered, to 84,852 hits in Prunus persica, the closest species considered (Table 2). OCV3 contigs matched a total of 17,476 different SwissProt accessions and between 16,573 (Vitis vinifera) and 23,053 (Populus trichocarpa) sequences in plant gene models. The number of oak contigs displaying similarity in terms of deduced amino-acid sequences with the content of at least one of the databases studied (90,786) was much greater than the number of genes present in oak (about 30,000, as estimated from BAC-end sequences, [5]). This overestimation may be due to contig redundancy, contig fragmentation (contig breaks in low-coverage regions), unassembled alleles, particularly for highly polymorphic diploid species of this type, with a mean of one SNP or Indel every 25–30 bp [28], splicing variants, sequencing errors, or sequence read misattribution between closely related paralogs due to the presence of recently duplicated genes. We found that the 18,587 Prunus persica gene model sequences with a hit in OCV3-91 k matched, on average, 4.6 oak contigs each, highlighting the redundant nature of OCV3-91 k. However, we also found that 13,536 (i.e. 72.8%) of the matched Prunus gene model sequences displayed 75% coverage with a single oak contig each, indicating that many of the oak genes for which a closely related gene was present in peach were well assembled. However, paralog assembly may also have contributed to erroneous gene predictions. In the species with the closest phylogenetic relationship to Quercus analyzed here (i.e. Prunus persica) more than 19,000 different genes were tagged, corresponding to about two thirds of the protein-coding genes of oak.
Table 2.
BlastX results for OCV3 contigs against SwissProt database and the proteomes of five species: Prunus persica, Vitis vinifera, Populus trichocarpa, Eucalyptus grandis, Arabidopsis thaliana
| Prunus | Vitis | Populus | Eucalyptus | Arabidopsis | SwissProt | All | |
|---|---|---|---|---|---|---|---|
| Nb of oak contigs with a hit | 84,852 | 82,655 | 81,849 | 78,143 | 77,784 | 63,857 | 90,786 |
| Nb of proteins with a hit | 18,587 | 16,573 | 23,053 | 22,338 | 18,661 | 17,476 | / |
| total nb of proteins or accessions | 28,701 | 26,346 | 45,033 | 46,315 | 35,386 | 540,732 | / |
The remaining 101,311 contigs without BlastX hits in SwissProt or the selected plant gene models (referred to hereafter as the OCV3-101 k subset) were then aligned (using BlastX: e-value 1e−5 -E 2 -W 5) with the nr protein database and the genome sequence of Prunus persica (using BLAT and EST2 genome software, [29]). Only 2.4% of these contigs could be aligned with sequences in the nr protein database. These contigs also diverged much more than the OCV3-91 k subset (Table 3A) from the Prunus persica genome. Matches to the Prunus persica genome sequence were obtained for 59% of the OCV3-91 k contigs but only 6.2% of the OCV3-101 k contigs. Moreover, we successfully mapped 64,001 OCV3-91 k and only 8,380 OCV3-101 k contigs onto 17,038 and 5,265 Prunus persica gene models, respectively (Table 3B). The number of exons per gene model was three times higher for OCV3-91 k than for OCV3-101 k. All together, these results indicate that OCV3-101 k consisted mostly of non-coding RNA. Besides, OCV3-91 k contained 46,415 (51%) contigs supported by short reads only, whereas OCV3-101 k contained 86,575 (85%) such contigs. The shorter mean size of contigs in OCV3-101 k may also have resulted in the presence of less biological meaningful information. Indeed, mean and median contig sizes were three times greater in OCV3-91 k than in OCV3-101 k (Table 1C), consistent with the presence of a larger amount of valuable information for functional characterization of the oak transcriptome in OCV3-91 k. We therefore concentrated on OCV3-91 k for subsequent analyses.
Table 3.
Mapping results against the Prunus persica genome and gene models
| A | OCV3 | (OCV3-91k) | (OCV3-101k) |
|---|---|---|---|
| Number of sequences | 192,097 | 90,786 | 101,311 |
| Number of mapped sequences | 59,851 (31.1%) | 53,600(59%) | 6,251 (6.2%) |
| Number of matches | 64,292 | 54,954 | 9,338 |
| Number of matched exons | 209,795 | 200,252 | 9,543 |
| Number of exons/model | 3.26 | 3.64 | 1.02 |
| Mean of identity percent | 83.99% | 82.75% | 91.26% |
| Number of monoexonics | 29,767 | 20,591 | 9,176 |
| B | (OCV3-91k) | (OCV3-101k) | |
| Number of sequences | 90,786 | 101,311 | |
| Number of mapped contigs | 64,001 (70.5%) | 8,380 (8.27%) | |
| Number of P. persica gene models | 17,038 (59.4%) | 5,265 (18.3%) | |
A Mapping results (BLAT software) for OCV3, OCV3-91k (Unigenes with BlastX hit) and OCV3-101k (unigenes without BlastX hit) against the Prunus persica genome.
B Mapping results (BlastN) for OCV3-91k and OCV3-101k against the Prunus persica gene models.
Functional annotation and GO classification of oak transcripts
We assigned functions to the OCV3-91 k contigs with the Gene Ontology (GO) classification, which provides a standardized set of terms to describe the genes and gene products of different species. First, we designated functions for each contigs on the basis of matches with the Pfam database. A total of 1,112 GO terms to 24,999 contigs (i.e. 27.54%) were identified. A second series of GO annotation was based on the GOA database. For the 77,784 OCV3-91 k contigs giving significant matches to A. thaliana proteins, 65,198 (i.e. 71.82%) were annotated with at least one GO term. We retrieved the functional categories associated with their best Blast hits in SwissProt, and this yielded 13,355 GO terms for 61,139 contigs. Based on best Blast hit results, we were able to associate 76,457 contigs with GO terms in this second round. Overall, at least one GO term was assigned to 77,277 contigs (i.e. 85.12% of OCV3-91 k) (Additional file 5); 24,180 of these contigs (31.29%) were associated with GO terms from both series, 819 contigs (1.06%) were associated with GO terms from the first series, and 52,278 contigs (67.65%) were associated with GO terms from the second series. For the 77,277 contigs associated with at least one GO term, 72,558 were associated with 1,820 GO terms (70%) for Biological Processes (BP) , 72,235 were associated with 267 GO terms (10%) for Cellular Components (CC) and 71,458 were associated with 515 GO terms (20%) for Molecular Functions (MF) , accounting for a total of 2,602 GO terms (Additional file 6). These proportions are similar to those in the GOA database: 25,725 (66%), 3,474 (9%) and 9,685 (25%) GO terms for BP, CC and MF, respectively. Setting the Gene Ontology graph level to 2 decreased the number of GO terms considerably, to 18 for BP, 11 for CC and 12 for MF (Figure 2). The most abundant GO Slim terms were cellular process (GO: 0009987; 56,132 contigs), binding (GO:0005488; 48,227 contigs) and cell (GO:0005623; 66,082 contigs), for BP, MF and CC, respectively. Comparing the ranking of the main GO terms with those for other phylogenetically related species (e.g. Castanea dentata) and more distantly related species (e.g. Eucalyptus grandis, which is also a eurosids, and Pseudotsuga menziesii, from the Pinaceae), a remarkable match was found for the GO category Molecular Functions, for which sufficient comparable data were available for the four species (Additional file 7). These results suggest that a large proportion of the plant’s genes were present in OCV3-91 k. Finally, it would be tempting to highlight the differences in functional classes between the OCV3-91 K sequences associated with GO terms and At GO annotations. However, we believe that such an analysis would be misleading, given the complex nature of any transcript catalog. We will wait until the generation of an oak gene model before carrying out such analyses, to avoid making erroneous predictions [30].
Figure 2.
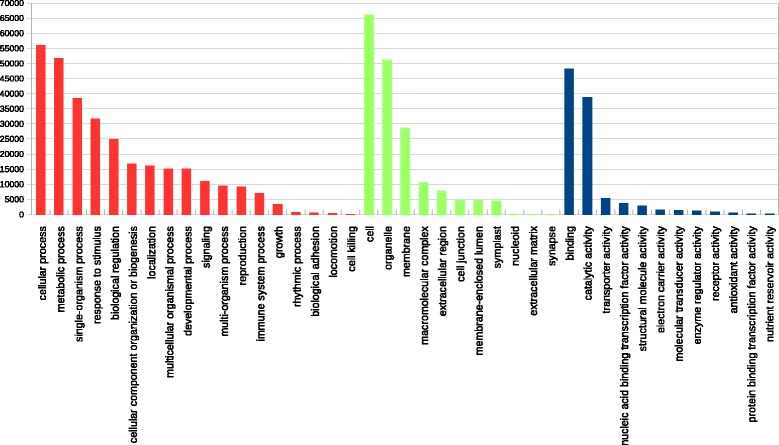
Gene ontology classification of OCV3-91 k contigs. GO Slim terms contributing to the annotation of the 77,277 OCV3_91k contigs. Red: Biological process. Green: Cellular component. Blue: Molecular function.
Comparative genomics and the detection of conserved orthologous sequences common to peach
The rosids comprise two major clades of orders [31]: the fabids (i.e. eurosids I) and the malvids (i.e. eurosids II). Quercus species are fabids and are relatively closely related to Prunus (Figure 3A). BlastX alignment of the OCV3-91 k contigs with the malvid (Arabidopsis, Eucalyptus), fabid (peach, poplar) and basal rosid (grape) gene models (Table 2) demonstrated that evolutionary relationships (based on the Ks metric, see the Methods section) between oak and fabid representatives (red distribution in Figure 3B) were stronger than those between oak and malvid representatives (blue distribution in Figure 3B). In particular, 62,593 OCV-91 k contigs yielded BlastX hits with Prunus persica (closely related to oak) model genes, 9,549 of which (corresponding to 60,189 oak contigs) were located on eight major scaffolds corresponding to the eight chromosomes of the peach genome. These 9,549 orthologous sequences (listed in Additional file 8) delivered the following chromosomal relationship density: chromosome #1: 5,910 peach genes (blue curve in Figure 3C)/2,104 oak orthologs (red curve), chromosome #2: 3,162/1,096, chromosomes #3: 2,932/1,001, chromosome #4: 3,373/1,128, chromosome #5: 2,469/883, chromosome #6: 3,685/1304, chromosome #7: 2,884/1,054, chromosome #8: 2,841/979.
Figure 3.
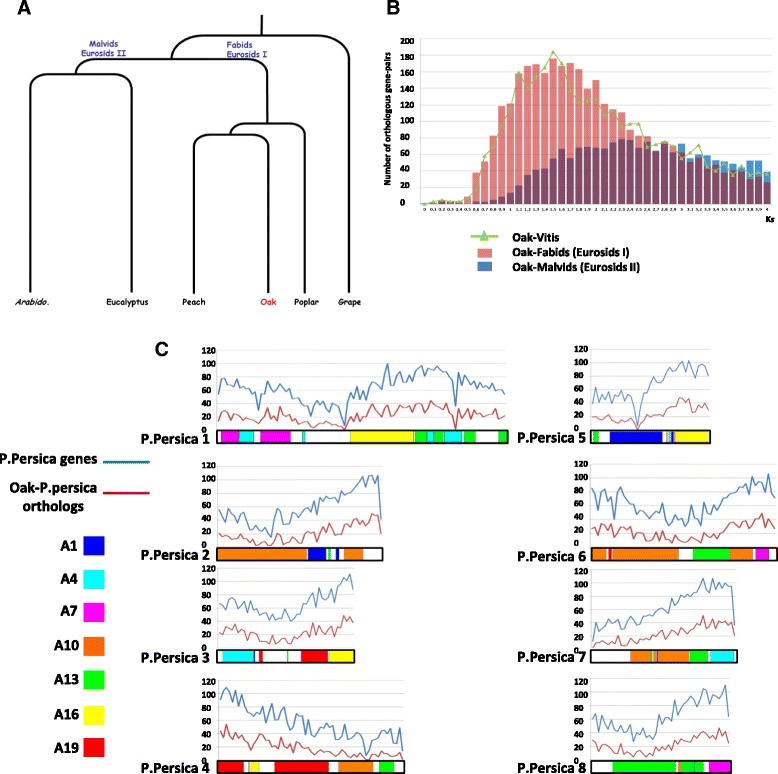
Oak genome orthologous relationships. A. Simplified phylogenic tree placing oaks among sequenced malvid (Arabidopsis, eucalyptus), fabids (peach, poplar) and basal rosid (grape) genomes. B. Distribution of Ks values (x-axis) for orthologous gene pairs between oak and malvids (Arabidopsis, eucalyptus: in blue), between oak and fabids (peach, poplar: in red) and between oak and grape (in green). Grape is considered to be the modern representative of the ancestral eudicot genome. C. Distribution of peach gene models (blue curve) and 9,549 orthologous gene pairs with oak (red curve) along the 8 peach chromosomes. Peach chromosomes are illustrated as a mosaic of 7 colours highlighting the features of the ancestral eudicot chromosome (A1, A4, A7, A10, A13, A16, A19) as in [19].
This similarity in genome organization between oak and peach was used as an input to highlight the collinearity between the oak and peach genomes and to investigate whether genetic information from one species can be transferred to another, particularly as concerns phenology-related QTLs. In particular, further genetic mapping of the 9,549 characterized COS markers between oak and peach will immediately illuminate the synteny relationships with the malvids and fabids and ultimately evolutionary history of the 12 oak chromosomes from the eudicot ancestral genome reported as structured in 7 protochromosomes. Finally the delivered heterologous oak/peach map offer the opportunity to select oak genes either covering the entire peach genome or specifically located in a peach locus of interest related to a specific agronomic trait.
Expression pattern for oak transcripts
This analysis was based on the high-throughput sequencing (Illumina technology) of six cDNA libraries (listed in Additional file 1): ecodB, eco-dormant bud; swB, swelling bud; XY, secondary differentiating xylem; RO, root; LE, leaf and CA, in vitro dedifferentiated callus. Two approaches were used to determine the tissue-related expression of oak contigs. First, the contigs were classified according to the tissue of origin of their reads, and the tissues were clustered on the basis of their expression profiles. Second, statistical tests were used to identify genes displaying significant differential expression between pairs of tissues. For biological interpretation, we focused on the comparison between two developmental stages of vegetative bud dormancy release: eco-dormancy (ecodB) and swelling bud before bud break (swB) (Table 4). The reference for this analysis was the OCV3-91 k subset.
Table 4.
Subset of genes differentially expressed between Ecodormancy and Swelling buds stages
| Biological process | Gene function | Ath accession number | Fold change ratio ( Ecodormant bud / Swelling buds ) | position in the functional gene network |
|---|---|---|---|---|
| Genes up-regulated in Ecodormant buds | ||||
| Ribosome biogenesis | T13C7.4 (60S ribosomal protein L14) | AT2G20450 | >100 | |
| Ribosome biogenesis | F12L6.5 (ribosomal protein L23A) | AT2G39460 | >100 | |
| Ribosome biogenesis | T9J14.13 (ribosomal protei S24e) | AT3G04920 | >100 | |
| Ribosome biogenesis | Ribosomal protein L232A | AT3G55280 | >100 | |
| Ribosome biogenesis | T25K17.40 (ribosomal protein L31e) | AT4G26230 | >100 | |
| Ribosome biogenesis | K16F13.2 (40S ribosomal protein S27-3) | AT5G47930 | >100 | |
| Ribosome biogenesis | MUP24.13 (60S ribosomal protein L12) | AT5G60670 | >100 | |
| Ribosome biogenesis | F10K1.22 (60S ribosomal protein L35a) | AT1G07070 | >100 | |
| Ribosome biogenesis | T2P11.7 (60S ribosomal protein L34) | AT1G26880 | >100 | |
| Ribosome biogenesis | F19K6.12 (60S ribosomal protein L37) | AT1G52300 | >100 | |
| Ribosome biogenesis | STV1 (ribosomal protein L24) | AT3G53020 | >100 | |
| Ribosome biogenesis | Zinc-binding ribosomal protein | AT3G60245 | >100 | |
| Ribosome biogenesis | PRPL11 (plastid ribosomal proteinL11) | AT1G32990 | >100 | |
| Ubiquitin dependent rotein catabolic process | UBC28 (ubiquitin conjugating enzyme 28) | AT1G64230 | >100 | Neighbors of sbi-miR169r-3p_agpf_35 |
| Ubiquitin dependent protein catabolic process | FKF1 (flavin-binding kelch repeat F box 1) | AT1G68050 | >100 | Neighbors of ELF3, Neighbors of GI |
| Ubiquitin dependent protein catabolic process | UBQ11 (ubiquitin 11) | AT4G05050 | >100 | Neighbors of heat shock |
| Ubiquitin dependent protein catabolic process | ASK2 (Arabidopsis SKP-Like2) | AT5G42190 | >100 | |
| Ubiquitin dependent protein catabolic process | ATUBA1 (ubiquitin activating enzyme 1) | AT2G30110 | >100 | |
| Response to cold | DREB1A (DREB subfamily A-1) | AT4G25480 | >100 | Neighbors of cold stress, DREB and CBF |
| Response to cold | CBF1 (C repeat/DRE binding factor 1) | AT4G25490 | >100 | Neighbors of cold stress, DREB and CBF |
| Response to cold | 1 (low expression of osmotically responsive gene | AT1G56070 | >100 | Neighbors of cold stress |
| Response to cold | LTI30 (Low temperature induce temperature) | AT3G50970 | >30 | Neighbors of cold stres, ABA and CBF |
| Response to cold | RCI3 (rare cold inducible gene 3) | AT1G05260 | >100 | Neighbors of cold stress |
| Response to cold | Fib (Fibbrilin 1A) | AT4G04020 | >50 | Neighbors of ABA |
| Response to water deprivation | ATBI-1 (Bax inhibitor 1) | AT5G47120 | >100 | Neighbors of drought and COLI |
| Response to water deprivation | SIP3 (CBL interacting protein kinase 6) | AT4G30960 | >100 | |
| Response to water deprivation | CBL9 (calcineurin B like protein 9) | AT5G47100 | >100 | Neighbors of ABA, drought and cold |
| Response to gibberelin stimulus | Gasa1 (GAST1 protein homolg1) | AT1G75750 | >100 | |
| Response to gibberelin stimulus | Gasa2 (GAST1 protein homolg2) | AT4G09610 | >100 | |
| Response to gibberelin stimulus | AGL20 (Agamous like 20) | AT2G45660 | >100 | Neighbors of AP1 |
| Response to high light intensity | Bag6 (Bcl-2-associated athanogene 6) | AT2G46240 | >100 | Neighbors of heat shock |
| Genes up-regulated in swelling buds | ||||
| DNA dependent DNA replication initiation | MCM6 | AT5G44635 | >3 | |
| DNA dependent DNA replication initiation | MCM3 | AT5G46280 | >3 | |
| DNA dependent DNA replication initiation | PRL (prolifera) | AT4G02060 | >2 | Neighbors of cell cycle , DNA replication |
| DNA dependent DNA replication initiation | CDC45 (cell division cycle 45) | AT3G25100 | >6 | Neighbors of mitosis , DNA replication |
| DNA dependent DNA replication initiation | T12C22.19 (MCM2) | AT1G44900 | >2 | |
| Regulation of cell cycle and cell division | CYCB 1;4 (cyclin dependent protein kinase) | AT2G26760 | >10 | |
| Regulation of cell cycle and cell division | CYCD1;1 (cyclin D-type protein) | AT1G70210 | >10 | Neighbors of CYCD1;1 and CYCD1;3 |
| Regulation of cell cycle and cell division | CYCD5;1 (cyclin D-type protein) | AT4G37630 | >100 | Neighbors of cell cycle |
| Regulation of cell cycle and cell division | CYCA3;2 (cyclin D-type protein) | AT1G47210 | >2 | Neighbors of morphogenesis and cell differenciation |
| Regulation of cell cycle and cell division | CYCD3;1 (cyclin D-type protein) | AT4G34160 | >7 | Neighbors of CYCD1;1 and CYCD1;3 |
| Response to auxin | OBP1 (OBF binding protein) | AT3G50410 | >3 | Neighbors of cell cycle |
| Response to auxin | Aux1 (auxin influx transporter) | AT2G38120 | >6 | Neighbors of primordium elongation s and cell differenciation |
| Response to gibberellin | Gasa4 (Gast1 protein homolog 4) | AT5G15230 | >10 | Neighbors of heat shock and flower development |
| Response to gibberellin | Myb26 (MYB domain protein 26) | AT3G13890 | >100 | Neighbors of cell development |
| Response to brassinosteroid | Bas1 (cythochrom P450) | AT2G26710 | >7 | Neighbors of leaf development and hormone |
| response to brassinosteroid | T5I8.2 (hercule receptor protein kinase 2) | AT1G30570 | >40 | Neighbors of brassinolide |
| Response to sucrose stimulation | GBF6 (leucine zipper11) | AT4G34590 | >2 | |
| Response to sucrose stimulation | GASA6 (GA stimulated arabidopsis 6) | AT1G74670 | >10 | |
The most differentially expressed GO terms identified in the enrichment analysis are indicated in the first column for each dormancy stage.
The localization of the genes in the functional network is indicated in the last column when available.
Identification of transcripts differentially expressed across a panel of tissues
An inventory of the numbers of contigs present in several oak tissues or specific to a given tissue revealed that RO (roots harvested from six-month-old seedlings after exposure to cold, heat, high CO2 concentration, water stress and hypoxia) made the greatest contribution to the OCV3-91 k contigs, with 78,502 (86.47%) matching contigs (Additional file 9). Adding a second tissue (endodB) to the RO dataset further increased the number of contigs by 6.7% (6,084 new contigs). Successive additional inclusions of LE, CA, swB and XY increased the number of contigs by 2.43% (2,202 contigs), 1.01% (919 contigs), 0.57% (521 contigs) and 0.31% (283 contigs), respectively. We found that 56,672 contigs (62.42%) contained reads from all six tissues. These 56,672 contigs were particularly long, with a mean length of 2,025 bp. We also found that 66,885, 73,305, 78,480 and 83,601 contigs contained reads from at least 5, 4, 3, and 2 tissues, respectively. Finally, in total, 4,910 contigs were associated with a single tissue type: 1,756 were specific to RO, 1,039 to ecoDB, 977 to LE, 514 to CA, 341 to swB and 283 to XY). The mean length of these contigs was 684 bp (Additional file 10). As expected, a large part of the transcriptome is shared by all tissues. Nevertheless, sequencing of diverse tissues allowed to identify transcripts specific to each of them and was required for comparing expression level of genes involved in dormancy. The list of “tissue-specific” transcripts, with annotations, is provided in Additional file 11. These “tissue-specific” transcriptomes yielded valuable and specific additive information for inclusion in the catalog of oak transcripts, which can be accessed by interested scientists. Normalized read counts are provided for OCV3-91 K and OCV3-101 K in Additional file 12.
Tissues were then clustered according to their transcriptomic distances, based on the 91 k annotated contigs. Two major groups were identified on the resulting dendrogram, shown in Additional file 13. The first cluster included tissues resulting from primary (bud) and secondary (xylem) meristem activities. Interestingly, encodB clustered more closely with XY than swB, suggesting that very different regulatory networks control these two phenological phases of bud dormancy release. In the second cluster the two highly specialized tissues, RO and LE, clustered closer to each other than to CA, probably due to the very specific nature of the totipotent state of the in vitro dedifferentiated callus tissue.
We used three methods to identify contigs displaying differential expression between each pair of tissues: R statistics, EdgeR, and DESeq (see the Methods section). RO and XY were ranked first in terms of the number of contigs with expression levels different from those in other tissues (Figure 4), whereas ecodB showed the lowest level of differential expression, particularly when compared with swB and XY, consistent with the clustering result. The results for in vitro callus tissue (totipotent state) were not consistent with our initial expectations, i.e. the expression of a much larger array of “specific” genes than the more specialized tissues, such as root, leaf or xylem.
Figure 4.
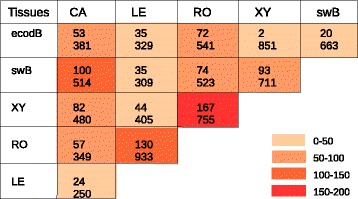
OCV3-91 k contigs differentially expressed between six pairs of tissues (ecodB: ecodormant bud, swB: swelling bud, XY: differentiating secondary xylem, RO: root, LE: leaf and CA: dedifferentiated in vitro callus). Number of significantly differentially expressed contigs identified by three (upper number) and two (lower number) statistical methods.
Identification of candidate genes for differential expression during bud dormancy release
The mapping of the 59,050,722 ecodB and 63,191,029 swB paired-reads onto the OCV3 assembly was successful for 21,137,289 ecodB reads and 23,699,876 swB reads. The ecodB and swB reads were integrated into 153,783 OCV3 contigs. The ecodB and swB reads were distributed between 136,441 and 134,875 contigs, respectively. Reads from both libraries were simultaneously detected in 117,533 contigs, whereas 18,908 contigs contained reads from ecodB only and 17,342 contigs contained reads from swB only. Analysis of the 153,783 integrated contigs with R statistics (see the Methods section) identified 6,004 (3.13%) contigs displaying differential expression (R > 8), whereas the DESeq and EdgeR R Bioconductor packages detected 823 (0.43%) and 1,632 (0.85%) differentially expressed contigs, respectively (FDR 5%). Only 23 contigs were identified by all three methods (Additional file 14) and 862 contigs were identified by at least two statistical methods (Figure 5 and Additional file 15). In total, 663 of these 862 contigs belonged to OCV3-91 k. GO term enrichment analysis was performed for these 663 differentially expressed contigs, with Pathway Studio software. Both the Gene and Plant Ontology databases were used.
Figure 5.
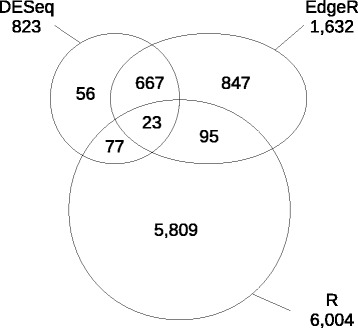
Venn diagram showing the number of differentially expressed genes during bud dormancy release identified by 3 statistical algorithms; 6,004 differentially expressed contigs were identified by the R statistics method, 823 by DESeq and 1,632 by EdgeR (see Materials and Methods ).
Among the 663 contigs, 340 were found to be upregulated in ecodormant buds (146 “specifically” at this phenological stage and 194 were more strongly expressed in ecodB than in swB, Additional file 16). For this first set of genes, enrichment analysis for pathways and groups (EAPG, p-value < 0.05) yielded 202, 71 and 137 hits for the biological process (BP), cellular component (CC) and molecular function (MF) categories of the Gene Ontology database, respectively (Additional file 16). The five BP terms displaying the highest level of enrichment corresponded to “ribosome biogenesis”, “translation”, “response to cold”, “response to water deprivation” and “response to cadmium ion”. Similar results were reported by Ueno et al. in 2013 [32] for 454 sequencing on eco-dormant buds. In this previous investigation, a forcing test was used to determine the dormancy status of the buds. No such test was carried out in our study. The similarity in BP terms between the two studies suggests that the buds analyzed here were also in the ecodormancy phase. The first five MF groups related to “structural constituent of ribosome”, “transmembrane receptor activity”, “calmodulin binding”, “translation factor activity”, “nucleic acid binding” and “nucleoside-triphosphate activity”. Finally, 86 significant hits (EAPG, p < 0.05) were obtained against the Plant Ontology database, with the ontologies displaying the highest levels of differential expression corresponding to “guard cell”, “stamen”, “LP.08 eight leaves visible”, “LP.06 six leaves visible” and “male gametophyte”.
A total of 323 contigs were upregulated in swelling buds, 44 being “specific” to this phenological stage and 279 being more strongly expressed in swB than in ecodB (Additional file 16). For this second set of genes, 192, 45 and 148 EAPG hits (p value < 0.05) were obtained with the BP, CC and MF terms of the Gene Ontology database, respectively. The five BP categories displaying the highest level of enrichment were “DNA-dependent DNA replication initiation”, “regulation of cell cycle”, “DNA unwinding involved in replication”, “cell cycle and microtubule-based movement activity”. The MF categories displaying the highest level of enrichment were “carboxylesterase activity”, “lipid binding”, “microtubule motor activity”, “DNA-dependent ATPase activity” and “cyclin-dependent protein kinase regulator activity”. Finally, 102 significant hits (EAPG; p < 0.05) were obtained against the Plant Ontology database, the BP categories displaying the highest level of enrichment being “IL.00 inflorescence just visible”, “pedicel”, “F mature embryo stage”, “expanded cotyledon stage” and “4 anthesis groups”.
Subnetwork enrichment analysis (FNSE function in Pathway Studio; p < 0.05) was then performed for this set of 663 differentially expressed contigs (Additional file 16). Two distinct subnetworks were constructed from Arabidopsis homologs of ecodB and swB contigs with Pathway Studio; they were merged, as presented in Figure 6. Mean expression values shown in red (more strongly expressed in ecodB) and blue (more strongly expressed in swB) highlight the differences in central hubs and associated partners between these two phenological stages. EAPG (p < 0.05) on entities of these two subnetworks clearly supported our view that the gene expression patterns in eco-dormant and swelling buds were truly different. Indeed, the central hubs identified during ecodormancy related mostly to resistance to cold stress and water deprivation, whereas those identified in swelling buds related mostly to cell division and development (see discussion section).
Figure 6.
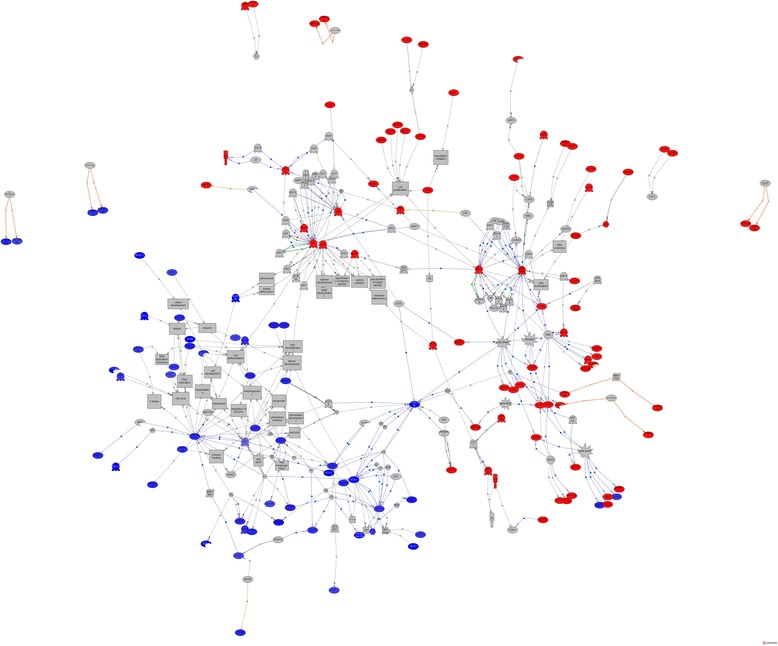
Functional network predicted from the list of genes upregulated in ecodormant bud (in red) or swelling bud (in blue) based on the subset of 663 differentially expressed OCV3-91 k contigs (listed in Additional file 16 ). It is possible to zoom on particular parts of the network in the .tif file.
Discussion
The unigene set established in this study constitutes the most comprehensive transcript catalog assembled to date for the genus Quercus. We have also used this resource to design a high-density SNP array, and we have validated the SNPs detected in silico, by evaluated their Mendelian segregation in four pedigrees and determining their level of diversity in four white European oak species [33]. We discuss here the ways in which this resource improves our understanding of the molecular mechanisms involved in vegetative bud dormancy release, by comparing the abundance of mRNAs at two phenological stages: ecodormant buds and swelling buds just before bud break. This section therefore provides an overview of the molecular mechanisms involved in dormancy release in pedunculate oak in light of both the ontologies and central hubs identified in the enrichment analysis (Figure 6). Tissue specificity was also considered, in an attempt to identify specific markers of these two phenological stages.
Transcripts upregulated during ecodormancy
In trees, ecodormancy occurs when unfavorable environmental conditions (mostly cold temperatures in temperate regions) prevent bud break in early spring. The molecular machinery involved in ecodormancy is poorly understood, but recent studies have reported an accumulation of transcripts relating to cold stress, water deprivation and hormonal stimuli [34].
Ribosome biogenesis
In total, 17 genes belonged to this functional category, a key component of the regulation of gene expression (Table 4). Thirteen of these genes were expressed in a bud-specific manner, but four were expressed in all the tissues studied. Most of the bud-specific genes encoded proteins very similar to ribosomal proteins (AT2G20450, AT2G39460.1, AT3G04920, AT3G55280, AT4G26230, AT5G47930, AT5G60670, AT1G07070, AT1G26880, AT1G52300 and AT3G53020), but one (AT3G60245) encoded a zinc-binding ribosomal protein. In plants, exposure to low temperatures rapidly leads to major changes in the proteome, probably driven to some extent by changes in ribosome biosynthesis modulated by changes in levels of expression of the structural components of ribosomes. Degenhardt et al. [34] reported that the two paralogs of the Arabidopsis thaliana RPL23 gene (also identified in this ontology) responded coordinately to developmental and stress stimuli, such as cold acclimation. A gene (AT1G32990) encoding a plastid ribosome protein (PRPL11) was also identified in this functional category. PRPs are major components of the plastid ribosome. In 2014, Song et al. [35] showed, in a rice mutant with PRP protein downregulated, that the accumulation of the corresponding transcript was strongly regulated by cold stress. They hypothesized that this gene was essential for normal chloroplast development during freezing tolerance.
In ecodormant buds, the cells have to deal with the instability of biomolecules. The synthesis of new ribosomes may facilitate maintenance of the translational machinery of the cell under unfavorable conditions. In the meantime, protein catabolism should eliminate malformed or non-functional proteins. We found significant enrichment for the term “ubiquitin-dependent protein catabolic process”, which was represented by five genes (“ubiquitin-dependent protein catabolic process”: UBC28, FKF1, UBQ11, ASK2, ATUBA1, Additional file 16).
Response to cold
In total, 15 genes belonged to this functional category, four of which were expressed specifically in buds, five of which were overexpressed in buds (fold-change ratio ≥10 with respect to the other tissues of the panel) and six of which were constitutively expressed (Table 4). Two relevant transcription factors for cold acclimation (DREB1A and CBF1) were identified in this study. These transcription factors are known to regulate the expression of many cold-responsive genes [36] promoting the initiation of cold acclimation and freezing tolerance in plants. Their overexpression in ecodormant buds may therefore increase the tolerance of meristematic cells to low temperature. A Los1 gene encoding a translation elongation factor 2-like protein was also identified in this category. This gene has been strongly implicated in the development of freezing tolerance in Arabidopsis thaliana. Guo et al. [37] identified the Los1 gene as a key regulator of the CBF1/DREB1 complex. Indeed, they showed that a lack of expression of this gene led to a lack of translation of the CBF1 and DREB1 transcripts, resulting in the repression of genes involved in cold acclimation. Several cold-responsive genes (members of the LTI and RCI gene families) were also identified, including LTI30, which encodes a dehydrin protein known to accumulate during cold stress. The expression of this gene is also tightly regulated by the CBF transcription factors [38] and ABA, an important hormone involved in seed dormancy. RCI3, which encodes a rare cold-inducible protein, was also identified. The precise role of RCI genes in dormancy regulation remains unclear, but several studies have reported the accumulation of transcripts from these genes in the bud during dormancy [39], suggesting a possible role in freezing tolerance. Finally, a Fib gene, encoding a fibrillin protein, was also identified. Fibrillins are lipid-binding proteins known to accumulate under cold stress. It is thought that they may be involved in the photoinhibition of PSII during cold stress [40], thereby protecting the chloroplast against frost damage. This gene is also regulated by the CBF transcription factor [41].
Response to water deprivation
Eight genes belonged to this functional category (Table 4). One was specifically expressed in the bud (ATBI-1), three were overexpressed in the bud (fold-change ratio > 10, DREB1A, LTI 30 and SIP 3) and four were constitutively expressed in all the tissues of the panel. Some of these genes were also identified in the ontology terms corresponding to the response to cold stress, suggesting that some molecular functions are common to these two biological processes. ATBI-1 encodes a Bax inhibitor 1 protein localized in the endoplasmic reticulum. Bax inhibitor genes were identified in both animals and plants. The precise molecular function of these genes is poorly understood, but they are probably involved in preventing the cell death induced by diverse biotic and abiotic stresses (reviewed by Ishikawa et al. [42]). This suggests that this gene may be involved in delaying cell death in the bud during cold stress, enabling the cell to cope with unfavorable environmental conditions. SIP3 encodes CBL-interacting protein kinase 6. Once activated, the products of CBL genes transduce the calcium signal by phosphorylating downstream signaling components. He et al. [43] reported that the CBL-interacting protein kinase 6 of cotton played a role in the drought stress response, through regulation of the expression of targeted genes. Arabidopsis mutants constitutively expressing this gene are also characterized by an enhanced tolerance to drought and salt stress, suggesting a possible role of this transcription factor in adaptation to diverse abiotic stresses. Finally, CBL9 encodes calcium sensor calcineurin B-like 9. Doğramaci et al. [44] reported the involvement of this calcium sensor protein as a key component of the ABA signaling pathway. Mutant line overexpressing this gene was found to be hypersensitive to ABA during seed germination and seedling growth.
Response to gibberellin stimuli
Five genes belonged to this functional category. Three genes were overexpressed in the bud (T30D6.7, GASA1 and GASA 3, fold-change ratio from 3 to 10) and two were constitutively expressed (Table 4). Two of the genes identified (GASA1 and GASA3) encode a GA-stimulated transcript (GAST) homolog. Da Silveira Falavigna et al. [39] reported the overexpression of GAST genes in the dormant buds of apple trees. A similar result was also reported by Doğramaci et al. [44] for leafy spurge. The precise role of GAST genes in dormancy regulation remains poorly understood, but these authors suggested a key role for gibberellin in dormancy regulation. The AGL20 gene, another gene from this category, encoding a protein very similar to the AGAMOUS-LIKE 20 protein, was also identified. AGL-20 is a MADS box gene that has been reported to encode an integrator of several environmental stimuli. Its level of expression is correlated with flowering time in Arabidopsis thaliana [45]. Trainin et al. [46] reported the possible involvement of polymorphism of this gene in the regulation of dormancy release in apricot, suggesting a possible role for AGL20 in the breaking of dormancy.
Response to high light intensity
Three genes were identified in this category. One was specifically expressed in buds (RPL23AB, also involved in ribosome biosynthesis), one was overexpressed in bud (BAG6, fold-change ≥ 10) and one was constitutively expressed (T1P17.2). BAG proteins are much less well understood in plants than in animals. BAG proteins are characterized by a BAG domain that interacts with the ATPase domain of HSP 70/HSC70. In Arabidopsis thaliana, BAG proteins are encoded by an eight-member multigene family thought to be involved in programmed cell death through calcium signaling [47]. Kobayashi et al. [48] described a possible role for plant BAG proteins in floral transition, through activation of the expression of the CONSTANS gene. To our knowledge, our study is the first to report the overexpression of this gene during ecodormancy.
Transcripts upregulated in the swelling bud
The mechanisms underlying bud break have been less thoroughly studied than those underlying ecodormancy and endodormancy. The ontology terms associated with this subset of genes correspond to cell division (Additional file 16), indicating a “restarting” of mitotic activity in the meristematic cells. This reinitiation of mitosis must occur before bud break, when environmental conditions become favorable.
DNA-dependent DNA replication initiation
Five genes belonged to this category (Table 4). None were specifically or preferentially expressed in the highly specialized tissues of the bud. Four of these genes (AT5G44635, AT1G44900, AT5G46280 and AT4G02060) encode proteins very similar to minichromosome maintenance proteins (MCM proteins). In plants, MCM proteins have been implicated in cell division and are responsible for ensuring that the DNA of the cell is replicated only once per cell division. MCM proteins are encoded by a six-member multigene family and they interact with each other to form a complex. MCM proteins are relatively well characterized in plants. We identified MCM6 (AT5G44635) in this study, a gene that has been reported to be essential for normal plant growth and development [49]. Dang et al. [50] showed that its expression was induced during salt and cold stress. This gene is also strongly expressed in active dividing tissue, suggesting a major effect of MCM6 during cell cycle and proliferation [50]. A Prolifera gene (PRL) was also found to be upregulated. PRL also belongs to the MCM family and encodes an essential component of the DNA replication apparatus operating during the S-phase of the cell cycle. This gene is known to be strongly expressed during plant development. Springer et al. [51] reported this gene to be particularly strongly expressed in dividing cells during embryo development. They subsequently [52] showed that the PRL gene was also expressed in the cells responsible for initiating flower primordia. Finally, a CDC45 gene from this category was also identified. Several authors have suggested that the product of the CDC45 gene may function with the MCM complex, because several genetic and biochemical interactions between these components have been reported (reviewed by Steven et al. [53]). Other authors (e.g. Zou et al. [54]) have demonstrated particular interactions between this gene and the MCM2 gene (also identified in our study, T12C22.19) in DNA elongation during the cell cycle. These findings are consistent with a strong reinitiation of mitotic activity in the meristematic cells of the swelling bud, enabling the bud to burst when environmental conditions become favorable.
Regulation of the cell cycle and cell division
This functional category was defined by merging two highly similar ontologies (the cell cycle and regulation of the cell cycle ontologies). It included 13 genes, but the redundancy rate was high because most of the cyclin (CYCB: cyclin-dependent protein kinase and CYCD: cyclin D-type protein) genes were present in both ontologies (Table 4). As for the previous ontology, no gene was found to be specifically and preferentially upregulated in buds. CYCD genes are known to be upregulated during the breaking of dormancy and their products act during the transition from G1- to S-phase in the cell cycle. In plants, cells in G1-phase expand and prepare for DNA replication, which occurs during S-phase, just before mitosis (G2-phase). The transition from G1- to S-phase is well understood in plants and several CYCD proteins have been identified in Arabidopsis thaliana (reviewed by Horvath et al. [55]). The CYCD proteins are also known to respond to various stimuli, including brassinosteroids and gibberelic acid (see the next section) or sugar (see the last section). In non-dormant cells, the product of the CYCD gene interacts with the cyclin-dependent protein kinase (CDCB genes also belong to this functional category) to form a complex. The formation of the CYCD/CYCB complex induces phosphorylation the retinoblastoma protein. This phosphorylation step triggers the release of transcription factor-like EF2, which induces the expression of a battery of genes essential for DNA biosynthesis, leading to transition from the S- to the G1-phase in the cell undergoing mitosis. The genes from this functional category identified in this study suggest that the genes involved in cell division are reactivated in swelling buds, to produce new cells and to prepare the bud for budburst.
Response to auxin, gibberellin and brassinosteroid stimuli
This category was obtained by merging three different ontologies (responses to gibberellin, auxin stimulus and brassinosteroid stimuli) (Table 4). Fifteen genes involved in hormone responses were identified in the GO terms enrichment analysis. Hormones are an essential component of dormancy regulation in perennial species. For example, Anderson et al. [56] reported involvement of an interaction between ABA and gibberellin in the loss of apical dominance. Gibberellins are also known to regulate several developmental processes, such as stem elongation, seed germination and dormancy. Five genes from the response to gibberellin stimulus ontology were found, including i) a GASA4-encoding protein. GASA genes are gibberellin-responsive genes involved in several developmental processes in plants. GASA4 is expressed mostly in meristematic regions, consistent with a possible role in cell division [57]. Similar results were obtained for leafy spurge, in which the GASA4 gene was found to be overexpressed in tissues undergoing active cellular division [58], and ii) a MYB26 gene. The precise role of this transcription factor in the regulation of dormancy regulation has not been determined, but several authors (e.g. Skirycz et al. [59]) have reported an essential role for this gene in anther development and the regulation of its expression by both auxin and gibberellin.
Seven genes involved in the response to auxin stimulation were identified, including i) an OBP1 gene highly similar to the gene encoding the DOF1 protein. In Arabidopsis thaliana, Skirycz et al. [59] reported the involvement of the DOF1 protein in the control of cell division and showed that the overexpression of the gene encoding this protein led to the upregulation of many cell-cycle genes. Using SSH hybridization technology, Derory et al. [60] also showed that some DOF genes were upregulated in sessile oak during bud burst, and ii) an AUX1 gene. In Arabidopsis thaliana, AUX1 belongs to a multigene family involved in regulating various auxin-dependent developmental processes, such as root gravitropic responses (reviewed by Péret et al. [61]). Other authors have reported upregulation of the Aux1 gene during seed germination, in a mechanism comparable to dormancy release [62]. These findings suggest that plant hormones involved in swelling buds are essential for the regulation of cell division in meristematic cells.
Finally, three genes were identified in the response to brassinosteroid stimulus category. Again, none was specific to or preferentially expressed in the bud. These genes included: i) the BAS1 gene encoding a member of the cytochrome p450 family. Arabidopsis plants in which the BAS1 gene is downregulated have a shorter hypocotyl, due to a phytochrome B defect. Neff et al. [63] showed that these mutants were also hypersensitive to brassinosteroids in a light-dependent manner, suggesting that the BAS1 gene played an important role in connecting the photoreceptor and the brassinosteroid signaling pathway. Photoreceptors are essential for dormancy regulation. Indeed, several authors have shown that phytochrome and the Constans genes are essential components of the short-day signaling pathway during growth cessation (reviewed by Karlberg et al. [64]), and ii) a T5I8.2 gene, similar to the Hercule2 gene from Arabidopsis thaliana. Hercule genes encode receptor protein kinases from one of the largest known multigene families, with up to 600 members identified to date. Hercule genes are also known to be regulated by brassinosteroids. Riou-Khamlichi et al. [65] reported a possible role for some Hercule genes in regulating a battery of genes involved in plant growth and showed that Hercule genes were required for cell elongation during vegetative growth.
Response to sucrose stimulation
Three genes were identified in this category (Table 4). Sucrose appears to be a central molecular actor in the reinitiation of mitotic activity, as it is an essential component in the activities of the cell. Indeed, in perennial species, sucrose is the main source of carbon. Several authors have suggested that sucrose is a key factor involved in cell division and that there must be a specific mechanism for sensing cellular sugar levels in plants, to control the cell cycle [65]. It is well known that, during paradormancy, sugars are essential for expression of the CYCD genes (described above but also belonging to this category), which are involved in cell division (reviewed by Anderson et al. [56]). Among the genes from this category identified here was a GBF6 gene very similar to a basic leucine zipper 11 (bZip11) gene. Hanson et al. [66] reported that the translation of the basic leucine zipper 11 gene transcript was strongly regulated by cellular sucrose concentration. Moreover, two key genes encoding enzymes involved in nitrogen metabolism (asparagine synthase and proline dehydrogenase) have been shown to be strongly regulated by the Bzip11 transcription factor. Comparisons of ripened and dormant wheat seeds have shown an activation of nitrogen metabolism in the ripened seeds, suggesting a possible role of nitrogen metabolism in the recommencement of cell activity in pedunculate oak [67]. A GASA6 gene was also identified. Gonzali et al. (2006) reported a downregulation of the Arabidopsis thaliana GASA6 gene after sugar application [68]. However, there is currently no functional annotation for the GASA6 gene, making it difficult to speculate on the function of the product of this gene in dormancy regulation.
Conclusion
Oaks are cornerstone species with a fundamental role in temperate forest ecosystems. We therefore carried out a large-scale transcriptome analysis on two sympatric European white oaks. The resulting reference transcript catalog (OCV3), established with various actively growing tissues/organs, provides the most comprehensive survey of gene expression for the Quercus genus published to date. The information provided by this study already has proven useful, for the development of molecular markers for high-density linkage map construction and for studies of the degree and structure of genetic diversity in different oak species [33]. The regulation of some transcripts was found to be “tissue-specific”. These transcripts may therefore be considered good candidates for genes with specific functions in these tissues. In particular, the gene expression networks identified during vegetative bud release are of key importance as far as the seasonal growth of oaks is concerned, and are a valuable target for investigation in terms of the environmental changes resulting from global warming. A comparative analysis with Prunus persica, a phylogenetically related species, led to the detection and location of sequences orthologous to oak transcripts on peach chromosomes, providing relevant anchor points for further comparative genomics and genetic analyses of these two genera. Finally, this atlas will serve as a useful resource for annotating the reference genome sequence [30] and will provide support for forward genetics and population genomics approaches aiming to identify genes of importance for forest tree adaptation.
Methods
Plant material, library construction and sequencing
For establishment of the most comprehensive catalog of expressed genes in oak, we assembled cDNA sequences from five datasets (set #1-5 in Additional file 1 and Figure 1) into contigs:
Set #1 was obtained from Ueno et al. [8] and consisted of 26 and 14 cDNA libraries from tissue panels for Q. robur and Q. petraea, sequenced by the Sanger and 454 methods, respectively,
Set #2 consisted of: i) 16 normalized and 454 sequenced libraries from leaves pooled from various developmental stages, and roots (set #2A), with controls and treatments including the gypsy moth Lymantria dispar, powdery mildew Erysiphe alphitoides, oomycete root pathogen Phytophthora quercina, root nematode Pratylenchus penetrans, symbiotic fungus Piloderma croceum, mycorrhizal helper bacteria, Streptomyces sp. AcH 505 and the springtail Protaphorura armata, and ii) non-normalized and Illumina paired-end sequenced cDNA pools, four from roots and one from leaves (set #2B) of Q. robur clone DF159 [22],
Sets #3, #4 and #5 consisted of newly sequenced Sanger, Roche 454 and Illumina reads as follows.
Targeted sequencing of putative “full-length” cDNA clones
Set #3 consisted of reads enriched in full-length (FL) cDNAs. Only trimmed Sanger ESTs from Ueno et al. [8] were included in this third set. For EST clones containing reads in both directions (5’ and 3’), overlapping contigs were assembled with CAP3 [69]. When the 5’ and 3’ ends of the same EST clone were sequenced and no overlap occurred, pseudocontigs were constructed by filling in the missing region of the EST clone with a 20 bp stretch of Ns. Singlets were defined as ESTs with only one read from a single EST clone. Overall, 100,228 sequences (85,817 singlets, 11,179 contigs and 3,232 pseudocontigs) were aligned against the Arabidopsis thaliana (At) protein sequences available from uniprotKB (http://www.uniprot.org/taxonomy/3702), with Blastx (e-value cutoff 1e−10). The high-scoring segment pair (HSP) of the top Blast hit was identified as the FL cDNA candidate when the alignment with an HSP started at the first methionine of the At protein. This analysis resulted in the detection of 6,910 FL cDNA candidates, 6,571 of which satisfied the conditions for expected insert size. In a second step, an equimolar pool of the 6,571 oak FL PCR fragments, at a final concentration of 107 copies/μl, was prepared by pooling PCR amplicons from standard PCR carried out with M13 forward and reverse primers. The mean and median fragment sizes of the PCR products (as estimated on agarose gel) were 1,382 bp and 1,212 bp, respectively. DNA concentrations initially ranged from 80 to 150 ng/μl and were adjusted to 80 ng/μl, and aliquots of 3 μl of each probe were pooled in the same vial, with a Tecan Genesis RSP 200 liquid handling workstation (Tecan, Triangle Park, NC, USA), resulting in a total volume of 19.7 ml. This pool was split into 1 ml aliquots and DNA was precipitated by adding 3 M sodium acetate, pH 5.2 and 0.7 volumes of isopropanol. The DNA was collected by centrifugation, the pellet was dried and resuspended in 50 μl MilliQ water and the DNA was cleaned with a QIAquick PCR purification kit (Qiagen, Valencia, USA, CA). DNA concentration was measured with a Nanodrop 2000 spectrophotometer (Nanodrop Technologies, Wilmington, DE, USA). Finally, 75 bp paired-end sequencing was performed with a Genome Analyzer II x-sequencer (Illumina, San Diego, CA, USA), according to the manufacturer’s specifications.
Extension of the EST catalog with tissues challenged with abiotic and biotic stresses
Set #4 aimed to expand the diversity of expressed genes by sampling tissues subjected to abiotic and biotic challenges that had not been considered in previous studies. Two Q. petraea cDNA libraries were constructed from the pooled leaves or roots of six-month-old seedlings exposed to five abiotic stressors (10°C for 3 days, 35°C for 4 days, 700 ppm CO2, water stress, and hypoxia for 48 h). Six Q. robur libraries were established as described in Additional file 1, from a pool of control and treated seedlings subjected to biotic stressors, such as insect herbivory (gypsy moth Lymantria dispar), a fungal pathogen (powdery mildew Erysiphe alphitoides) and an oomycete pathogen (Phytophthora cinnamomi).
High-throughput sequencing from a tissue panel
We used the Illumina Hiseq2000 platform to sample genes with low levels of expression. Six tissues were studied: vegetative buds at two developmental stages (ecodormancy and swelling bud before bud break), differentiating secondary xylem, root, leaf, and dedifferentiated in vitro callus tissues (referred to as set #5). Total RNA was extracted as previously described [70]. We isolated mRNA by selection for the polyA tail. It was then chemically fragmented and converted into single-stranded cDNA by random hexamer priming. The second strand was then generated to create double-stranded cDNAs. Paired-end libraries were prepared according to the Illumina protocol (TruSeq Illumina DNA sample prep kit, Illumina, San Diego, CA, USA). Briefly, fragments were end-repaired, 3’-adenylated, and ligated to Illumina adapters. DNA fragments (with adapters) of 300–600 bp were amplified by PCR with Illumina adapter-specific primers. Libraries were quantified with a Qubit Fluorometer (Invitrogen, Milan, Italy). Library profiles were evaluated with an Agilent 2100 bioanalyzer (Agilent Technologies, Inc., Santa Clara, CA, USA). Each library was sequenced by 101 base-read length chemistry, in a paired-end flow cell, on the Illumina HiSeq2000 (Illumina, San Diego, CA, USA). Three libraries per lane were pooled to obtain about 130 million sequences per tissue type.
Sequence processing
Sequences from the putative “full-length” cDNA-enriched library (set #3)
After base-calling with Phred [71], we eliminated vector and adapter sequences with cross_match (http://www.phrap.org/phredphrap/general.html), with the following parameters: −minmatch 10 -minscore 15. The vector database contained five vector sequences: pBluescriptSK (−) (X52324.1), a phagemid excised from lambda ZAP, pCR4-TOPO (Invitrogen, Carlsbad, CA, USA), pDNR-LIB, PDONR222.T, pGM-T_Easy. Low-complexity regions (mononucleotide repeats, PolyA) were then masked with RepeatMasker [72]. Using cross_match (−minmatch 10 -minscore 25), we then eliminated contaminants by comparison with several sequence databases, including Univec, and databases for the budding yeast and E. coli genomes. Valid sequences, with a PHRED-score of more than 20 over at least 100 bp lengths (to exclude potentially uninformative sequences) were retained for further analysis.
Sanger and 454 sequences (sets #1, #2A and #4)
All available Sanger ESTs were retrieved from the SURF database (http://genotoul-contigbrowser.toulouse.inra.fr:9092/Quercus_robur) and trimmed with Seqtrim 0.110 [73] to remove the library-specific cloning vector, to mask low-complexity sequences and to eliminate contaminants, mitochondrial sequences and poor-quality sequences. All 454 Roche sequences from this and previous [8,9] studies were cleaned up with SeqtrimNext 2.0.59 (http://www.scbi.uma.es/ingebiol/session/new/seqtrimnext).
Illumina sequences (sets #2B and #5)
Illumina paired-end reads were cleaned in a three-step procedure: i) sequencing adapters and low-quality nucleotides (quality value < 20) were removed, ii) sequences between the second unknown nucleotide (N) and the end of the read were removed, iii) reads shorter than 30 nucleotides after trimming were discarded, together with reads and their mates mapping onto run quality control sequences (PhiX genome).
De novo transcript assembly
A schematic diagram of data processing for this study is shown in Figure 1. Short reads and long reads were subjected to different bioinformatic treatments, as described below.
Assembly of Illumina reads from putative full-length cDNAs (set #3)
A total of 17,196,106 Illumina paired-end reads bearing no similarity to vector sequences were assembled with Velvet V1.1.03 [74] and kmers 37, 41, 45, 49, 53, 57 and 61. A meta-assembly of the resulting contigs of more than 100 bp in length was then generated with TGICL V2.1 [75]. In total, 4,359 contigs were generated from the 6,571 cDNA clones initially amplified, and these contigs were subsequently cleaned up, with the removal of the remaining vector sequences with crossmatch (−minmatch 10 -minscore 15).
Pre-assembly of long reads (sets #1, #2A and #4)
We used MIRA V3.4.0 [76,77] to assemble 75,957 Sanger sequences, 2,790,004 Roche 454 reads and the de novo Illumina pre-assembly of 4,359 contigs. Contigs of less than 100 bp in length were filtered out. The CD-hit-EST V4.5.4 clustering algorithm [78,79] was used to reduce redundancy within this long-read pre-assembly (sequence identity threshold 0.95; word length 8). BLAT V34 was then used to validate this assembly, by mapping the initial Sanger and Roche-454 reads onto the long-read contigs. The minimum identity threshold was set to 98%.
Pre-assembly of short reads (sets #2B and #5)
The de novo assembly of the whole dataset was time-consuming due to memory issues, so we used Diginorm (Digital normalization with khmer, [80]) to normalize the raw data digitally. This process greatly decreases the size of shotgun data sets and the memory and time requirements for de novo sequence assembly, with no significant impact on the contigs generated. Diginorm was used to eliminate redundant reads. The coverage of each read was estimated (kmer-based approach) and reads with a coverage of less than 20 x were retained. Reads were assembled with Velvet V1.2.07 and Oases V0.2.8, using kmer 51. Potential fungal sequence contamination was identified by aligning the contigs with the sequences in the NCBI GenBank non-redundant protein sequence database (release 21/11/2012) with Blastx V2.2.15 (e-value cutoff 1e−04). Redundancy was reduced with CD-hit-EST (sequence identify threshold 0.95; word length 8).
Short- and long-read meta-assembly
The contigs from the long- and short-read pre-assemblies were assembled with MIRA V3.4.0, resulting in a final assembly named oak contigs v3 (OCV3) to distinguish it from two previous assemblies (OCV1 from [8], OCV2 from [22]). Redundancy among contigs was decreased with CD-hit-EST (sequence identity threshold 0.95; word length 8). We then filtered out contigs of less than 100 bp in length. We estimated chloroplast and mitochondrial contamination by BLAST searches with blastall V2.2.26 (e-value cutoff 1e−5) against the chloroplast genome of oak and a set of 162 contigs considered to correspond to the mitochondrial genome (both kindly provided by GG Vendramin, Institute of Biosciences and Bioresources, CNR, Sesto Fiorentino, Florence, Italy).
Functional annotation and categorization of the oak proteome by comparative genomics
We compared the 192,097 oak contigs (referred to as OCV3-192 k) with six protein datasets, including Swissprot (release 02–2013) [81] and five plant proteomes: Prunus persica V1.0 (27,864 proteins, [82]), Populus trichocarpa V2.0 (40,668 proteins, [83]), Vitis vinifera V1.0 (26,346 proteins, [84]), Eucalyptus grandis V1.1 (36,376 proteins, [85]), Arabidopsis thaliana V9.0 (27,416 proteins, [86]). We used the BlastX program implemented in the blast + tool [87]. For each database, alignments with a score greater than 300 (BLOSUM62, gapo = 10, gape = 1, e-value = 1e10−5) were retained and the best alignment was used to identify the probable open reading frame to be considered for subsequent analysis. On the basis of these criteria, 90,786 oak transcripts (OCV3-91 k) were retained.
We established a first set of Gene Ontology (GO) terms [88] based on the best hit with Swissprot and the At proteome. We retrieved the GO terms associated with Swissprot and TAIR best hits from the Gene Ontology Annotation (GOA) project [89]. A second set of GO terms was associated with OCV3-91 K contigs by comparison of the 90,786 sequences with the Pfam V27.0 protein family database, using InterProScan V4.8 [90,91]. The GO terms were mapped onto plant GOslim terms with Blast2GO software [92]. The ontology level was set to 2. Due to the computational limitations of Blast2GO software, we retained only GO terms associated with at least 100 contigs.
Identification of orthologous gene pairs between Quercus and malvids/fabids: inference of the timing of speciation
OCV3-91 k was aligned (BlastX, best match, e-value = 1e−10) with gene models for Prunus persica, Populus trichocarpa, Vitis vinifera, Eucalyptus grandis and Arabidopsis thaliana. The calculation of Ks values (rate of synonymous substitution) between these contigs and gene models required sequences without stop codons and degenerate bases. We therefore translated the oak contigs into their six open reading frames and those without stop codons and degenerate bases were retained. The ClustalW [93] and PAML [94] packages were then used to calculate Ks.
Detection of genes differentially expressed in different tissues and at different stages of vegetative bud dormancy release, enrichment analysis
The BWA V 0.6.1 aligner was used to map Illumina paired-end reads onto the OCV3 assembly. If one or both paired reads mapped to the same contig, the result was recorded as a hit. When two reads from the same pair mapped to different contigs, they were not considered to constitute a hit. For the identification of contigs differentially expressed between the six Illumina libraries (ecodB: ecodormant buds, swB: swelling buds, XY: differentiating secondary xylem, RO: roots, LE: leaves, CA: in vitro dedifferentiated callus of Q. robur DF159 clone [95]), we assumed that the number of reads mapping onto a contig was proportional to the level of expression of the corresponding gene.
We first clustered the six tissues on the basis of their transcriptomic distances, by Ward’s linkage method [96]. The two pairwise distance metrics used (Pearson’s correlation coefficient and Euclidean distance) gave essentially identical results, so the results for only one of these methods are presented in the results section. Hierarchical clustering was performed with the R package pvclust [97] and the robustness of the clusters was assessed by multiscale bootstrap resampling (10,000) to obtain unbiased p-values. We used Log2(n + 1) normalized RPKM data (reads per kilobase of exon model per million mapped reads) to take contigs with no mapped read into account.
We applied different statistical tests to raw count, to detect differentially expressed genes: i) R statistics [98], ii) DESeq [99] and iii) EdgeR [100]. The last two of these methods were performed with the Bioconductor package. In R statistics, each contig was associated with an R value and was considered to be significantly differentially expressed with a type-I error risk of 2% if R ≥ 8. As there were no replicated libraries from which to estimate biological variability, we set the dispersion to 0.6 in the EdgeR package and used the exact test method. We applied a false discovery rate (FDR) of 0.05 with both these software suites. Contigs identified as significantly differentially expressed with at least two of the three methods were retained for further biological interpretation. Given the high rate of validation (based on RT-qPCR) of the in silico expression data obtained in a previous study based on the RNA-seq approach with stringent statistical criteria [32], we considered the data generated in this study to be accurate for the prediction of gene expression in vitro.
We then carried out an enrichment analysis for pathways and groups (EAPG) for selected genes differentially expressed between the ecodB and swB libraries, corresponding to two different phenological phases of vegetative bud release, with Pathway Studio 9 Desktop edition Software and the Resnet Plant Version 4 database (www.elsevier.com/online-tools/pathway-studio/plant-database). EAPG executes a Fisher’s exact test on each pathway or group and returns information relating to overlapping entities, together with the p-value of the statistical test. EAPG was executed against Gene Ontology and AraCyc plant metabolic pathway [101,102] data. The “Find subnetworks enriched with selected entities” function (FSNE) was also used to identify the set of entities (subnetworks) organized by specific relationships, with Fisher’s exact test.
WEB portal
Quercus portal: https://w3.pierroton.inra.fr/QuercusPortal/.
Acknowledgments
We thank J. Descat for assistance with the herbivory treatment and I. Van Halder for providing the caterpillars, ML Desprez-Loustau, C Robin and T Decourcelle for carrying out the interaction experiment with gypsy moth, powdery mildew and Phytophtora, C. Hubert for sequencing the putative full-length cDNA clones at the Genome & Transcriptome Facility of Bordeaux. This work was supported by the ANR GENOAK project (2011 BSV6 009 01, “Sequencing of the oak genome and identification of genes that matter for forest tree adaptation”) and the European Commission under the FP6 program (FP6-2004-GLOBAL-3, Network of Excellence EVOLTREE “Evolution of Trees as drivers of Terrestrial Biodiversity”, N°016322).
The Data provided by FB, MT, HS and LF were generated in the TrophinOak Project (http://www.ufz.de/trophinoak/) granted by the German Science Foundation (DFG, Grants BU 941/20-1 & TA 290/4-1).
Additional files
Oak ( Quercus petraea and Q. robur ) cDNA libraries used for Sanger, 454 Roche and Illumina sequencing.
Detailed procedure of short-reads, long-reads and meta-assemblies.
Distribution of trimmed cDNA length (Sanger (blue) and Roche 454 (orange) sequences) used in the long-read assembly. y-axis: number of ESTs within different categories of trimmed sequence length. x-axis: ranges of trimmed sequence lengths (101–200, 201–300, 301–400 bp, etc.).
Cumulative contig size for the short- (red), long- (black) and meta- (green) assemblies. y-axis: Number of contigs (%). x-axis: contig sizes on a log10 scale.
List of GO terms associated with OCV3-91 k contigs.
Number of OCV3 contigs associated with the main GO terms (BP: Biological Process, CC Cellular Component, MF Molecular Function) and distribution of GO terms at the second level of the Gene Ontology.
Comparison of GO term rankings between this study and three other unigene sets, for Castanea dentata, Eucalyptus grandis, Pseudotsuga menziesii.
List of 9,549 oak contigs with single robust orthologs in the Prunus persica gene model.
Information gained by sequencing several tissues. Abbreviation: RO: root, ecodB: ecodormant bud, LE: leaf, CA: in vitro dedifferentiated callus, swB: swelling bud, XY: secondary differentiation xylem. In the OCV3-91 k subset, 2,275 contigs (2.5%) contained no reads from the tissue panel.
Number of paired-reads, reads mapping to OCV3-91 k, mapped contigs and “tissue-specific” contigs. Abbreviation: ecodB: ecodormant bud, swB: swelling bud, XY: secondary differentiation xylem, RO: root, LE: leaf and CA: in vitro dedifferentiated callus.
List of “tissue-specific” contigs in the OCV3-91 k subset.
Normalized read counts for OCV3-91 K and OCV3-101 K as a result of the mapping of the 6 illumina libraries (RO, ecoDB, LE, CA, swB and XY).
Dendrogram of the distances between six tissues (ecodB: ecodormant bud, swB: swelling bud, XY: differentiating secondary xylem, RO: root, LE: leaf and CA: in vitro dedifferentiated callus), constructed by Ward’s linkage method with Euclidean distance as the dissimilarity metric. The axis next to the tree indicates the mean distance (inverse of similarity) between members of the two branches joined at each node. The robustness of the clusters was assessed by multiscale bootstrap resampling (10,000) to obtain unbiased p-values. In red: AU p-values (approximately unbiased, Multiscale bootstrap resampling), in green: BP values (bootstrap probability).
List and annotation of 23 OCV3 contigs differentially expressed, as shown by three statistical methods (R statistics, EdgeR and DESeq), between ecodB (ecodormancy) and swB (swelling bud) libraries.
List and annotation of 862 differentially expressed OCV3 contigs (663 contigs from OCV3-91 k and 199 contigs from OCV3-101 k) identified by at least two statistical methods (R statistics, EdgeR, and DESeq).
Result of the enrichment analysis for pathways and groups.
Footnotes
Competing interests
The authors declare that they have no competing interests.
Authors’ contributions
IL, PB, CS, JMA: performed the bioinformatic analyses, GL and JCL: performed the EAPG analysis, CL, VL, CBe: extracted RNA, prepared the cDNA libraries and sequenced the libraries, FE, AK: developed the Quercus portal database, HQ, JA: provided expertise for transcriptome analysis throughout the project, LF, MT, SH, FB: provided sequence data and compared different versions of the unigene set, MS, SF, SU, CN, CK: produced and analyzed the full-length cDNA sequences, CBu, SU: designed the experiment involving seedlings subjected to biotic challenges and analyzed the corresponding data, FM and JS: developed the comparative genomics approach, JB: performed the clustering of the different datasets, IL, GL, CP: wrote the manuscript, CP, AK: conceived, designed and coordinated the project. All authors read and approved the final manuscript.
Contributor Information
Isabelle Lesur, Email: ilesur@pierroton.inra.fr.
Grégoire Le Provost, Email: gregoire@pierroton.inra.fr.
Pascal Bento, Email: pascal.bento@versailles.inra.fr.
Corinne Da Silva, Email: dasilva@genoscope.cns.fr.
Jean-Charles Leplé, Email: Jean-Charles.leple@orleans.inra.fr.
Florent Murat, Email: florent.murat@clermont.inra.fr.
Saneyoshi Ueno, Email: saueno@ffpri.affrc.go.jp.
Jerôme Bartholomé, Email: bartholo@pierroton.inra.fr.
Céline Lalanne, Email: lalanne@pierroton.inra.fr.
François Ehrenmann, Email: fehrenma@pierroton.inra.fr.
Céline Noirot, Email: Celine.Noirot@toulouse.inra.fr.
Christian Burban, Email: Christian.Burban@pierroton.inra.fr.
Valérie Léger, Email: valerie.leger@pierroton.inra.fr.
Joelle Amselem, Email: joelle.amselem@versailles.inra.fr.
Caroline Belser, Email: cbelser@genoscope.cns.fr.
Hadi Quesneville, Email: hadi.quesneville@versailles.inra.fr.
Michael Stierschneider, Email: Michael.Stierschneider@ait.ac.at.
Silvia Fluch, Email: Silvia.Fluch@ait.ac.at.
Lasse Feldhahn, Email: lasse.feldhahn@ufz.de.
Mika Tarkka, Email: mika.tarkka@ufz.de.
Sylvie Herrmann, Email: sylvie.herrmann@ufz.de.
François Buscot, Email: francois.buscot@ufz.de.
Christophe Klopp, Email: Christophe.Klopp@toulouse.inra.fr.
Antoine Kremer, Email: antoine.kremer@pierroton.inra.fr.
Jérôme Salse, Email: Jerome.SALSE@clermont.inra.fr.
Jean-Marc Aury, Email: jmaury@genoscope.cns.fr.
Christophe Plomion, Email: plomion@pierroton.inra.fr.
References
- 1.Timbal J, Aussenac G. An overview of ecology and silviculture of indigenous oaks in France. Ann Sci For. 1996;53:649–61. doi: 10.1051/forest:19960243. [DOI] [Google Scholar]
- 2.Kremer A, Sederoff R, Wheeler NC. Genomics of forest and ecosystem health in the Fagaceae. Trees Genet Genomes. 2010;6:815–20. doi: 10.1007/s11295-010-0277-y. [DOI] [Google Scholar]
- 3.Goicoechea PG, Petit RJ, Kremer A. Detecting the footprints of divergent selection in oaks with linked markers. Heredity. 2012;109:361–71. doi: 10.1038/hdy.2012.51. [DOI] [PMC free article] [PubMed] [Google Scholar]
- 4.Kremer A, Abbott AG, Carlson JE, Manos PS, Plomion C, Sisco P, et al. Genomics of Fagaceae. Tree Genet Genomes. 2012;8:583–610. doi: 10.1007/s11295-012-0498-3. [DOI] [Google Scholar]
- 5.Faivre Rampant P, Lesur I, Boussardon C, Bitton F, Martin-Magniette M-L, Bodénès C, et al. Analysis of BAC end sequences in oak, a keystone forest tree species, providing insight into the composition of its genome. BMC Genomics. 2011;12:292. doi: 10.1186/1471-2164-12-292. [DOI] [PMC free article] [PubMed] [Google Scholar]
- 6.Durand J, Bodénès C, Chancerel E, Frigerio J-M, Vendramin G, Sebastiani F, et al. A fast and cost-effective approach to develop and map EST-SSR markers: oak as a case study. BMC Genomics. 2010;11:570. doi: 10.1186/1471-2164-11-570. [DOI] [PMC free article] [PubMed] [Google Scholar]
- 7.Bodénès C, Chancerel E, Gailing O, Vendramin GG, Bagnoli F, Durand J, et al. Comparative mapping in the Fagaceae and beyond with EST-SSRs. BMC Plant Biol. 2012;12:153. doi: 10.1186/1471-2229-12-153. [DOI] [PMC free article] [PubMed] [Google Scholar]
- 8.Ueno S, Le Provost G, Léger V, Klopp C, Noirot C, Frigerio J-M, et al. Bioinformatic analysis of ESTs collected by Sanger and pyrosequencing methods for a keystone forest tree species: oak. BMC Genomics. 2010;11:650. doi: 10.1186/1471-2164-11-650. [DOI] [PMC free article] [PubMed] [Google Scholar]
- 9.Kersten B, Ghirardo A, Schnitzler J-P, Kanawati B, Schmitt-Kopplin P, Fladung M, et al. Integrated transcriptomics and metabolomics decipher differences in the resistance of pedunculate oak to the herbivore Tortrix viridana L. BMC Genomics. 2013;14:737. doi: 10.1186/1471-2164-14-737. [DOI] [PMC free article] [PubMed] [Google Scholar]
- 10.Van Verk MC, Hickman R, Pieterse CMJ, Van Wees SCM. RNA-Seq: revelation of the messengers. Trends Plant Sci. 2013;18:175–9. doi: 10.1016/j.tplants.2013.02.001. [DOI] [PubMed] [Google Scholar]
- 11.Zenoni S, Ferrarini A, Giacomelli E, Xumerle L, Fasoli M, Malerba G, et al. Characterization of transcriptional complexity during berry development in Vitis vinifera using RNA-Seq. Plant Physiol. 2010;152:1787–95. doi: 10.1104/pp.109.149716. [DOI] [PMC free article] [PubMed] [Google Scholar]
- 12.Kakumanu A, Ambavaram MMR, Klumas C, Krishnan A, Batlang U, Myers E, et al. Effects of drought on gene expression in maize reproductive and leaf meristem tissue revealed by RNA-Seq. Plant Physiol. 2012;160:846–67. doi: 10.1104/pp.112.200444. [DOI] [PMC free article] [PubMed] [Google Scholar]
- 13.Young ND, Jex AR, Li B, Liu S, Yang L, Xiong Z, et al. Whole-genome sequence of Schistosoma haematobium. Nat Genet. 2012;44:221–5. doi: 10.1038/ng.1065. [DOI] [PubMed] [Google Scholar]
- 14.Yuryev A, Mulyukov Z, Kotelnikova E, Maslov S, Egorov S, Nikitin A, et al. Automatic pathway building in biological association networks. BMC Bioinformatics. 2006;7:171. doi: 10.1186/1471-2105-7-171. [DOI] [PMC free article] [PubMed] [Google Scholar]
- 15.Vignes M, Vandel J, Allouche D, Ramadan-Alban N, Cierco-Ayrolles C, Schiex T, et al. Gene regulatory network reconstruction using Bayesian networks, the Dantzig Selector, the Lasso and their meta-analysis. PLoS One. 2011;6:e29165. doi: 10.1371/journal.pone.0029165. [DOI] [PMC free article] [PubMed] [Google Scholar]
- 16.Stocker TF, Dahe Q, Plattner G-K. Climate change 2013: the physical science basis. Cambridge, United Kingdom and New York, NY, USA: Cambridge University Press; 2013. [Google Scholar]
- 17.Pont C, Murat F, Confolent C, Balzergue S, Salse J. RNA-seq in grain unveils fate of neo- and paleopolyploidization events in bread wheat (Triticum aestivum L.) Genome Biol. 2011;12:R119. doi: 10.1186/gb-2011-12-12-r119. [DOI] [PMC free article] [PubMed] [Google Scholar]
- 18.Cloonan N, Forrest ARR, Kolle G, Gardiner BBA, Faulkner GJ, Brown MK, et al. Stem cell transcriptome profiling via massive-scale mRNA sequencing. Nat Methods. 2008;5:613–9. doi: 10.1038/nmeth.1223. [DOI] [PubMed] [Google Scholar]
- 19.Salse J. In silico archeogenomics unveils modern plant genome organisation, regulation and evolution. Curr Opin Plant Biol. 2012;15:122–30. doi: 10.1016/j.pbi.2012.01.001. [DOI] [PubMed] [Google Scholar]
- 20.Martin JA, Wang Z. Next-generation transcriptome assembly. Nat Rev Genet. 2011;12:671–82. doi: 10.1038/nrg3068. [DOI] [PubMed] [Google Scholar]
- 21.Cahais V, Gayral P, Tsagkogeorga G, Melo-Ferreira J, Ballenghien M, Weinert L, et al. Reference-free transcriptome assembly in non-model animals from next-generation sequencing data. Mol Ecol Resour. 2012;12:834–45. doi: 10.1111/j.1755-0998.2012.03148.x. [DOI] [PubMed] [Google Scholar]
- 22.Tarkka MT, Herrmann S, Wubet T, Feldhahn L, Recht S, Kurth F, et al. OakContigDF159.1, a reference library for studying differential gene expression in Quercus robur during controlled biotic interactions: use for quantitative transcriptomic profiling of oak roots in ectomycorrhizal symbiosis. New Phytol. 2013;199:529–40. doi: 10.1111/nph.12317. [DOI] [PubMed] [Google Scholar]
- 23.Quang ND, Ikeda S, Harada K. Nucleotide variation in Quercus crispula Blume. Heredity. 2008;101:166–74. doi: 10.1038/hdy.2008.42. [DOI] [PubMed] [Google Scholar]
- 24.Müller T, Ensminger I, Schmid KJ. A catalogue of putative unique transcripts from Douglas-fir (Pseudotsuga menziesii) based on 454 transcriptome sequencing of genetically diverse, drought-stressed seedlings. BMC Genomics. 2012;13:673. doi: 10.1186/1471-2164-13-673. [DOI] [PMC free article] [PubMed] [Google Scholar]
- 25.Canales J, Bautista R, Label P, Gómez-Maldonado J, Lesur I, Fernández-Pozo N, et al. De novo assembly of maritime pine transcriptome: implications for forest breeding and biotechnology. Plant Biotechnol J. 2014;12:286–99. doi: 10.1111/pbi.12136. [DOI] [PubMed] [Google Scholar]
- 26.Barakat A, DiLoreto DS, Zhang Y, Smith C, Baier K, Powell WA, et al. Comparison of the transcriptomes of American chestnut (Castanea dentata) and Chinese chestnut (Castanea mollissima) in response to the chestnut blight infection. BMC Plant Biol. 2009;9:51. doi: 10.1186/1471-2229-9-51. [DOI] [PMC free article] [PubMed] [Google Scholar]
- 27.Parchman TL, Geist KS, Grahnen JA, Benkman CW, Buerkle CA. Transcriptome sequencing in an ecologically important tree species: assembly, annotation, and marker discovery. BMC Genomics. 2010;11:180. doi: 10.1186/1471-2164-11-180. [DOI] [PMC free article] [PubMed] [Google Scholar]
- 28.Derory J, Scotti-Saintagne C, Bertocchi E, Le Dantec L, Graignic N, Jauffres A, et al. Contrasting relationships between the diversity of candidate genes and variation of bud burst in natural and segregating populations of European oaks. Heredity. 2010;104:438–48. doi: 10.1038/hdy.2009.134. [DOI] [PubMed] [Google Scholar]
- 29.Mott R. EST_GENOME: a program to align spliced DNA sequences to unspliced genomic DNA. Comput Appl Biosci CABIOS. 1997;13:477–8. doi: 10.1093/bioinformatics/13.4.477. [DOI] [PubMed] [Google Scholar]
- 30.Plomion C, Fievet V. Oak genomics takes off … and enters the ecological genomics era. New Phytol. 2013;199:308–10. doi: 10.1111/nph.12357. [DOI] [PubMed] [Google Scholar]
- 31.Green R, Martin G. A rosid is a rosid is a rosid … or not. Adv Classif Res Online. 2013;23:9–16. doi: 10.7152/acro.v23i1.14228. [DOI] [Google Scholar]
- 32.Ueno S, Klopp C, Leplé JC, Derory J, Noirot C, Léger V, et al. Transcriptional profiling of bud dormancy induction and release in oak by next-generation sequencing. BMC Genomics. 2013;14:236. doi: 10.1186/1471-2164-14-236. [DOI] [PMC free article] [PubMed] [Google Scholar]
- 33.Lepoittevin C, Chancerel E, Villate L, Bodenes C, Lang T, Lesur I, et al. Single-nucleotide polymorphism discovery and high-density SNP array development for genetic analysis in European white oaks. Mol Ecol Resour. 2015. Accepted. [DOI] [PubMed]
- 34.Degenhardt RF, Bonham-Smith PC. Transcript profiling demonstrates absence of dosage compensation in Arabidopsis following loss of a single RPL23a paralog. Planta. 2008;228:627–40. doi: 10.1007/s00425-008-0765-6. [DOI] [PubMed] [Google Scholar]
- 35.Song Y, Zhang H, Chen C, Wang G, Zhuang K, Cui J, et al. Proteomic analysis of copper-binding proteins in excess copper-stressed rice roots by immobilized metal affinity chromatography and two-dimensional electrophoresis. Biometals Int J Role Met Ions Biol Biochem Med. 2014;27:265–76. doi: 10.1007/s10534-014-9707-x. [DOI] [PubMed] [Google Scholar]
- 36.Ariz I, Asensio AC, Zamarreño AM, García-Mina JM, Aparicio-Tejo PM, Moran JF. Changes in the C/N balance caused by increasing external ammonium concentrations are driven by carbon and energy availabilities during ammonium nutrition in pea plants: the key roles of asparagine synthetase and anaplerotic enzymes. Physiol Plant. 2013;148:522–37. doi: 10.1111/j.1399-3054.2012.01712.x. [DOI] [PubMed] [Google Scholar]
- 37.Guo Y, Xiong L, Ishitani M, Zhu J-K. An Arabidopsis mutation in translation elongation factor 2 causes superinduction of CBF/DREB1 transcription factor genes but blocks the induction of their downstream targets under low temperatures. Proc Natl Acad Sci U S A. 2002;99:7786–91. doi: 10.1073/pnas.112040099. [DOI] [PMC free article] [PubMed] [Google Scholar]
- 38.Cantrel C, Vazquez T, Puyaubert J, Rezé N, Lesch M, Kaiser WM, et al. Nitric oxide participates in cold-responsive phosphosphingolipid formation and gene expression in Arabidopsis thaliana. New Phytol. 2011;189:415–27. doi: 10.1111/j.1469-8137.2010.03500.x. [DOI] [PubMed] [Google Scholar]
- 39.Da Silveira Falavigna V, Porto DD, Buffon V, Margis-Pinheiro M, Pasquali G, Revers LF. Differential transcriptional profiles of dormancy-related genes in apple buds. Plant Mol Biol Report. 2014;32:796–813. doi: 10.1007/s11105-013-0690-0. [DOI] [Google Scholar]
- 40.Ensminger I, Busch F, Huner NPA. Photostasis and cold acclimation: sensing low temperature through photosynthesis. Physiol Plant. 2006;126:28–44. doi: 10.1111/j.1399-3054.2006.00627.x. [DOI] [Google Scholar]
- 41.Goulas E, Schubert M, Kieselbach T, Kleczkowski LA, Gardeström P, Schröder W, et al. The chloroplast lumen and stromal proteomes of Arabidopsis thaliana show differential sensitivity to short- and long-term exposure to low temperature. Plant J Cell Mol Biol. 2006;47:720–34. doi: 10.1111/j.1365-313X.2006.02821.x. [DOI] [PubMed] [Google Scholar]
- 42.Ishikawa T, Watanabe N, Nagano M, Kawai-Yamada M, Lam E. Bax inhibitor-1: a highly conserved endoplasmic reticulum-resident cell death suppressor. Cell Death Differ. 2011;18:1271–8. doi: 10.1038/cdd.2011.59. [DOI] [PMC free article] [PubMed] [Google Scholar]
- 43.He L, Yang X, Wang L, Zhu L, Zhou T, Deng J, et al. Molecular cloning and functional characterization of a novel cotton CBL-interacting protein kinase gene (GhCIPK6) reveals its involvement in multiple abiotic stress tolerance in transgenic plants. Biochem Biophys Res Commun. 2013;435:209–15. doi: 10.1016/j.bbrc.2013.04.080. [DOI] [PubMed] [Google Scholar]
- 44.Doğramaci M, Horvath DP, Chao WS, Foley ME, Christoffers MJ, Anderson JV. Low temperatures impact dormancy status, flowering competence, and transcript profiles in crown buds of leafy spurge. Plant Mol Biol. 2010;73:207–26. doi: 10.1007/s11103-010-9621-8. [DOI] [PubMed] [Google Scholar]
- 45.Lee H, Suh S-S, Park E, Cho E, Ahn JH, Kim S-G, et al. The AGAMOUS-LIKE 20 MADS domain protein integrates floral inductive pathways in Arabidopsis. Genes Dev. 2000;14:2366–76. doi: 10.1101/gad.813600. [DOI] [PMC free article] [PubMed] [Google Scholar]
- 46.Trainin T, Bar-Ya’akov I, Holland D. ParSOC1, a MADS-box gene closely related to Arabidopsis AGL20/SOC1, is expressed in apricot leaves in a diurnal manner and is linked with chilling requirements for dormancy break. Tree Genet Genomes. 2013;9:753–66. doi: 10.1007/s11295-012-0590-8. [DOI] [Google Scholar]
- 47.Kang CH, Jung WY, Kang YH, Kim JY, Kim DG, Jeong JC, et al. AtBAG6, a novel calmodulin-binding protein, induces programmed cell death in yeast and plants. Cell Death Differ. 2006;13:84–95. doi: 10.1038/sj.cdd.4401712. [DOI] [PubMed] [Google Scholar]
- 48.Kobayashi M, Takato H, Fujita K, Suzuki S. HSG1, a grape Bcl-2-associated athanogene, promotes floral transition by activating CONSTANS expression in transgenic Arabidopsis plant. Mol Biol Rep. 2012;39:4367–74. doi: 10.1007/s11033-011-1224-1. [DOI] [PubMed] [Google Scholar]
- 49.Dresselhaus T, Srilunchang K-O, Leljak-Levanic D, Schreiber DN, Garg P. The fertilization-induced DNA replication factor MCM6 of maize shuttles between cytoplasm and nucleus, and is essential for plant growth and development. Plant Physiol. 2006;140:512–27. doi: 10.1104/pp.105.074294. [DOI] [PMC free article] [PubMed] [Google Scholar]
- 50.Dang HQ, Tran NQ, Gill SS, Tuteja R, Tuteja N. A single subunit MCM6 from pea promotes salinity stress tolerance without affecting yield. Plant Mol Biol. 2011;76:19–34. doi: 10.1007/s11103-011-9758-0. [DOI] [PubMed] [Google Scholar]
- 51.Springer PS, McCombie WR, Sundaresan V, Martienssen RA. Gene trap tagging of PROLIFERA, an essential MCM2-3-5-like gene in Arabidopsis. Science. 1995;268:877–80. doi: 10.1126/science.7754372. [DOI] [PubMed] [Google Scholar]
- 52.Springer PS, Holding DR, Groover A, Yordan C, Martienssen RA. The essential Mcm7 protein PROLIFERA is localized to the nucleus of dividing cells during the G(1) phase and is required maternally for early Arabidopsis development. Dev Camb Engl. 2000;127:1815–22. doi: 10.1242/dev.127.9.1815. [DOI] [PubMed] [Google Scholar]
- 53.Stevens R, Grelon M, Vezon D, Oh J, Meyer P, Perennes C, et al. A CDC45 homolog in Arabidopsis is essential for meiosis, as shown by RNA interference-induced gene silencing. Plant Cell. 2004;16:99–113. doi: 10.1105/tpc.016865. [DOI] [PMC free article] [PubMed] [Google Scholar]
- 54.Zou L, Stillman B. Assembly of a complex containing Cdc45p, replication protein A, and Mcm2p at replication origins controlled by S-phase cyclin-dependent kinases and Cdc7p-Dbf4p kinase. Mol Cell Biol. 2000;20:3086–96. doi: 10.1128/MCB.20.9.3086-3096.2000. [DOI] [PMC free article] [PubMed] [Google Scholar]
- 55.Horvath DP, Anderson JV, Chao WS, Foley ME. Knowing when to grow: signals regulating bud dormancy. Trends Plant Sci. 2003;8:534–40. doi: 10.1016/j.tplants.2003.09.013. [DOI] [PubMed] [Google Scholar]
- 56.Anderson JV, Doğramacı M, Horvath DP, Foley ME, Chao WS, Suttle JC, et al. Auxin and ABA act as central regulators of developmental networks associated with paradormancy in Canada thistle (Cirsium arvense) Funct Integr Genomics. 2012;12:515–31. doi: 10.1007/s10142-012-0280-5. [DOI] [PubMed] [Google Scholar]
- 57.Aubert D, Chevillard M, Dorne AM, Arlaud G, Herzog M. Expression patterns of GASA genes in Arabidopsis thaliana: the GASA4 gene is up-regulated by gibberellins in meristematic regions. Plant Mol Biol. 1998;36:871–83. doi: 10.1023/A:1005938624418. [DOI] [PubMed] [Google Scholar]
- 58.Horvath DP, Chao WS, Anderson JV. Molecular analysis of signals controlling dormancy and growth in underground adventitious buds of leafy spurge. Plant Physiol. 2002;128:1439–46. doi: 10.1104/pp.010885. [DOI] [PMC free article] [PubMed] [Google Scholar]
- 59.Skirycz A, Radziejwoski A, Busch W, Hannah MA, Czeszejko J, Kwaśniewski M, et al. The DOF transcription factor OBP1 is involved in cell cycle regulation in Arabidopsis thaliana. Plant J Cell Mol Biol. 2008;56:779–92. doi: 10.1111/j.1365-313X.2008.03641.x. [DOI] [PubMed] [Google Scholar]
- 60.Derory J, Léger P, Garcia V, Schaeffer J, Hauser M-T, Salin F, et al. Transcriptome analysis of bud burst in sessile oak (Quercus petraea) New Phytol. 2006;170:723–38. doi: 10.1111/j.1469-8137.2006.01721.x. [DOI] [PubMed] [Google Scholar]
- 61.Péret B, Swarup K, Ferguson A, Seth M, Yang Y, Dhondt S, et al. AUX/LAX genes encode a family of auxin influx transporters that perform distinct functions during Arabidopsis development. Plant Cell. 2012;24:2874–85. doi: 10.1105/tpc.112.097766. [DOI] [PMC free article] [PubMed] [Google Scholar]
- 62.Bentsink L, Koornneef M. Seed dormancy and germination. Arab Book Am Soc Plant Biol. 2008;6:e0119. doi: 10.1199/tab.0119. [DOI] [PMC free article] [PubMed] [Google Scholar]
- 63.Neff MM, Nguyen SM, Malancharuvil EJ, Fujioka S, Noguchi T, Seto H, et al. BAS1: a gene regulating brassinosteroid levels and light responsiveness in Arabidopsis. Proc Natl Acad Sci U S A. 1999;96:15316–23. doi: 10.1073/pnas.96.26.15316. [DOI] [PMC free article] [PubMed] [Google Scholar]
- 64.Karlberg A, Englund M, Petterle A, Molnar G, Sjodin A, Bako L, et al. Analysis of global changes in gene expression during activity-dormancy cycle in hybrid aspen apex. Plant Biotechnol. 2010;27:1–16. doi: 10.5511/plantbiotechnology.27.1. [DOI] [Google Scholar]
- 65.Riou-Khamlichi C, Menges M, Healy JM, Murray JA. Sugar control of the plant cell cycle: differential regulation of Arabidopsis D-type cyclin gene expression. Mol Cell Biol. 2000;20:4513–21. doi: 10.1128/MCB.20.13.4513-4521.2000. [DOI] [PMC free article] [PubMed] [Google Scholar]
- 66.Hanson J, Hanssen M, Wiese A, Hendriks MMWB, Smeekens S. The sucrose regulated transcription factor bZIP11 affects amino acid metabolism by regulating the expression of ASPARAGINE SYNTHETASE1 and PROLINE DEHYDROGENASE2. Plant J Cell Mol Biol. 2008;53:935–49. doi: 10.1111/j.1365-313X.2007.03385.x. [DOI] [PubMed] [Google Scholar]
- 67.Gao F, Jordan MC, Ayele BT. Transcriptional programs regulating seed dormancy and its release by after-ripening in common wheat (Triticum aestivum L.) Plant Biotechnol J. 2012;10:465–76. doi: 10.1111/j.1467-7652.2012.00682.x. [DOI] [PubMed] [Google Scholar]
- 68.Gonzali S, Loreti E, Solfanelli C, Novi G, Alpi A, Perata P. Identification of sugar-modulated genes and evidence for in vivo sugar sensing in Arabidopsis. J Plant Res. 2006;119:115–23. doi: 10.1007/s10265-005-0251-1. [DOI] [PubMed] [Google Scholar]
- 69.Huang X, Madan A. CAP3: a DNA sequence assembly program. Genome Res. 1999;9:868–77. doi: 10.1101/gr.9.9.868. [DOI] [PMC free article] [PubMed] [Google Scholar]
- 70.Le Provost G, Herrera R, Paiva JA, Chaumeil P, Salin F, Plomion C. A micromethod for high throughput RNA extraction in forest trees. Biol Res. 2007;40:291–7. doi: 10.4067/S0716-97602007000400003. [DOI] [PubMed] [Google Scholar]
- 71.Ewing B, Hillier L, Wendl MC, Green P. Base-calling of automated sequencer traces using phred. I Accuracy assessment. Genome Res. 1998;8:175–85. doi: 10.1101/gr.8.3.175. [DOI] [PubMed] [Google Scholar]
- 72.Tarailo-Graovac M, Chen N. Using repeatmasker to identify repetitive elements in genomic sequences. Curr Protoc Bioinforma. 2009;4:4.10.1-4.10.14. doi: 10.1002/0471250953.bi0410s25. [DOI] [PubMed] [Google Scholar]
- 73.Falgueras J, Lara AJ, Fernández-Pozo N, Cantón FR, Pérez-Trabado G, Claros MG. SeqTrim: a high-throughput pipeline for pre-processing any type of sequence read. BMC Bioinformatics. 2010;11:38. doi: 10.1186/1471-2105-11-38. [DOI] [PMC free article] [PubMed] [Google Scholar]
- 74.Zerbino DR, Birney E. Velvet: algorithms for de novo short read assembly using de Bruijn graphs. Genome Res. 2008;18:821–9. doi: 10.1101/gr.074492.107. [DOI] [PMC free article] [PubMed] [Google Scholar]
- 75.Pertea G, Huang X, Liang F, Antonescu V, Sultana R, Karamycheva S, et al. TIGR gene indices clustering tools (TGICL): a software system for fast clustering of large EST datasets. Bioinforma Oxf Engl. 2003;19:651–2. doi: 10.1093/bioinformatics/btg034. [DOI] [PubMed] [Google Scholar]
- 76.Chevreux B, Pfisterer T, Drescher B, Driesel AJ, Müller WEG, Wetter T, et al. Using the miraEST assembler for reliable and automated mRNA transcript assembly and SNP detection in sequenced ESTs. Genome Res. 2004;14:1147–59. doi: 10.1101/gr.1917404. [DOI] [PMC free article] [PubMed] [Google Scholar]
- 77.Chevreux B, Wetter T, Suhai S. Genome sequence assembly using trace signals and additional sequence information. Hannover, Germany: Proc. German Conference on Bioinformatics GCB’99 GCB; 1999. pp. 45–56. [Google Scholar]
- 78.Li W, Jaroszewski L, Godzik A. Clustering of highly homologous sequences to reduce the size of large protein databases. Bioinforma Oxf Engl. 2001;17:282–3. doi: 10.1093/bioinformatics/17.3.282. [DOI] [PubMed] [Google Scholar]
- 79.Fu L, Niu B, Zhu Z, Wu S, Li W. CD-HIT: accelerated for clustering the next-generation sequencing data. Bioinforma Oxf Engl. 2012;28:3150–2. doi: 10.1093/bioinformatics/bts565. [DOI] [PMC free article] [PubMed] [Google Scholar]
- 80.Brown CT, Howe A, Zhang Q, Pyrkosz AB, Brom TH. A reference-free algorithm for computational normalization of shotgun sequencing data. ArXiv12034802. Q-Bio. 2012. http://arxiv.org/abs/1203.4802.
- 81.Bairoch A, Boeckmann B, Ferro S, Gasteiger E. Swiss-Prot: juggling between evolution and stability. Brief Bioinform. 2004;5:39–55. doi: 10.1093/bib/5.1.39. [DOI] [PubMed] [Google Scholar]
- 82.International Peach Genome Initiative. Verde I, Abbott AG, Scalabrin S, Jung S, Shu S, et al. The high-quality draft genome of peach (Prunus persica) identifies unique patterns of genetic diversity, domestication and genome evolution. Nat Genet. 2013;45:487–94. doi: 10.1038/ng.2586. [DOI] [PubMed] [Google Scholar]
- 83.Tuskan GA, Difazio S, Jansson S, Bohlmann J, Grigoriev I, Hellsten U, et al. The genome of black cottonwood, Populus trichocarpa (Torr. & Gray) Science. 2006;313:1596–604. doi: 10.1126/science.1128691. [DOI] [PubMed] [Google Scholar]
- 84.Jaillon O, Aury J-M, Noel B, Policriti A, Clepet C, Casagrande A, et al. The grapevine genome sequence suggests ancestral hexaploidization in major angiosperm phyla. Nature. 2007;449:463–7. doi: 10.1038/nature06148. [DOI] [PubMed] [Google Scholar]
- 85.Myburg AA, Grattapaglia D, Tuskan GA, Hellsten U, Hayes RD, Grimwood J, et al. Genome sequence of Eucalyptus grandis: a global tree crop for fiber and energy. Nature. 2014;510:356–62. doi: 10.1038/nature13308. [DOI] [PubMed] [Google Scholar]
- 86.Swarbreck D, Wilks C, Lamesch P, Berardini TZ, Garcia-Hernandez M, Foerster H, et al. The Arabidopsis Information Resource (TAIR): gene structure and function annotation. Nucleic Acids Res. 2008;36(Database issue):D1009–14. doi: 10.1093/nar/gkm965. [DOI] [PMC free article] [PubMed] [Google Scholar]
- 87.Camacho C, Coulouris G, Avagyan V, Ma N, Papadopoulos J, Bealer K, et al. BLAST+: architecture and applications. BMC Bioinformatics. 2009;10:421. doi: 10.1186/1471-2105-10-421. [DOI] [PMC free article] [PubMed] [Google Scholar]
- 88.Ashburner M, Ball CA, Blake JA, Botstein D, Butler H, Cherry JM, et al. Gene ontology: tool for the unification of biology: the Gene Ontology Consortium. Nat Genet. 2000;25:25–9. doi: 10.1038/75556. [DOI] [PMC free article] [PubMed] [Google Scholar]
- 89.Camon E, Barrell D, Brooksbank C, Magrane M, Apweiler R. The Gene Ontology Annotation (GOA) Project–Application of GO in SWISS-PROT, TrEMBL and InterPro. Comp Funct Genomics. 2003;4:71–4. doi: 10.1002/cfg.235. [DOI] [PMC free article] [PubMed] [Google Scholar]
- 90.Hunter S, Apweiler R, Attwood TK, Bairoch A, Bateman A, Binns D, et al. InterPro: the integrative protein signature database. Nucleic Acids Res. 2009;37(Database issue):D211–5. doi: 10.1093/nar/gkn785. [DOI] [PMC free article] [PubMed] [Google Scholar]
- 91.Finn RD, Mistry J, Tate J, Coggill P, Heger A, Pollington JE, et al. The Pfam protein families database. Nucleic Acids Res. 2010;38(Database issue):D211–22. doi: 10.1093/nar/gkp985. [DOI] [PMC free article] [PubMed] [Google Scholar]
- 92.Conesa A, Götz S, García-Gómez JM, Terol J, Talón M, Robles M. Blast2GO: a universal tool for annotation, visualization and analysis in functional genomics research. Bioinforma Oxf Engl. 2005;21:3674–6. doi: 10.1093/bioinformatics/bti610. [DOI] [PubMed] [Google Scholar]
- 93.Thompson JD, Higgins DG, Gibson TJ. CLUSTAL W: improving the sensitivity of progressive multiple sequence alignment through sequence weighting, position-specific gap penalties and weight matrix choice. Nucleic Acids Res. 1994;22:4673–80. doi: 10.1093/nar/22.22.4673. [DOI] [PMC free article] [PubMed] [Google Scholar]
- 94.Yang Z. PAML 4: phylogenetic analysis by maximum likelihood. Mol Biol Evol. 2007;24:1586–91. doi: 10.1093/molbev/msm088. [DOI] [PubMed] [Google Scholar]
- 95.Herrmann S, Munch J-C, Buscot F. A gnotobiotic culture system with oak microcuttings to study specific effects of mycobionts on plant morphology before, and in the early phase of, ectomycorrhiza formation by Paxillus involutus and Piloderma croceum. New Phytol. 1998;138:203–12. doi: 10.1046/j.1469-8137.1998.00105.x. [DOI] [PubMed] [Google Scholar]
- 96.Ward JH., Jr Hierarchical grouping to optimize an objective function. J Am Stat Assoc. 1963;58:236–44. doi: 10.1080/01621459.1963.10500845. [DOI] [Google Scholar]
- 97.Suzuki R, Shimodaira H. Pvclust: an R package for assessing the uncertainty in hierarchical clustering. Bioinforma Oxf Engl. 2006;22:1540–2. doi: 10.1093/bioinformatics/btl117. [DOI] [PubMed] [Google Scholar]
- 98.Stekel DJ, Git Y, Falciani F. The comparison of gene expression from multiple cDNA libraries. Genome Res. 2000;10:2055–61. doi: 10.1101/gr.GR-1325RR. [DOI] [PMC free article] [PubMed] [Google Scholar]
- 99.Anders S, Huber W. Differential expression analysis for sequence count data. Genome Biol. 2010;11:R106. doi: 10.1186/gb-2010-11-10-r106. [DOI] [PMC free article] [PubMed] [Google Scholar]
- 100.Robinson MD, McCarthy DJ, Smyth GK. edgeR: a Bioconductor package for differential expression analysis of digital gene expression data. Bioinforma Oxf Engl. 2010;26:139–40. doi: 10.1093/bioinformatics/btp616. [DOI] [PMC free article] [PubMed] [Google Scholar]
- 101.Mootha VK, Lindgren CM, Eriksson K-F, Subramanian A, Sihag S, Lehar J, et al. PGC-1alpha-responsive genes involved in oxidative phosphorylation are coordinately downregulated in human diabetes. Nat Genet. 2003;34:267–73. doi: 10.1038/ng1180. [DOI] [PubMed] [Google Scholar]
- 102.Subramanian A, Tamayo P, Mootha VK, Mukherjee S, Ebert BL, Gillette MA, et al. Gene set enrichment analysis: a knowledge-based approach for interpreting genome-wide expression profiles. Proc Natl Acad Sci U S A. 2005;102:15545–50. doi: 10.1073/pnas.0506580102. [DOI] [PMC free article] [PubMed] [Google Scholar]