

Abstract
Protein alkylation by 4-hydroxy-2-nonenal (HNE), an endogenous lipid derived electrophile, contributes to stress signaling and cellular toxicity. Although previous work has identified protein targets for HNE alkylation, the sequence specificity of alkylation and dynamics in a cellular context remain largely unexplored. We developed a new quantitative chemoproteomic platform, which uses isotopically tagged, photocleavable azido-biotin reagents to selectively capture and quantify the cellular targets labeled by the alkynyl analogue of HNE (aHNE). Our analyses site-specifically identified and quantified 398 aHNE protein alkylation events (386 cysteine sites and 12 histidine sites) in intact cells. This data set expands by at least an order of magnitude the number of such modification sites previously reported. Although adducts formed by Michael addition are thought to be largely irreversible, we found that most aHNE modifications are lost rapidly in situ. Moreover, aHNE adduct turnover occurs only in intact cells and loss rates are site-selective. This quantitative chemoproteomics platform provides a versatile general approach to map bioorthogonal-chemically engineered post-translational modifications and their cellular dynamics in a site-specific and unbiased manner.
The covalent modification of proteins by endogenous lipid derived electrophiles (LDEs) triggers cytotoxic and adaptive responses associated with oxidative stress.1,2 Of the dozens of known LDEs, 4-hydroxy-2-nonenal (HNE) is the most studied, owing to its high reactivity and evidence that it activates diverse pathways governing cellular signaling and stress.3,4 Understanding how HNE and other LDEs modify cellular proteomes can offer new insights into mechanisms of chemical toxicity, inflammation, and disease.
Mass spectrometry (MS) based proteomics provides the means to globally profile cellular targets of LDEs in complex samples. For example, we and others have described proteomic methods to identify and quantify up to several hundred putative protein targets of HNE.5−7 These large-scale studies have not only expanded the catalog of HNE-protein targets but also presented new insights into how alkylation damage mediates cellular effects. Nevertheless, a key limitation of previous methods is that they identified HNE-modified proteins but did not pinpoint sites of HNE alkylation. Indeed, identification of protein alkylation sites definitively proves that the modification occurs. Although several prior studies reported site identification for protein alkylation by HNE, these have come from analyses of isolated proteins treated with high concentration of HNE in vitro,8−11 which might not be toxicologically or physiologically relevant. Proteome-wide mapping of protein sites alkylated by HNE in intact cells remains an unmet challenge.
Recently, Wang et al.12 reported the first global, site-specific survey of cysteine targets of LDEs, including HNE, by a competitive chemoproteomic strategy. Because the method measured protection by HNE and other electrophiles against cysteine labeling with a thiol-reactive probe, the method was directed specifically to thiols. This approach produced the first global, site-specific characterization of thiol modification by LDEs and identified a subset of highly reactive thiols, consistent with our previous global proteome analyses.5 However, these studies were done in cell lysates, rather than in intact cells, and the thiol-directed strategy was unable to detect LDE modifications at other nucleophilic amino acids in proteomes.
Despite these impressive advances in analysis of LDE–protein interactions, the molecular selectivity of LDE in cells remains uncertain with respect to key questions. For example, do LDEs target specific sequence motifs in proteins? What is the scope of LDE reactions with nucleophilic amino acids beyond cysteine in cells? What are the dynamics of LDE-mediated covalent modification in cells, particularly with respect to adduct stability and turnover?
We recently described a chemoproteomics method for site-specific mapping of protein S-sulfenylation in cells,13 in which S-sulfenyl residues are tagged with the alkynyl-dimedone probe DYn-2, then biotinylated by Click chemistry with a UV-cleavable azido-biotin (Az-UV-biotin),14 which permits efficient streptavidin capture and photorelease of tagged, S-sulfenyl peptides. Quantitative comparisons were achieved with the use of unlabeled and deuterated DYn-2 probes.
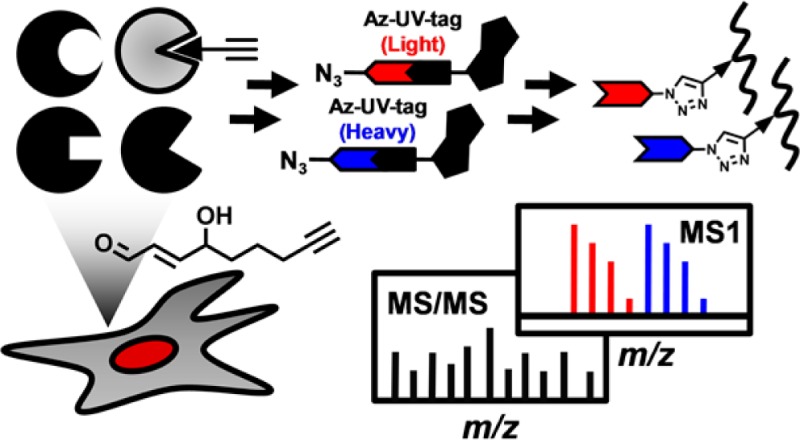
Here we present a new quantitative chemoproteomic platform to achieve large-scale, in situ, site-specific identification and quantification of ∼400 protein alkylation events by the alkynyl analogue of HNE (aHNE, Scheme 1) in cells. The results not only greatly expand the inventory of HNE-targeting sites in complex proteomes but also reveal unexpected instability of aHNE adducts in a cellular environment. A key feature of the new method is the use of light and heavy (13C6)-labeled Az-UV-biotin reagents (Scheme 1), which provide for quantitative comparisons without the need for isotopically labeled probes. Thus, our new chemoproteomics platform is broadly applicable to qualitative and quantitative analyses of modifications by diverse protein reactive probes or to bioorthogonal-chemically engineered post-translational modifications.
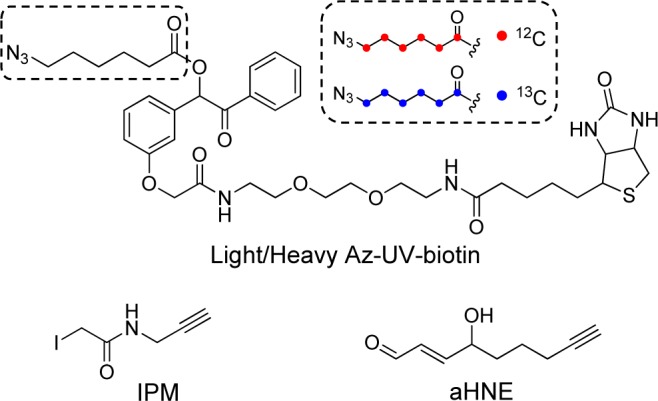
Scheme 1. Chemical Structures of Light (Red) and Heavy (Blue) Azido-UV–Biotin Reagents and Alkynyl Electrophile Probes Used in This Study.
Experimental Section
Reagents
Light and heavy (13C6) Az-UV-biotin reagents were synthesized as described in the Supporting Information. 2-Iodo-N-(prop-2-yn-1-yl)acetamide (IPM) and alkynyl HNE (aHNE) were synthesized as previously described.14−16 Strong cation exchange (SCX) spin columns were purchased from Nest group (Southborough, MA). Streptavidin sepharose was purchased from GE Healthcare Life Sciences. HPLC-grade water, acetonitrile, and methanol were purchased from J.T. Baker (Center Valley, PA). Other chemicals and reagents were obtained from Sigma-Aldrich (St. Louis, MO) unless otherwise indicated.
Cell Culture and Treatment
RKO cells (American Type Culture Collection, ATCC, Washington, DC) were maintained at 37 °C in a 5% CO2, humidified atmosphere and were cultured in McCoy medium (Life Technologies, Grand Island, NY) containing 10% fetal bovine serum (Atlas Biologicals, Fort Collins, CO). Cells were grown until 80–90% confluence, rinsed with 1× phosphate buffered saline (1×PBS, Life Technologies, Grand Island, NY) quickly, and treated with 50 μM aHNE prepared in serum-free medium for 2 h. Treatments were stopped by removing the medium. Cells were scraped mechanically and pelleted by centrifugation. For recovery experiments, cells were cultured as above, treated for 2 h with 50 μM aHNE, and then either harvested immediately (Control) or incubated for 1 h or 4 h in serum-free medium without aHNE. Where indicated, cells were pretreated for 30 min with 10 μM MG132 to inhibit proteasomal degradation; MG132 was again added to the culture medium during subsequent incubation.
Sample Preparation
Cell pellets were lysed on ice in HEPES lysis buffer (50 mM HEPES, 150 mM NaCl, 1% Igepal, pH 7.5) containing Halt protease and phosphatase inhibitor cocktail (Thermo Fisher Scientific, Rockford, IL). The lysate was first treated with 4 mM NaBH4 for 1 h at room temperature to reduce aHNE adduct carbonyls and prevent reversion of Michael adducts. The lysate was further incubated with 8 mM dithiothreitol (Research Products International, Prospect, IL) at 75 °C for 15 min to reduce reversibly oxidized cysteines. Reduced cysteines then were alkylated with 32 mM iodoacetamide for 30 min in the dark. Proteins were then precipitated with methanol–chloroform (aqueous phase/methanol/chloroform, 4:4:1 (v/v/v)) as previously described.13 The precipitated protein pellets were resuspended with 50 mM ammonium bicarbonate containing 0.2 M urea. Protein concentrations of these resuspended samples were determined with the BCA assay (Thermo Fisher Scientific, Rockford, IL) and adjusted to give a protein concentration of 2 mg/mL. Resuspended proteins were first digested with sequencing grade trypsin (Promega, Madison, WI) at a 1:50 (enzyme/substrate) ratio overnight at 37 °C. A secondary digestion was performed by adding additional trypsin to a 1:100 (enzyme/substrate) ratio, followed by incubation at 37 °C for an additional 4 h. The tryptic digests were desalted with HLB extraction cartridges (Waters, Milford, MA) and then evaporated to dryness under vacuum.
Click Chemistry, Capture, and Enrichment
Desalted tryptic digests were reconstituted in a solution containing 30% acetonitrile in water. The pH of the peptide mixture was adjusted to around six. Click chemistry was performed by the addition of 0.8 mM either light Az-UV-biotin or heavy Az-UV-biotin (2.5 μL of a 40 mM stock), 8 mM sodium ascorbate (10 μL of a 100 mM stock), 1 mM tris[(1-benzyl-1H-1,2,3-triazol-4-yl)methyl]amine (TBTA, 2.5 μL of a 50 mM stock), and 8 mM CuSO4 (10 μL of a 100 mM stock). Samples were allowed to react at room temperature for 2 h in the dark with rotation. The light- and heavy Az-UV-biotin labeled samples then were mixed together immediately following Click chemistry. The labeled samples were purified by strong cation exchange (SCX) chromatography as previously described13 and then incubated with prewashed streptavidin sepharose for 2 h at room temperature. The streptavidin sepharose then was washed with 50 mM sodium acetate, 50 mM sodium acetate containing 2 M sodium chloride, and water twice each with vortex mixing or vigorous rotation to remove nonspecifically bound peptides, and the mixture then was resuspended in 25 mM ammonium bicarbonate. The suspension of streptavidin sepharose was transferred to several glass tubes (VWR, Radnor, PA) and irradiated with 365 nm UV light (Entela, Upland, CA) for 2 h at room temperature with stirring. The supernatant containing the photoreleased, tagged peptides was collected, evaporated to dryness under vacuum, and stored at −20 °C until analysis.
Liquid Chromatography–Tandem Mass Spectrometry (LC–MS/MS) Analysis
LC–MS/MS analyses were performed on a Q Exactive plus mass spectrometer operated with an Easy-nLC1000 system (Thermo Fisher Scientific, Rockford, IL). Samples were reconstituted in 0.1% formic acid and pressure-loaded onto a 360 μm outer diameter × 75 μm inner diameter microcapillary precolumn packed with Jupiter C18 (5 μm, 300 Å, Phenomenex), which was then washed with 0.1% formic acid. The precolumn was connected to a 360 μm outer diameter × 50 μm inner diameter microcapillary analytical column packed with the ReproSil-Pur C18-AQ (3 μm, 120 Å, Dr. Maisch) and equipped with an integrated electrospray emitter tip. The spray voltage was set to 1.5 kV and the heated capillary temperature to 250 °C. LC gradient elution was done at a flow rate of 300 nL/min with a binary solvent system wherein solvent A was 0.1% aqueous formic acid and solvent B was 0.1% formic acid in acetonitrile. The elution program was as follows: 0–15 min, 2% B; 35 min, 15% B; 40 min, 20% B; 50 min, 30% B; 55 min, 35% B; 59–65 min, 90% B; 80–85 min, 2% B. HCD MS/MS spectra were recorded in the data-dependent mode using a “top 20” method. MS1 spectra were measured with a resolution of 70 000, an AGC target of 3 × 10⁶, and a mass range from m/z 300 to 1800. HCD MS/MS spectra were acquired with a resolution of 17 500, an AGC target of 2 × 10⁵, and normalized collision energy of 28. Peptide m/z that triggered MS/MS scans were dynamically excluded from further MS/MS scans for 20 s.
MS Data Analysis: Identification and Quantification
Raw data files were searched using the TagRecon algorithm17 against a decoy protein database consisting of forward and reversed sequences from the human RefSeq database (version 20130621). Precursor ion mass tolerance was 0.01 Da and fragmentation tolerance was 0.1 Da for the database search. The maximum number of modifications allowed per peptide was three, as was the maximum number of missed cleavages allowed. Different modifications of + 15.9949 Da (methionine oxidation), + 57.0214 Da (iodoacetamide alkylation), + 311.1845 (Azido-L-modification), and + 317.2046 (Azido-H-modification) were searched as dynamic modifications. The maximum Q value of peptide-spectrum matches was set as 0.01 using IDPicker 3.0 software.18,19 Additional assessments were performed as described in the main text, which results in a final false-positive rate below 0.5%. Quantification of light/heavy ratios for tagged peptides was performed using Skyline software as previously described.13,20 Quantification results were obtained from two or three biological replicates with two technical replicate LC–MS/MS runs for each.
In-Gel Imaging and Immunoblotting
RKO cells were cultured and treated with or without aHNE and lysed as described above. Cell lysate (2 mg/mL) was incubated with 100 μM noncleavable azidobiotin16 or CruzFluor sm 6 azide (700 nm, Santa Cruz Biotechnologies, Santa Cruz, CA), 1 mM sodium ascorbate, 100 μM TBTA, and 1 mM CuSO4 for 2 h in the dark at room temperature with rotation. Reactions were quenched by boiling with LDS sample buffer (Life Technologies, Grand Island, NY) for 10 min. The collected proteins were resolved on SDS-PAGE gels and detected by either immunoblotting with fluorescein-conjugated streptavidin (Alexa Fluor 680 nm, Life Technologies, Grand Island, NY) or direct in-gel imaging of fluorescein conjugated adducts as indicated. Detection was performed with the Odyssey Infrared Imaging System (Li-Cor, Lincoln, NE).
Results and Discussion
Strategy and Features of a Generalized, Quantitative Chemoproteomic Platform
We have adopted key features of our recently published chemoproteomic method for site-specific mapping of protein S-sulfenylation in cells,13 including site labeling with an alkynyl probe, bioorthogonal conjugation with Az-UV-biotin, and high resolution LC–MS/MS. However, our previous quantification strategy relied on a stable isotope-labeled probe, the availability of which may limit adoption of the approach. To overcome this problem, we modified the Az-UV-biotin reagent to incorporate a light or heavy (13C6) linker between the azide and benzoin ester moiety to generate isotopically azido-tagged photocleavable biotin reagents (Scheme 1). The mass difference between these two reagents is 6 Da. Figures S1 and S2 in the Supporting Information indicate that the reaction efficiencies and the photorelease rates of these isotope-coded Az-UV-biotin reagents are identical, which demonstrates that they can be utilized to obtain accurate quantification results.
Our generalized, site-centric quantitative chemoproteomic strategy (Figure 1) has five major steps (1) labeling or metabolic incorporation of cells under different conditions with an alkyne tagged probe, (2) digesting cell lysates into peptides with trypsin, (3) conjugating the alkyne tagged peptides with light Az-UV-biotin or heavy Az-UV-biotin via CuI-catalyzed azide–alkyne cycloaddition reaction (Click chemistry),21 (4) enrichment of biotin-tagged tryptic peptides by streptavidin capture and photorelease, (5) liquid chromatography–tandem mass spectrometry (LC–MS/MS)-based shotgun proteomics and informatics analyses for peptide identification and quantification. The isotopic signatures of light and heavy isotope-labeled peptides can be determined by MS1 filtering as previously reported13 and we used both to minimize the false discovery rate in a large-scale proteomic analyses and to quantitatively compare abundances of the protein modification of interest between two conditions.
Figure 1.
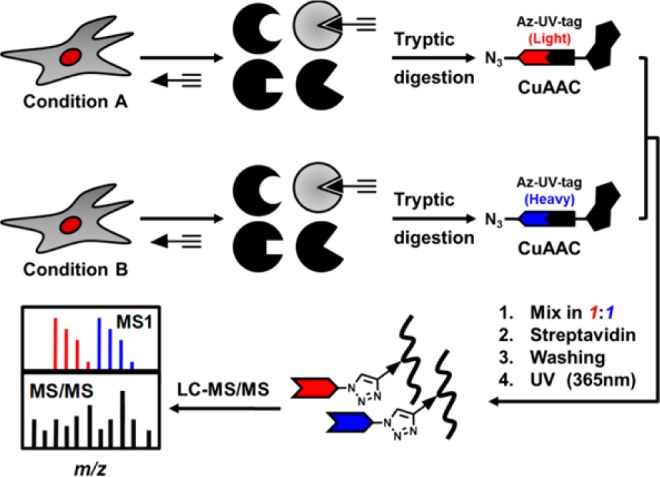
Schematic representation of a site-centric quantitative chemoproteomic workflow.
We verified the accuracy of this strategy by mixing varying amounts of light Az-UV-biotin and heavy Az-UV-biotin tagged proteomes in different ratios (L/H = 1:4, 1:2, 1:1, 2:1, 4:1). The measured signals for labeled cysteine containing peptides closely matched the predefined ratios across all the quantifiable peptides (Figure 2). Moreover, the representative XIC chromatograms demonstrate the coelution of the light and heavy species, the high signal-to-noise, and the accuracy of quantification (Figure 3).
Figure 2.
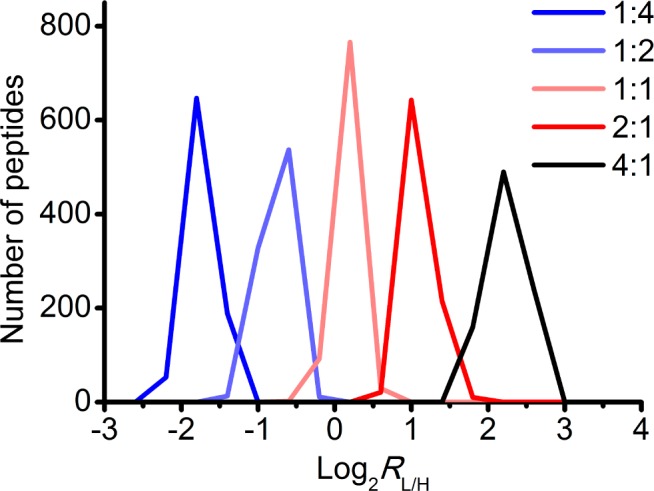
Validation of the accuracy of quantitative chemoproteomic analysis. RKO proteomes were labeled with the alkyne tagged cysteine alkylating reagent, IPM (Scheme 1), and digested into tryptic peptides. Aliquots of peptide mixtures were conjugated with light or heavy isotopic tagged Az-UV-biotin reagents and mixed in predefined ratios (RL/H = 1:4, 1:2 1:1, 2:1, 4:1). After affinity capture and photorelease, the alkylated peptides were analyzed by LC–MS/MS, and the light/heavy ratios were calculated for IPM-modified cysteine containing peptides. The distributions of these ratios demonstrate the accuracy of this quantitative chemoproteomic workflow. Data are displayed using a log 2 scale on the x axis.
Figure 3.
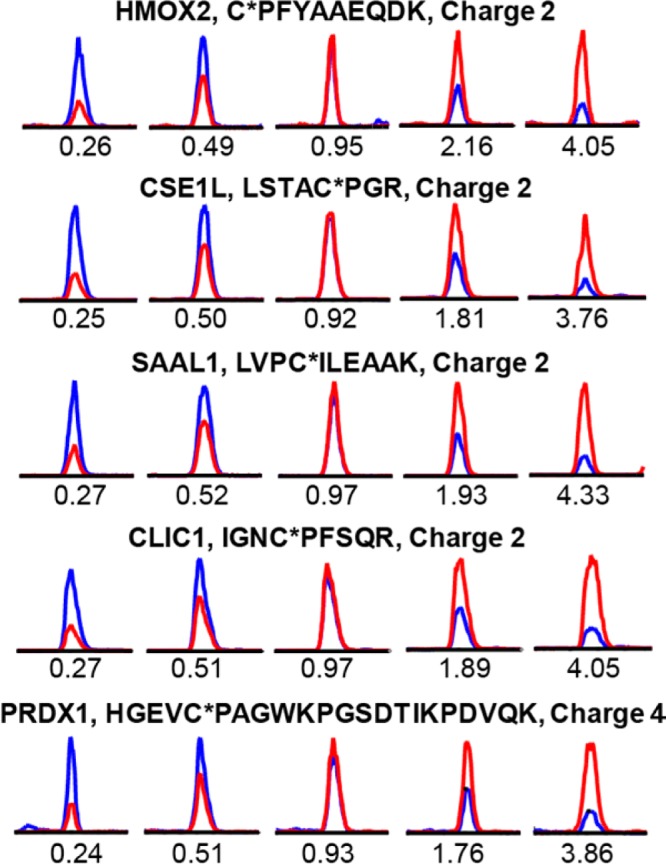
Representative extracted ion chromatograms (XIC) for the IPM-labeled peptides from five proteins at predefined ratios (L/H = 1:4, 1:2 1:1, 2:1, 4:1, from left to right). The profiles for light- and heavy-labeled peptides are shown in red and blue, respectively. The peptide sequence, modified sites (with asterisk), and charge status are shown above the individual chromatograms. The measured light/heavy ratios (RL/H) are displayed below each individual chromatogram.
Proteome-Wide, Site-Specific Analysis of Protein Alkylation by aHNE in Cells
We performed an analysis of protein modification by aHNE, which displays reactivity and cellular toxicity essentially identical to HNE.16 RKO cells were treated with 50 μM aHNE for 2 h, a dose and time point at which no toxicity is observed. After tryptic digestion of cell lysates, aHNE-modified peptides from two identical proteome samples were conjugated with the light and heavy Az-UV-biotin reagents, respectively, and mixed at a 1:1 ratio. The biotinylated peptides were captured with streptavidin and tagged peptides corresponding to aHNE adducts were released by photocleavage of the biotin linker. The released peptides then were analyzed on a Q-Exactive Plus instrument with high-energy collisional dissociation (HCD)-based MS/MS,22 allowing for identification and quantification. The mass errors for the precursor and fragment ions of modified peptides were within the range of 5 and 10 ppm, respectively (Figure S3 in the Supporting Information). Because α,β-unsaturated aldehydes are thought to predominately alkylate cysteines through Michael addition in cells,12,23 we initially considered only cysteine modifications as dynamic modifications during the database searching in our informatics pipeline.24,25 We detected 457 distinct aHNE modified cysteine containing peptides on 418 proteins with FDR less than 1% at both the peptide and protein levels. As mentioned above, peptide aHNE adducts covalently conjugated with light and heavy tags would yield an isotopic signature that efficiently identifies these peptides in a complex proteomic data set, thereby increasing the confidence of modified peptide identifications. Thus, we recognized only those alkylated peptide assignments whose MS1 data reflected a light/heavy ratio between 0.67 and 1.5. In addition, we found that the light and heavy modified peptides produced diagnostic fragment ions (DFI) at m/z of 292.2 and 298.2, respectively, which reflects characteristic fragmentation of the tagged Michael adducts.4 The modified peptides also tend to produce water-loss fragment ions during HCD fragmentation. To ensure the accuracy of site-localization, we utilized our previously reported protocol for manual evaluation of all spectra of modified peptides.13 For example, we observed that aHNE selectively modifies the Cys-73 of thioredoxin 1 (TXN1) in cells, as demonstrated by the characteristic isotopic envelopes in the representative MS1 spectrum, the light to heavy ratio calculated from the XIC peaks, and the fully annotated MS/MS spectrum with DFI generated from the tagged peptides (Figure 4). In total, we identified 386 aHNE-adducted cysteine sites on 335 proteins in cells (Table S1 in the Supporting Information), which presents at least an order of magnitude increase of the number of such modification sites previously known. In addition to TXN1,26 several known protein targets of HNE are also confirmed in this study, such as GCLM,11 GAPDH,27 ACTN1,28 and EFABP.29 Notably, our data set also covers many “hot spot” cysteines for modification by HNE on the proteins identified by Wang et al.,12 such as PHGDH Cys-369, RTN4 Cys-1101, REEP5 Cys-18, and EEF2 Cys-41 (Figure S4 in the Supporting Information).
Figure 4.
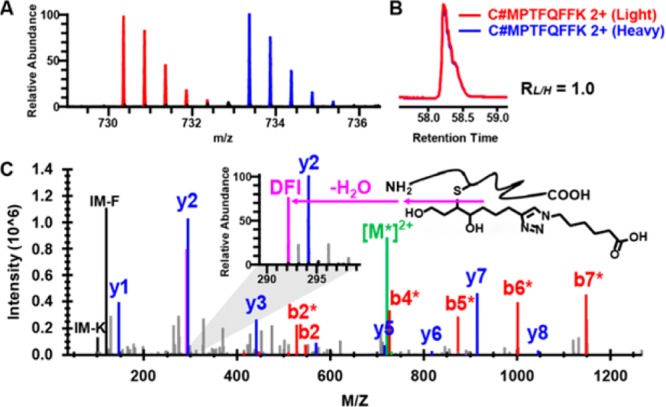
Identification of Cys-73 of thioredoxin 1 as an alkylation target site by aHNE in RKO cells. (A) MS1 spectrum of an aHNE-triazol-hexanoic acid modified peptide from thioredoxin 1. Doubly charged monoisotopic precursors of light and heavy labeled the peptide are observed at m/z 730.3588 (red) and 733.3686 (blue), respectively, with mass errors less than 1.0 ppm. (B) XIC are shown for changes in the same aHNE-modified peptides from thioredoxin with the profiles for light- and heavy-labeled peptides in red and blue, respectively. (C) Characteristic fragmentation of the light-labeled modified peptide and its HCD MS/MS spectrum. A zoom window displays the diagnostic fragment ion (DFI) peak (m/z 292.2). The asterisks on the annotated ions indicate water losses from the corresponding b- and y-ion fragments.
To determine whether aHNE reacts with nucleophilic amino acids other than cysteine in cells, we also specified histidine, arginine, and lysine as variable modification sites for database search. Most of the putative adducts identified in these searches were found to be false positives after rigorous manual validation (data not shown). Nonetheless, we identified 12 aHNE-alkylated histidine sites on 10 proteins, (Table S2 in the Supporting Information), whereas neither lysine nor arginine adducts were identified. Although the number of noncysteine modifications was relatively small, several were interesting. For example, aHNE selectively modified His-442 rather than several known redox-sensitive cysteines on HSP90AB1 (heat shock protein HSP 90-beta) in situ (Figure S5 in the Supporting Information), which confirms our previous finding.30 Similarly, His-211 and His-300 were detected as the aHNE-adducted sites on the ALDOA protein (Figure S5 in the Supporting Information).
GO classification using NetGestalt31 revealed that 344 aHNE-alkylated proteins identified in this study included targets in all major cellular compartments, including cytoplasm, nucleolus, nucleoplasm, chromosome, and mitochondria. The adducted proteins are involved in important biological processes, such as RNA processing (p = 9.9 × 10⁻⁹), protein ubiquitination (p = 3.0 × 10⁻²), and cell cycle (p = 3.2 × 10⁻²). The molecular function most significantly enriched for aHNE protein targets is RNA binding (p = 4.2 × 10⁻¹¹). This observation is in accord with our previous findings5,32,33 and demonstrates with peptide sequence-level adduction data that aHNE preferentially targets RNA splicing-related networks.
To explore structural features associated with HNE-mediated protein alkylation, we examined flanking sequences of aHNE-alkylated cysteine or histidine residues with the pLogo algorithm for the presence of linear motifs.34 Interestingly, lysine was significantly overrepresented at the +4 position in aHNE-alkylated cysteine sequences, whereas aHNE targeted histidine sites do not conform to a sequence motif (p < 0.05, Figure S6 in the Supporting Information). Indeed, the positively charged lysine is able to lower the cysteine pKa at an adjacent position and to facilitate cysteine S-alkylation by electrophilic chemicals.35,36 We also found that cysteine is underrepresented in consensus flanking sequences of protein S-alkylation by aHNE (Figure S6 in the Supporting Information), which is a common feature for most post-translational modifications on cysteine.13
Direct Proteomic Quantification of Dynamic Protein Alkylation by aHNE
Although protein alkylation by electrophilic α,β-unsaturated carbonyl compounds (i.e., Michael addition) is generally thought to be a stable covalent modification, there is evidence that the reaction may be reversible in certain cellular contexts.15,37 Our chemoproteomics platform provided an opportunity to further examine the global stability of LDE protein alkylation in cells (Figure S7 in the Supporting Information). We first labeled cells with aHNE for 2 h and then replaced the labeling medium with aHNE-free medium for another 1 and 4 h recovery period, respectively. The cell lysates from 2 h of aHNE treatment without recovery were used as controls and were labeled with the heavy Az-UV-biotin reagent, whereas the samples from 1- and 4 h recovery experiments were labeled with the light Az-UV-biotin. Analysis of aHNE adducts revealed a surprisingly high degree of adduct loss at 1 and 4 h of recovery (Figure S8 in the Supporting Information). In total, ∼87% of quantifiable aHNE alkylating events showed at least a 2-fold decrease over the course of 4 h (R4h < 0.5). Nevertheless, as can be seen from the heatmaps (Figure 5A for cysteine adduction and Figure S9 in the Supporting Information for histidine adduction), several individual aHNE alkylations were quite stable. For example, the measured light to heavy ratios for EDC4 Cys-976 from controls and the 1- and 4 h recovery experiments were 1.5, 1.5, and 1.7, respectively (Table S1 in the Supporting Information), which suggests this alkylation event is almost unchanged during the recovery period. Notably, of four cysteine residues modified by aHNE on FAM120A, Cys-919, Cys-1088, and Cys-1103 showed dramatic decreases in S-alkylation after 1–4 h recovery periods, whereas S-alkylation on Cys-531 remained almost unchanged (Figure 5B). This finding suggests that the site-specific aHNE alkylation dynamics in cells is mediated by some unknown repair or reversion processes, rather than by global protein degradation. In accordance with this hypothesis, we found that the turnover of aHNE-protein adducts in cells was not affected by coincubation with the proteasome inhibitor MG132 (Figure 5C and Figure S10 in the Supporting Information).
Figure 5.
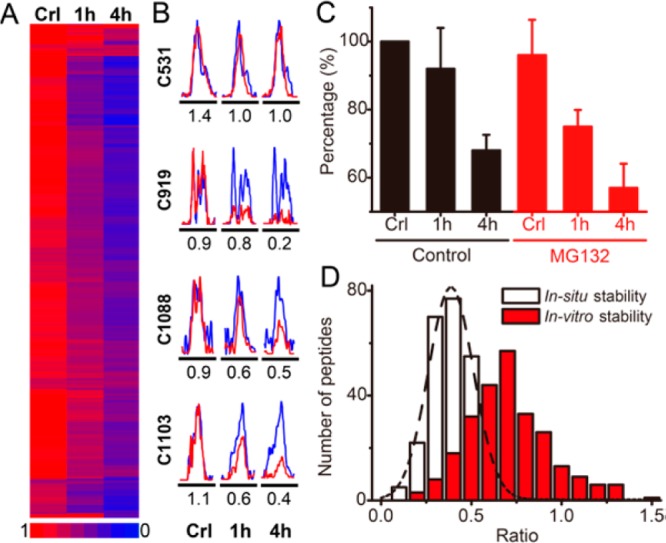
Dynamics of protein S-alkylation by aHNE in RKO cells. (A) Heatmap of ratios of changes of all detected cysteine S-alkylation events shows that most adducts turn over rapidly in a time-dependent manner in cells. Lower the measured ratio (L/H) indicates more rapid turnover. (B) XIC are shown for changes in S-alkylated peptides from FAM120A protein in RKO cells, with the profiles for light- and heavy- labeled peptides in red and blue, respectively. The mean measured ratios were calculated from three biological replicate experiments and are displayed below the individual chromatograms, respectively. (C) Turnover of alkylation is not affected by proteasome inhibition. RKO cells were pretreated with (red) or without MG132 (black), followed by aHNE treatment with or without 1 and 4 h recovery periods. Proteins alkylated by aHNE were labeled with azido-biotin and detected by Western blotting with fluorescein-conjugated streptavidin. Data were presented as mean values ± SD, n = 3 biological replicates per group. A representative Western blot is shown in Figure S10 in the Supporting Information. (D) Distributions of the measured ratios of dynamic aHNE-cysteine adduction in vitro (red) and in situ (white).
We next tested the role of an intact cellular environment in aHNE alkylation turnover. After 2 h of treatment of aHNE, we lysed the cells and incubated the lysates at 37 °C for 4 h. We labeled aHNE-modified proteins by Click chemistry conjugation with an azido reagent with a fluorescent reporter tag followed by in gel visualization (Figure S11 in the Supporting Information). A 4 h recovery in the lysate led to relatively little change in the signals for alkylated proteins, in contrast to the 4 h recovery in intact cells, which led to a dramatic decrease in adducted protein signals. We enriched alkylated peptides from the lysate and intact cell recovery experiments, digested the proteins and quantified adducted peptides by light/heavy Az-UV-biotin labeling and LC–MS/MS (Table S3 in the Supporting Information). Approximately 43% of the alkylation events on cysteines did not change significantly (R > 0.67) over the course of 4 h in lysates. On the other hand, 98% of these alkylation events were decreased in intact cells. We plotted the probability distributions for measured ratios of dynamic aHNE-cysteine alkylation in lysates and in intact cells (Figure 5D). Our analyses found that aHNE-histidine adducts exhibited comparable instability in intact cells but not in lysates (data not shown).
These results indicate that most aHNE-protein adducts are unstable in intact cells, but that adduct stability appears to be highly site-selective. In contrast, the same adducts are relatively stable in lysates from the same cells. The results suggest that aHNE adduct instability is mediated by factors present in intact, metabolically competent cells and is not due to simple chemical instability.
Conclusion
We have developed a quantitative chemoproteomics analysis platform that employs a novel, isotope-labeled Az-UV-biotin reagent. This method afforded the first site specific adduct inventory and quantification of protein alkylation by a lipid electrophile probe, aHNE, in intact cells. The analyses generated ∼400 protein alkylation sites on cysteine and histidine residues and revealed a characteristic sequence motif of CxxxK for aHNE S-alkylation. A key finding of this study is that protein alkylation by LDE is highly dynamic in intact cells and that adduct turnover rates vary in a site-specific manner. Further study of protein-electrophile adduct dynamics could provide new insights into mechanisms of toxicity involving covalent modification. The quantitative chemoproteomics strategy we describe provides a broadly applicable approach to a site-specific map and quantify probe-modified and bioorthogonally engineered post-translational modifications in an unbiased manner.
Acknowledgments
This work was supported by NIH Grants U24CA159988 and R01ES022936.
Supporting Information Available
Experimental details of chemical synthesis and additional figures and tables (Figures S1–S11 and Tables S1–S3). This material is available free of charge via the Internet at http://pubs.acs.org.
Author Contributions
J.Y. conceived the project, designed and performed the experiments, analyzed the data, and wrote the manuscript. K.A.T. synthesized the light and heavy Az-UV-biotin and edited the manuscript. N.A.P. and D.C.L. supervised the project and edited the manuscript. All authors have given approval to the final version of the manuscript.
The authors declare no competing financial interest.
Funding Statement
National Institutes of Health, United States
Supplementary Material
References
- Rudolph T. K.; Freeman B. A. Sci. Signaling 2009, 2, re7. [DOI] [PMC free article] [PubMed] [Google Scholar]
- Dalleau S.; Baradat M.; Gueraud F.; Huc L. Cell Death Differ. 2013, 20, 1615–1630. [DOI] [PMC free article] [PubMed] [Google Scholar]
- Barrera G.; Pizzimenti S.; Ciamporcero E. S.; Daga M.; Ullio C.; Arcaro A.; Cetrangolo G. P.; Ferretti C.; Dianzani C.; Lepore A.; Gentile F. Antioxid. Redox Signaling 2014, 10.1089/ars.2014.6166. [DOI] [PubMed] [Google Scholar]
- Spickett C. M. Redox Biol. 2013, 1, 145–152. [DOI] [PMC free article] [PubMed] [Google Scholar]
- Codreanu S. G.; Ullery J. C.; Zhu J.; Tallman K. A.; Beavers W. N.; Porter N. A.; Marnett L. J.; Zhang B.; Liebler D. C. Mol. Cell. Proteomics 2014, 13, 849–859. [DOI] [PMC free article] [PubMed] [Google Scholar]
- Codreanu S. G.; Zhang B.; Sobecki S. M.; Billheimer D. D.; Liebler D. C. Mol. Cell. Proteomics 2009, 8, 670–680. [DOI] [PMC free article] [PubMed] [Google Scholar]
- Zhao Y.; Miriyala S.; Miao L.; Mitov M.; Schnell D.; Dhar S. K.; Cai J.; Klein J. B.; Sultana R.; Butterfield D. A.; Vore M.; Batinic-Haberle I.; Bondada S.; St Clair D. K. Free Radicals Biol. Med. 2014, 72, 55–65. [DOI] [PMC free article] [PubMed] [Google Scholar]
- Golizeh M.; Abusarah J.; Benderdour M.; Sleno L. Chem. Res. Toxicol. 2014, 27, 1556–1565. [DOI] [PubMed] [Google Scholar]
- Ramanathan R.; Mancini R. A.; Suman S. P.; Beach C. M. J. Agric. Food Chem. 2014, 62, 2112–2117. [DOI] [PubMed] [Google Scholar]
- Liu Q.; Simpson D. C.; Gronert S. J. Mass Spectrom. 2012, 47, 411–424. [DOI] [PMC free article] [PubMed] [Google Scholar]
- Backos D. S.; Fritz K. S.; Roede J. R.; Petersen D. R.; Franklin C. C. Free Radicals Biol. Med. 2011, 50, 14–26. [DOI] [PMC free article] [PubMed] [Google Scholar]
- Wang C.; Weerapana E.; Blewett M. M.; Cravatt B. F. Nat. Methods 2014, 11, 79–85. [DOI] [PMC free article] [PubMed] [Google Scholar]
- Yang J.; Gupta V.; Carroll K. S.; Liebler D. C. Nat. Commun. 2014, 5, 4776. [DOI] [PMC free article] [PubMed] [Google Scholar]
- Kim H. Y.; Tallman K. A.; Liebler D. C.; Porter N. A. Mol. Cell. Proteomics 2009, 8, 2080–2089. [DOI] [PMC free article] [PubMed] [Google Scholar]
- Lin D.; Saleh S.; Liebler D. C. Chem. Res. Toxicol. 2008, 21, 2361–2369. [DOI] [PMC free article] [PubMed] [Google Scholar]
- Vila A.; Tallman K. A.; Jacobs A. T.; Liebler D. C.; Porter N. A.; Marnett L. J. Chem. Res. Toxicol. 2008, 21, 432–444. [DOI] [PMC free article] [PubMed] [Google Scholar]
- Dasari S.; Chambers M. C.; Slebos R. J.; Zimmerman L. J.; Ham A. J.; Tabb D. L. J. Proteome Res. 2010, 9, 1716–1726. [DOI] [PMC free article] [PubMed] [Google Scholar]
- Holman J. D.; Ma Z. Q.; Tabb D. L. In Current Protocols in Bioinformatics; John Wiley and Sons: New York, 2012; Chapter 13, Unit 13.24. [Google Scholar]
- Ma Z. Q.; Dasari S.; Chambers M. C.; Litton M. D.; Sobecki S. M.; Zimmerman L. J.; Halvey P. J.; Schilling B.; Drake P. M.; Gibson B. W.; Tabb D. L. J. Proteome Res. 2009, 8, 3872–3881. [DOI] [PMC free article] [PubMed] [Google Scholar]
- Schilling B.; Rardin M. J.; MacLean B. X.; Zawadzka A. M.; Frewen B. E.; Cusack M. P.; Sorensen D. J.; Bereman M. S.; Jing E.; Wu C. C.; Verdin E.; Kahn C. R.; Maccoss M. J.; Gibson B. W. Mol. Cell. Proteomics 2012, 11, 202–214. [DOI] [PMC free article] [PubMed] [Google Scholar]
- Thirumurugan P.; Matosiuk D.; Jozwiak K. Chem. Rev. 2013, 113, 4905–4979. [DOI] [PubMed] [Google Scholar]
- Olsen J. V.; Macek B.; Lange O.; Makarov A.; Horning S.; Mann M. Nat. Methods 2007, 4, 709–712. [DOI] [PubMed] [Google Scholar]
- Weerapana E.; Simon G. M.; Cravatt B. F. Nat. Chem. Biol. 2008, 4, 405–407. [DOI] [PMC free article] [PubMed] [Google Scholar]
- Ma Z. Q.; Tabb D. L.; Burden J.; Chambers M. C.; Cox M. B.; Cantrell M. J.; Ham A. J.; Litton M. D.; Oreto M. R.; Schultz W. C.; Sobecki S. M.; Tsui T. Y.; Wernke G. R.; Liebler D. C. Bioinformatics 2011, 27, 3214–3215. [DOI] [PMC free article] [PubMed] [Google Scholar]
- Holman J. D.; Dasari S.; Tabb D. L. Methods Mol. Biol. 2013, 1002, 167–179. [DOI] [PMC free article] [PubMed] [Google Scholar]
- Go Y. M.; Halvey P. J.; Hansen J. M.; Reed M.; Pohl J.; Jones D. P. Am. J. Pathol. 2007, 171, 1670–1681. [DOI] [PMC free article] [PubMed] [Google Scholar]
- Ishii T.; Tatsuda E.; Kumazawa S.; Nakayama T.; Uchida K. Biochemistry 2003, 42, 3474–3480. [DOI] [PubMed] [Google Scholar]
- Dalle-Donne I.; Carini M.; Vistoli G.; Gamberoni L.; Giustarini D.; Colombo R.; Maffei Facino R.; Rossi R.; Milzani A.; Aldini G. Free Radicals Biol. Med. 2007, 42, 583–598. [DOI] [PubMed] [Google Scholar]
- Bennaars-Eiden A.; Higgins L.; Hertzel A. V.; Kapphahn R. J.; Ferrington D. A.; Bernlohr D. A. J. Biol. Chem. 2002, 277, 50693–50702. [DOI] [PubMed] [Google Scholar]
- Connor R. E.; Marnett L. J.; Liebler D. C. Chem. Res. Toxicol. 2011, 24, 1275–1282. [DOI] [PMC free article] [PubMed] [Google Scholar]
- Shi Z.; Wang J.; Zhang B. Nat. Methods 2013, 10, 597–598. [DOI] [PMC free article] [PubMed] [Google Scholar]
- Zhang B.; Shi Z.; Duncan D. T.; Prodduturi N.; Marnett L. J.; Liebler D. C. Mol. Biosyst. 2011, 7, 2118–2127. [DOI] [PMC free article] [PubMed] [Google Scholar]
- Liu Q.; Ullery J.; Zhu J.; Liebler D. C.; Marnett L. J.; Zhang B. Mol. Biosyst. 2013, 9, 3036–3046. [DOI] [PMC free article] [PubMed] [Google Scholar]
- O’Shea J. P.; Chou M. F.; Quader S. A.; Ryan J. K.; Church G. M.; Schwartz D. Nat. Methods 2013, 10, 1211–1212. [DOI] [PubMed] [Google Scholar]
- Van Laer K.; Oliveira M.; Wahni K.; Messens J. Protein Sci. 2014, 23, 238–242. [DOI] [PMC free article] [PubMed] [Google Scholar]
- Fisher A. A.; Labenski M. T.; Malladi S.; Gokhale V.; Bowen M. E.; Milleron R. S.; Bratton S. B.; Monks T. J.; Lau S. S. Biochemistry 2007, 46, 11090–11100. [DOI] [PubMed] [Google Scholar]
- Randall M. J.; Hristova M.; van der Vliet A. FEBS Lett. 2013, 587, 3808–3814. [DOI] [PMC free article] [PubMed] [Google Scholar]
Associated Data
This section collects any data citations, data availability statements, or supplementary materials included in this article.