

Abstract
Objective
Discovery of curative therapies for renal cell carcinoma (RCC) is hampered by lack of authentic preclinical models. Tumorgrafts, generated by direct implantation of patient-derived tissues into mice, have demonstrated superior ability to predict therapeutic response. We evaluated “tissue slice grafts” (TSGs) as an improved tumorgraft model of RCC.
Materials and methods
Cores of fresh RCC were precision-cut at 300 μm and implanted under the renal capsule of RAG2−/− γC−/− mice. Engraftment rate, histology, biomarker expression, genetic fidelity, and metastatic potential were evaluated. Magnetic resonance imaging (MRI) was tested as a noninvasive method to measure tumor volume, and response to a targeted therapy was determined.
Results
All 13 cases of RCC engrafted and displayed characteristic histology and biomarkers. TSG volume quantified noninvasively by MRI highly correlated with graft weights, providing a unique tool for monitoring orthotopic growth. Moreover, in 2 cases, cancer cells from TSGs metastasized to clinically relevant sites, including bone. Microarray analysis and DNA sequencing demonstrated a high degree of correlation of global gene expression and von Hippel-Lindau (VHL) status between TSGs and parental tumors. Treatment of TSGs with sunitinib significantly decreased graft weight and mean vessel density compared with controls.
Conclusion
The TSG model of RCC faithfully recapitulates tumor pathology, gene expression, genetic mutation, and drug response. The high engraftment rate and metastatic potential of this authentic model, in conjunction with the ability to generate large first-generation animal cohorts and to quantitate tumor volume at the orthotopic site by MRI, proffer significant advantages compared with other preclinical platforms.
Keywords: Renal cancer, Tumorgrafts, Metastases
1. Introduction
Realistic preclinical models of renal cell carcinoma (RCC) greatly accelerate the development of new therapeutics and the elucidation of the mechanisms of response and resistance to current therapeutics. Tumorgrafts derived from fresh human tumor tissues, so-called mouse avatars [1], have been shown to possess high predictive power for both patient prognosis and drug response by recapitulating parental tumors both microscopically and molecularly [2-5]. RCC tumorgrafts with genetic and histologic fidelity, metastatic potential, and drug responsiveness have recently been generated successfully by several independent groups [6-8]. However, these investigators all used minced tissues that varied in size, resulting in limited numbers of grafts generated from a single primary tumor specimen with varied growth rates or low engraftment rates or both [6-8]. Moreover, the lack of tracking the exact location in the parental tumor from which each graft is derived makes it impossible to use tumorgrafts derived from adjacent tissues in control and experimental groups to minimize variations in molecular and cellular composition of the grafts due to the intratumoral heterogeneity of RCC [9].
We previously established prostate cancer tumorgrafts from precision-cut tissue slices of 300 μm thickness and 8 mm diameter as opposed to tissue fragments traditionally used for tumorgrafting [10]. These thin tissue slice grafts (TSGs) offer certain capabilities beyond traditional tumor-grafts. The thinness of the grafts permits exchange of gases and nutrients with the host in the initial days following implantation as the vasculature becomes established, contributing to the high engraftment rate of TSGs. Numerous slices can be generated from small tissue specimens, enabling the establishment of large animal cohorts without serial transplantation of the tumorgrafts. It is easy to track the position of each tissue slice in the parental tumor, making it possible to randomize TSGs derived from adjacent tissue slices into control and experimental groups so that the tumor composition is comparable between the two.
In this study, we extended TSG methodology to human RCC. We examined the engraftment rate, histology, immunophenotype, metastatic potential, and genetic fidelity of TSGs derived from 13 fresh RCC tissues. In addition, we established a noninvasive metric for quantifying orthotopically grafted tumors by magnetic resonance imaging (MRI) and assessed the response of TSGs to a known targeted therapeutic, sunitinib [11].
2. Materials and methods
2.1. Tissue acquisition
Fresh RCC tissues were obtained from patients undergoing nephrectomy between September 2011 and May 2012 at Stanford under an institutional review board–approved protocol with informed consent. Frozen sections were utilized to histologically confirm the diagnosis of RCC. Clinicopathologic features of the cases are summarized in Table 1.
Table 1.
Pathologic features and engraftment rates of RCC cases in this study
| Case | Sex | Age | Pathologic stage | Nodal and metastatic stage | Fuhrman grade | Additional pathologic features | TSG engraftment rate (engrafted/total) |
|---|---|---|---|---|---|---|---|
| 1 | F | 64 | T3a | NxMx | III | 90% (25/28) 100% (5/5)a | |
| 2 | F | 33 | T3b | N1Mx | IV | Sarcomatoid | 82% (27/33) 100% (5/5)a |
| 3 | M | 75 | T2a | NxMx | III/IV | Rhabdoid, papillary | 79% (23/29) 100% (3/3)a |
| 4 | F | 76 | T1a | NxMx | II | 100% (12/12) | |
| 5 | F | 91 | T1a | NxMx | III | 100% (5/5) | |
| 6 | M | 62 | T3a | NxMx | III | 100% (10/10) | |
| 7 | M | 68 | T3a | NxMx | Chromophobe | 100% (5/5) | |
| 8 | M | 91 | T3a | NxM1 | III | 100% (10/10) | |
| 9 | M | 61 | T3a | NxMx | II | 100% (3/3) | |
| 10 | F | 83 | T3a | NxMx | II | Sarcomatoid | 100% (3/3) |
| 11 | M | 59 | T1b | NxMx | II | 33% (1/3) | |
| 12b | F | 59 | T3a | NxM1 | IV | Rhabdoid | 66% (19/29) |
| 13 | M | 42 | T3a | NxMx | III | 45% (9/20) |
Secondary TSGs generated from primary TSGs.
Patient received neoadjuvant therapy of 4 cycles of sunitinib (37.5–50 mg/day, 2 wks on and 1 wk off), which was completed 2 weeks prior to surgery.
2.2. Precision-cutting and subrenal implantation of tissue slices
Precision-cutting and subrenal implantation of tissue slices were performed as previously described [10]. All animal work was done in accordance with institutional regulations for laboratory animal studies. RAG2−/−γC−/− mice [12] between 6 and 8 weeks of age were engrafted with RCC tissue slices.
2.3. MRI
A Discovery MR901 7.0-Tesla MRI system (Agilent Technologies, Santa Clara, CA) was used at the Stanford University Small Animal Imaging Facility for in vivo imaging. A custom T2-weighted sequence was developed for abdominal imaging of TSGs in situ on the mouse kidney. Three-dimensional volumetric modeling was then performed with OsiriX 4.1 (Pixmeo, Bernex, Switzerland), and calculated volumes were compared with final gross TSG weights.
2.4. Immunohistochemistry
Immunohistochemistry was performed as previously described [10]. Antigen retrieval was achieved by heating in citrate buffer (pH 6.0) for 20 minutes, followed by a 20-minute cooldown. The sources and dilutions of the antibodies used in this study are listed in Table 2.
Table 2.
Antibodies used in this study
| Name | Source | Dilution |
|---|---|---|
| Anti-cytokeratin 7 (CK7) | Dako Corp., Carpinteria, CA | 1:200 |
| Anti-CAIX | Novus Biologicals, Littleton, CO | 1:200 |
| Anti-CD10 | Leica, Newcastle, UK | 1:100 |
| Anti-CD117 | Dako Corp., Carpinteria, CA | 1:200 |
| Anti-Ku70 | Abcam, Cambridge, MA | 1:200 |
| Anti–human-specific CD31 | Dako Corp., Carpinteria, CA | 1:20 |
| Universal biotinylated horse anti-mouse/rabbit IgG | Vector Laboratories Inc., Burlingame, CA | 1:1000 |
2.5. Gene expression profiling
Microarray hybridization was performed using Illumina Human HT-12 v4 Beadchips (Illumina Inc., San Diego, CA) according to manufacturer’s directions. Raw data were deposited in GEO (GSE44548). Expression data were rank-invariant normalized using BeadStudio software (Illumina Inc.). Average linkage clustering was performed using Cluster software (Eisen Lab, http://rana.lbl.gov/EisenSoftware.htm) and visualized using TreeView (Eisen Lab). Correlation coefficients were calculated using Excel.
2.6. VHL sequencing
DNA was extracted from TSGs preserved in Allprotect tissue reagent (Qiagen, Valencia, CA) using an AllPrep DNA/RNA/Protein Mini Kit (Qiagen) according to manufacturer’s directions. The 3 exons of VHL were selected for polymerase chain reaction amplification and direct sequencing. Primer sequences are listed in Table 3.
Table 3.
Primer sequences used in this study
| Name | Source |
|---|---|
| Exon 1—Forward | CTACGGAGGTCGACTCGGGAG |
| Exon 1—Reverse | GGGCTTCAGACCGTGCTATCG |
| Exon 2—Forward | CCGTGCCCAGCCACCGGTGTG |
| Exon 2—Reverse | GGATAACGTGCCTGACATCAG |
| Exon 3—Forward | CGTTCCTTGTACTGAGACCCTA |
| Exon 3—Reverse | GAACCAGTCCTGTATCTAGATCAAG |
2.7. Targeted therapy
Four weeks after implantation, TSG-bearing mice were randomized to treatment with either 80 mg/kg/day of sunitinib (LC Laboratories, Woburn, MA) dissolved in citrate buffer at pH 6.0 or the vehicle alone by oral gavage 5 days per week. After 4 weeks of treatment, both control and treated mice were killed. TSGs were dissected off from the mouse kidney, weighed, fixed in 10% formalin, and embedded in paraffin for immunohistochemistry.
3. Results
3.1. Tissue slices of RCC engraft with high efficiency in RAG2−/−γC−/− mice
Fresh RCC specimens were obtained from 13 patients after nephrectomy, processed, and implanted in mice as illustrated in the scheme shown in Fig. 1A. Tissue cores that were 8 mm in diameter (Fig. 1B) were taken from areas of cancer and precision-cut using a Krumdieck tissue slicer (Fig. 1C) into 300 μm-thick discs (Fig. 1D) followed by subrenal capsular implantation into 6- to 8-week-old RAG2−/− γC−/− mice. Engrafted TSGs showed good vascularization (Fig. 1E). From each case, 3 to 33 tumor tissue slices were implanted with an overall engraftment rate of 80% (152 of 190, range 33%–100%, Table 1). In addition, we observed a 100% engraftment rate for second-generation TSGs from all 3 cases tested. Overall, these results demonstrated that tissue slices of RCC engrafted with high efficiency in RAG2−/−γC−/− mice.
Fig. 1.
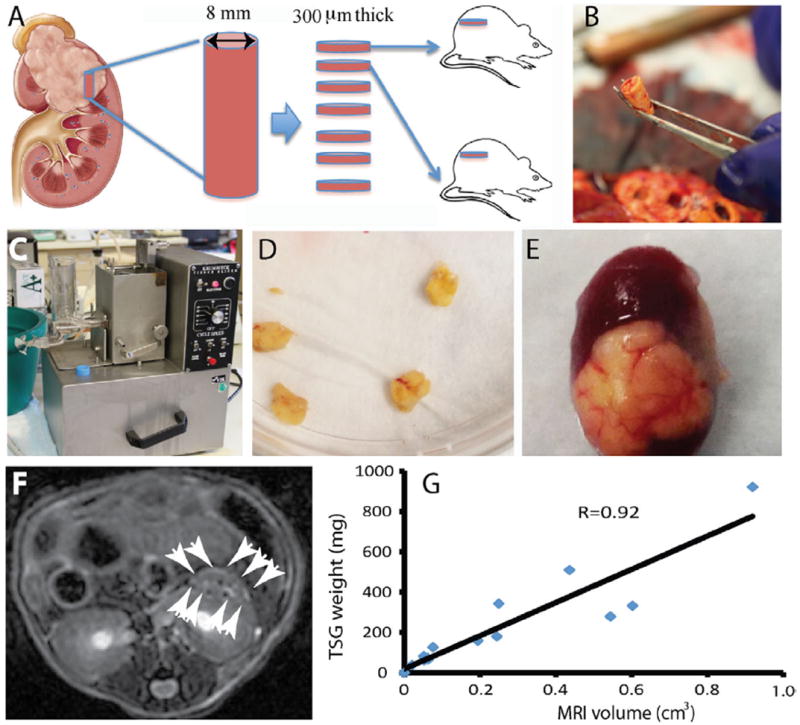
Generation and imaging of TSGs. (A) diagram of TSG generation. (B) a tissue core taken from cancer area of a fresh nephrectomy specimen. (C) Krumdieck tissue slicer. (D) tissue slices precision-cut to 8 mm in diameter and 300 μm in thickness. (E) a representative TSG with good vascularization. (F) a representative MRI image of TSG with white arrows marking the boundary. (G) correlation of tumor volume determined by MRI and graft weight for TSGs derived from case 2. (Color version of the figure is available online.)
3.2. Quantification of TSG volume by MRI
Using a Discovery MR901 7.0-Tesla MRI system and a custom T2-weighted sequence, we imaged a cohort of 18 TSGs from case 2 (Fig. 1F) and calculated tumor volumes using OsiriX 4.1 software. The calculated tumor volumes showed a high degree of correlation with gross graft weights obtained by killing the hosts (Fig. 1G). These results demonstrated that noninvasive quantification of TSG volume could be achieved by MRI.
3.3. TSGs derived from RCC expressed typical markers of RCC subtypes
TSGs maintained in mice for up to 6 months after implantation displayed similar histologic architectures to parental tumors by H&E staining (Fig. 2A–F). Malignant epithelial cells with clear cytoplasm and a nested growth pattern (Fig. 2A and B), an acinar growth pattern (Fig. 2C and D), or solid sheets of large polygonal cells typical of chromophobe RCC (Fig. 2E and F) were observed in case 1 (clear cell RCC), case 3 (clear cell RCC), or case 7 (chromophobe RCC) tumor and its TSGs, respectively. Expression of biomarkers typical of RCC subtypes, including CAIX, CD10, CD117, and CK7 [13], in TSGs was also similar to that in corresponding parental tumors. Specifically, a diffuse membranous CAIX pattern (Fig. 2G–J) and a patchy membranous CD10 pattern (Fig. 2M–P) were observed for both cases 1 and 3 parent tumors and TSGs. Neither the parental tumor nor TSGs from case 1 were positive for CD117 (Fig. 2S–T) or CK7 (Fig. 2Y and Z). Case 3 parental tumor and TSGs were negative for CD117 (Fig. 2U and V) but had isolated papillary elements that were positive for CK7 (Fig. 2AA and AB). As is typical of chromophobe RCC, case 7 was positive for all markers, including CAIX (Fig. 2K and L), CD10 (Fig. 2Q and R), CD117 (Fig. 2W and X), and CK7 (Fig. 2AC and AD). These results demonstrated that TSGs derived from RCC maintained proper histology as well as biomarker expression typical of the tumor subtypes.
Fig. 2.
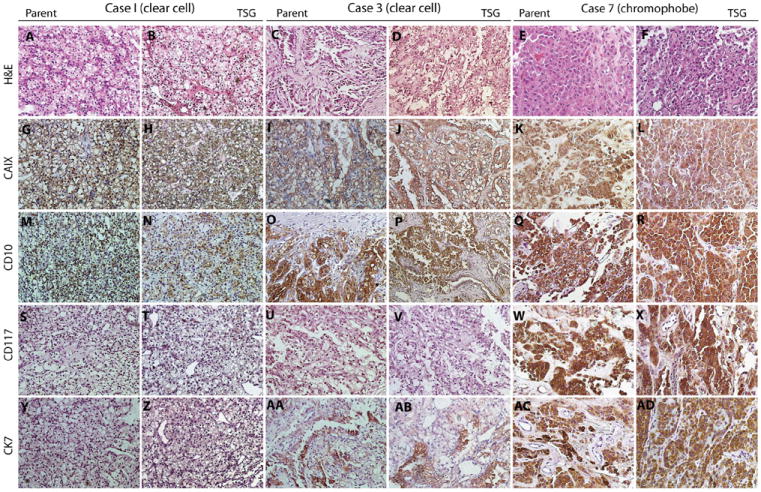
TSGs preserved histologic features and biomarker expression of corresponding parental tumors. A, C, and E are H&E-stained tumor sections from cases 1, 3, and 7, which showed similar histology to the derivative TSGs in B, D, and F, respectively. All 3 cases and their TSGs displayed expression of CAIX (G–L) and CD10 (M–R). Cases 1 and 3 and their TSGs were negative for CD117 (S–V), whereas case 7 and its TSG were positive (W and X). Case 1 and its TSG were negative for CK7 (Y and Z), and cases 3 and 7 and their TSGs were positive (AA–AD). (Color version of the figure is available online.)
3.4. TSGs metastasized to clinically relevant sites
One mouse bearing a first-generation TSG from case 1 was found to have gross lung and liver metastases on autopsy (Fig. 3A and B). Subsequent passages of TSGs from this mouse also developed gross metastases to the lung, liver, and bone (Fig. 3C). These metastases expressed human-specific nuclear antigen Ku70 (Fig. 3D–F) that distinguished them from surrounding host cells and CAIX (Fig. 3G–I) similar to the parental tumor (Fig. 2G). Moreover, 4 of 9 mice bearing second-generation TSGs from case 1 and 1 of 8 mice bearing second-generation TSGs from case 3 had gross metastases at 4 to 12 weeks after engraftment. Interestingly, the case 1 patient subsequently developed metastases to the lung, liver, pancreas, and contralateral kidney after nephrectomy, suggesting TSGs may predict the development of metastatic disease in patients. These results suggest that the TSG model has the capacity to produce metastatic disease from a primary tumor.
Fig. 3.
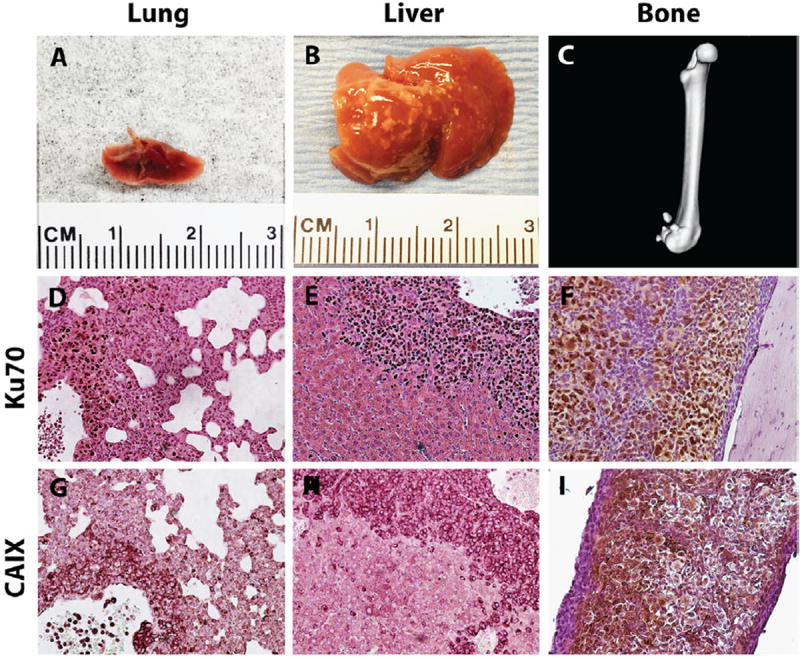
TSGs displayed metastatic potential. Gross metastases were detected in lung, A, liver, B, and bone, C, of mice bearing TSGs derived from case 1. RCC cells were distinguished from host cells at the metastatic sites by intense staining of human-specific nuclear antigen Ku70 (D–F). These cells were also positive for CAIX (G–I). (Color version of the figure is available online.)
3.5. TSGs maintained global gene expression profiles typical of parental tumors
Average linkage clustering analysis demonstrated a perfect grouping of TSGs and parental tumors based on their global gene expression profiles (Fig. 4A). TSGs from cases 9 and 10 clustered with their parental tumors on one main branch, whereas the TSG from case 1 grouped with its parental tumor on the other main branch, suggesting that cases 9 and 10 shared greater similarity in global gene expression than either did with case 1. Interestingly, both cases 9 and 10 were Fuhrman grade II tumors with no metastatic disease observed in TSG-bearing mice, whereas case 1 was a grade III tumor with metastatic disease to multiple sites in both the patient and TSG-bearing mice. The lengths of the dendrogram indicated that gene expression in TSGs from cases 9 and 10 was more similar to that in parental tumors than was the gene expression in the TSG from case 1 to its parental tumor. This is consistent with the correlation coefficients between expression levels of all probes in TSGs and parental tumors (Fig. 4B–D). It is worth noting that the TSGs used in this analysis for cases 9 and 10 were first generation, whereas the TSG from case 1 was third generation, suggesting that serial passage led to subtle changes in global gene expression. Overall, gene expression profiles in TSGs showed a high degree of similarity to those in parental tumors.
Fig. 4.
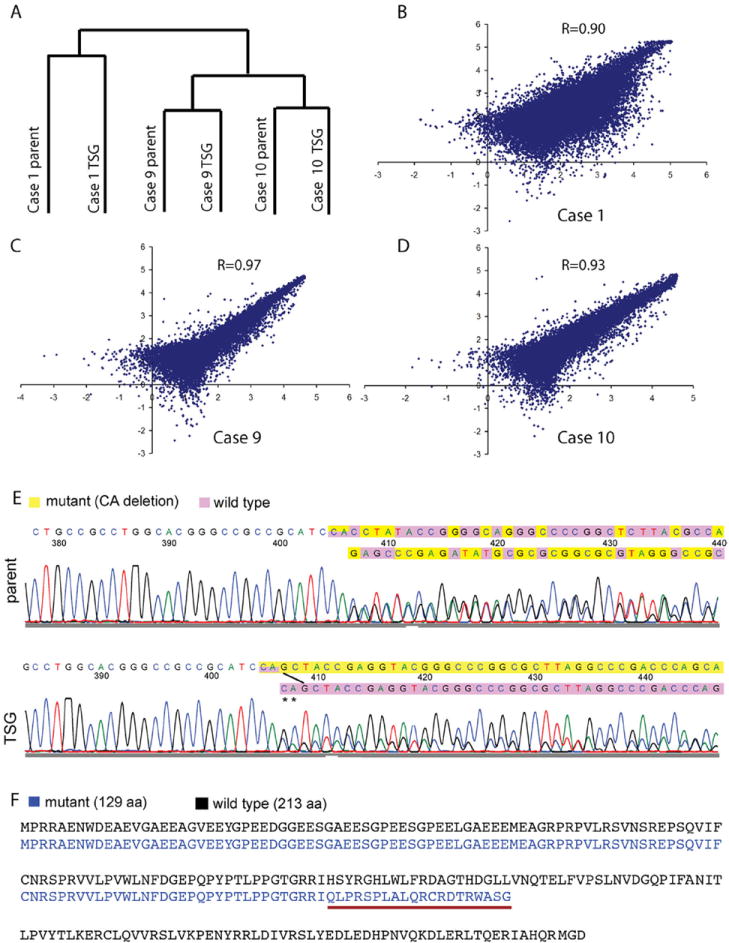
TSGs maintained similar global gene expression and identical genetic mutation of VHL to the parental tumors. (A) dendrogram of average linkage clustering of 3 pairs of TSGs and their corresponding parental tumors. (B–D) scatter plots of gene expression in TSGs and corresponding parental tumors with correlation coefficients. (E) a “CA” deletion in exon 1 was identified in the parental tumor and TSG from case 9. The mutant VHL sequence was shown in yellow and the wild type in purple. The ratio of mutant to wild-type VHL nucleotide signal was increased in the chromatogram from TSG. (F) wild-type VHL protein sequence is in black. Mutant VHL protein sequence in case 9 is in blue. Mutant protein sequence underlined in red after the mutation is different from wild type due to a frameshift. The mutation also caused an early stop resulting in a truncated protein of 129 amino acids compared with the wild-type protein of 213 amino acids. (Color version of the figure is available online.)
3.6. TSGs maintained genetic fidelity to parental tumors
DNA sequencing revealed no mutations in any of the 3 exons of VHL in either TSGs or parental tumors for cases 1 and 10. In contrast, a 2-base pair deletion at positions 328 and 329 in exon 1 of the cDNA (c.328_329delCA) was found in both the TSG and parental tumor for case 9 (Fig. 4E), resulting in a truncated VHL protein (Fig. 4F). Consistent with previous observation by Jones et al. [14], the ratio of mutant to wild-type VHL nucleotide signal was increased in the chromatogram from the TSG, suggesting that cells with mutant VHL perhaps had a growth advantage over RCC cells with wild-type VHL. Alternatively, cells with wild-type VHL in the parental tumor may be stromal cells that were gradually replaced by host stromal cells in the TSGs. These results demonstrated that TSGs maintained not only similar global gene expression profiles to their parental tumors, but also genetic fidelity.
3.7. TSGs demonstrated responsiveness to targeted therapy
Eighteen first-generation TSGs from case 1 were treated for 4 weeks with either sunitinib at a dose of 80 mg/kg/day or control vehicle. Treated TSGs were smaller and less vascularized compared with control upon visual inspection (Fig. 5A and B). Indeed, the treated TSGs had a significantly lower mean final graft weight compared with control (P = 0.05, Fig. 5C). In addition, control TSGs displayed more blood vessels by immunohistochemical staining using an antibody against human-specific CD31 (Fig. 5D), a vascular endothelial marker [15], compared with hollow spaces left in treated TSGs (Fig. 5E), indicating blood vessel damage. The mean density of human CD31-positive vessels in treated TSGs was significantly lower than that in control TSGs (P = 0.001, Fig. 5F), consistent with previous findings that sunitinib inhibits RCC tumor growth by suppressing angiogenesis in humans [11]. These results demonstrated that TSGs responded to an established targeted therapy similarly to human RCC.
Fig. 5.
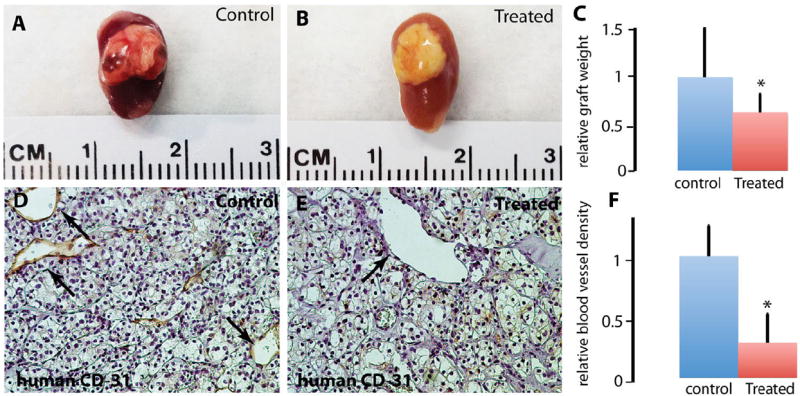
TSGs responded to sunitinib treatment. Control TSGs generated from case 1 showed good vascularization, (A) compared with TSGs treated with sunitinib, (B) Treated TSGs had significantly lower graft weights compared with control TSGs, (C) Blood vessels lined by human endothelial cells were readily observed in control TSGs (arrows in D), whereas empty spaces in the shape of blood vessels were seen in treated TSGs (arrow in E). The mean vessel intensity in 10 high-power fields in control TSGs was significantly higher than that in treated TSGs, (F). (Color version of the figure is available online.)
4. Discussion
Our study is the first to evaluate drug response of orthotopic RCC tumorgrafts. Two previous studies examined drug responses of RCC tumorgrafts using a subcutaneous grafting site [6,7]. Although tumor measurement is easier at this site, the engraftment rate is rather low [6,7]. More importantly, the orthotopic site better mimics the original tumor microenvironment than does the subcutaneous site, which is essential for correctly predicting drug response in humans. The main drawback of using the orthotopic site is the inaccessibility of the tumors for growth quantification. We demonstrated that the volume of the TSGs could be accurately measured noninvasively using MRI, providing an imaging method to monitor TSGs in real time if needed. By addressing this most outstanding issue of tumor volume quantification at the orthotopic site, we have overcome a major obstacle, thus enabling the widespread use of orthotopic TSGs for preclinical drug testing.
One of the most important findings in our study was that TSGs demonstrated metastatic potential to clinically relevant sites, including liver, lung, and bone, providing a realistic model for elucidating the biological basis of RCC metastases and developing curative treatments for metastatic disease. In particular, metastasis of RCC tumorgrafts to bone has not been reported previously. A preclinical model that includes metastases to bone as does the TSG model is in great need because ~30% of patients with RCC who recur following primary therapy would develop bone metastases [16], for which no effective treatment is currently available. A recent study on 76 patients hinted that targeting bone metastases could significantly increase survival of patients with metastatic RCC, although the combination of sunitinib and bone-specific bisphosphonates used in this trial was associated with a high incidence of adverse events [17]. As these metastases are derived from primary RCC in the TSG model, they are likely to mimic the natural history and clinical behaviors of the disease and be highly predictive of drug response of human RCC metastases. Indeed, the case 1 patient developed metastases to the liver and lung within 6 months after surgery as did the TSG-bearing mice. It is yet to be seen whether bone metastases develop in the case 1 patient beyond the current 15-month follow-up period.
A potential application of the TSG model is the design of personalized treatment strategies for individual patients based on drug responses of their derived TSGs in the event of disease progression. Such treatment guided by personalized tumorgrafts has been shown to be highly effective for a number of advanced cancers in a pilot study [5] and has recently become available commercially. However, patients with RCC were not included in that pilot study. In addition, tumors were propagated in mice to generate sufficient numbers of grafts for drug testing, raising the possibility of phenotypic drift owing to serial passage. Use of precision-cut, thin tissue slices would often permit evaluation of drug response in first-generation tumorgrafts rather than later generations because of the ability to establish large numbers of TSGs from small tissue samples. In addition to maintaining genetic and pathologic fidelity between the parental tumors and the TSGs by using first-generation grafts, the time required for an effective treatment to be identified is shortened, which in some cases could be lifesaving. The establishment of large animal cohorts from individual specimens will facilitate comparative effectiveness studies of the many novel agents under development for RCC [18,19].
Acknowledgments
We thank Dr. Benjamin Chung for help on tissue acquisition and clinical guidance.
This study is supported by Instrumentarium Science Foundation, Finland, the Finnish Medical Foundation, the Association Française d’Urologie, and funds from the Department of Urology at Stanford University.
References
- 1.Dennis C. Mouse avatars couldaidpancreaticcancertherapy. Nature News. 2012 doi: 10.1038/nature.2012.10259. Available at. [DOI] [Google Scholar]
- 2.DeRose YS, Wang G, Lin YC, Bernard PS, Buys SS, Ebbert MT, et al. Tumor grafts derived from women with breast cancer authentically reflect tumor pathology, growth, metastasis and disease outcomes. Nat Med. 2011;17:1514–20. doi: 10.1038/nm.2454. [DOI] [PMC free article] [PubMed] [Google Scholar]
- 3.Garber K. Personal mouse colonies give hope for pancreatic cancer patients. J Natl Cancer Inst. 2007;99:105–7. doi: 10.1093/jnci/djk046. [DOI] [PubMed] [Google Scholar]
- 4.Garber K. From human to mouse and back: tumorgraft models surge in popularity. J Natl Cancer Inst. 2009;101:6–8. doi: 10.1093/jnci/djn481. [DOI] [PubMed] [Google Scholar]
- 5.Hidalgo M, Bruckheimer E, Rajeshkumar NV, Garrido-Laguna I, De Oliveira E, Rubio-Viqueira B, et al. A pilot clinical study of treatment guided by personalized tumorgrafts in patients with advanced cancer. Mol Cancer Ther. 2011;10:1311–6. doi: 10.1158/1535-7163.MCT-11-0233. [DOI] [PMC free article] [PubMed] [Google Scholar]
- 6.Karam JA, Zhang XY, Tamboli P, Margulis V, Wang H, Abel EJ, et al. Development and characterization of clinically relevant tumor models from patients with renal cell carcinoma. Eur Urol. 2011;59:619–28. doi: 10.1016/j.eururo.2010.11.043. [DOI] [PubMed] [Google Scholar]
- 7.Sivanand S, Pena-Llopis S, Zhao H, Kucejova B, Spence P, Pavia-Jimenez A, et al. A validated tumorgraft model reveals activity of dovitinib against renal cell carcinoma. Sci Transl Med. 2012;4:137ra75. doi: 10.1126/scitranslmed.3003643. [DOI] [PMC free article] [PubMed] [Google Scholar]
- 8.Grisanzio C, Seeley A, Chang M, Collins M, Di Napoli A, Cheng SC, et al. Orthotopic xenografts of RCC retain histological, immunophenotypic and genetic features of tumours in patients. J Pathol. 2011;225:212–21. doi: 10.1002/path.2929. [DOI] [PMC free article] [PubMed] [Google Scholar]
- 9.Fisher R, Larkin J, Swanton C. Inter and intratumour heterogeneity: a barrier to individualized medical therapy in renal cell carcinoma? Front Oncol. 2012;2:49. doi: 10.3389/fonc.2012.00049. [DOI] [PMC free article] [PubMed] [Google Scholar]
- 10.Zhao H, Nolley R, Chen Z, Peehl DM. Tissue slice grafts: an in vivo model of human prostate androgen signaling. Am J Pathol. 2010;177:229–39. doi: 10.2353/ajpath.2010.090821. [DOI] [PMC free article] [PubMed] [Google Scholar]
- 11.Wood L. Sunitinib malate for the treatment of renal cell carcinoma. Expert Opin Pharmacother. 2012;13:1323–36. doi: 10.1517/14656566.2012.689130. [DOI] [PubMed] [Google Scholar]
- 12.van Rijn RS, Simonetti ER, Hagenbeek A, Hogenes MC, de Weger RA, Canninga-van Dijk MR, et al. A new xenograft model for graft-versus-host disease by intravenous transfer of human peripheral blood mononuclear cells in RAG2−/− gammac−/− double-mutant mice. Blood. 2003;102:2522–31. doi: 10.1182/blood-2002-10-3241. [DOI] [PubMed] [Google Scholar]
- 13.Al-Ahmadie HA, Alden D, Fine SW, Gopalan A, Touijer KA, Russo P, et al. Role of immunohistochemistry in the evaluation of needle core biopsies in adult renal cortical tumors: an ex vivo study. Am J Surg Pathol. 2011;35:949–61. doi: 10.1097/PAS.0b013e31821e25cd. [DOI] [PubMed] [Google Scholar]
- 14.Jones S, Chen W, Parmigiani G, Diehl F, Beerenwinkel N, Antal A, et al. Comparative lesion sequencing provides insights into tumor evolution. Proc Natl Acad Sci. 2008;105:4283–8. doi: 10.1073/pnas.0712345105. [DOI] [PMC free article] [PubMed] [Google Scholar]
- 15.Harraz M, Jiao C, Hanlon HD, Hartley RS, Schatteman GC. CD34-blood-derived human endothelial cell progenitors. Stem Cells. 2001;19:304–12. doi: 10.1634/stemcells.19-4-304. [DOI] [PubMed] [Google Scholar]
- 16.Wood SL, Brown JE. Skeletal metastasis in renal cell carcinoma: current and future management options. Cancer Treat Rev. 2012;38:284–91. doi: 10.1016/j.ctrv.2011.06.011. [DOI] [PubMed] [Google Scholar]
- 17.Beuselinck B, Wolter P, Karadimou A, Elaidi R, Dumez H, Rogiers A, et al. Concomitant oral tyrosine kinase inhibitors and bisphosphonates in advanced renal cell carcinoma with bone metastases. Br J Cancer. 2012;107:1665–71. doi: 10.1038/bjc.2012.385. [DOI] [PMC free article] [PubMed] [Google Scholar]
- 18.Figlin R, Sternberg C, Wood CG. Novel agents and approaches for advanced renal cell carcinoma. J Urol. 2012;188:707–15. doi: 10.1016/j.juro.2012.04.108. [DOI] [PubMed] [Google Scholar]
- 19.Pal SK, Williams S, Josephson DY, Carmichael C, Vogelzang NJ, Quinn DI. Novel therapies for metastatic renal cell carcinoma: efforts to expand beyond the VEGF/mTOR signaling paradigm. Mol Cancer Ther. 2012;11:526–37. doi: 10.1158/1535-7163.MCT-11-0806. [DOI] [PMC free article] [PubMed] [Google Scholar]