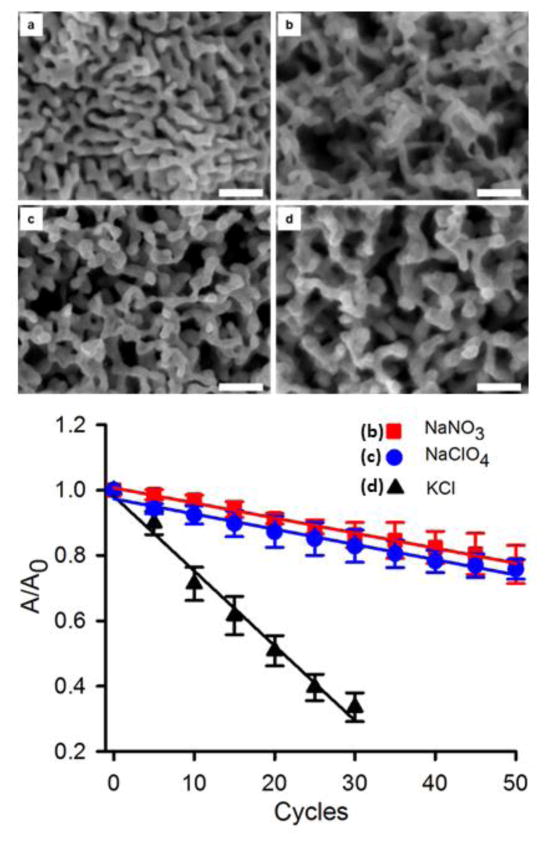
Figure 5.
Scanning electron microscopy images comparing un-annealed and annealed nanoporous gold. a) Initial NPG structure as prepared, b) NPG annealed in 0.1 M NaNO3 for 50 oxidation-reduction cycles c) NPG annealed in 0.1 M NaClO4 for 50 oxidation-reduction cycles d) NPG annealed in 0.1 M KCl for 30 oxidation-reduction cycles. The lower panel shows the surface area reduction upon annealing in the different electrolyte solutions using electrochemical cycling. The value of A0 is 21 ± 2 cm2. The error bars represent the standard deviations for 3 repeat experiments in each case. The scale bar in each frame (a–d) is 200 nm.

