Abstract
OBJECTIVE
To understand: (1) how endoscopic airway measurements compare to three-dimensional (3D) CT derived measurements; (2) where each technique is potentially useful; and (3) where each has limitations.
STUDY DESIGN
Compare airway diameters and cross-sectional areas from endoscopic images and CT derived 3D reconstructions.
METHODS
Videobronchoscopy was performed and recorded on an adult-sized commercially available airway mannequin. At various levels, cross sectional areas were measured from still video frames using a referent placed via the biopsy port. A 3D reconstruction was generated from a high resolution CT of the mannequin, planar sections were cut at similar cross-sectional levels and cross-sectional areas were obtained.
RESULTS
At three levels of mechanically generated tracheal stricture, the differences between the endoscopic measurement and CT derived cross sectional area were 1%, 0%, and 7% (1.8, 0.8, and 14 mm2). At the vocal folds, the difference was 9% (7.8 mm2). The tip of the epiglottis and width of the epiglottis differed by 27% and 10% (18.73 mm2, 0.40mm). The airway measurements at the base of tongue, minimal cross sectional area of the pharynx, and choana differed by 26%, 36%, and 30% (101.40 mm2, 36.67 mm2, 122.71 mm2).
CONCLUSION
Endoscopy is an effective tool for obtaining airway measurements compared with 3D reconstructions derived from CT. Concordance is best in geometrically simple areas where the entire cross-section measured is visible within one field of view (trachea, round; vocal folds, triangular) versus geometrically complex areas that encompass more than one field of view (i.e. pharynx, choana).
Keywords: airway, quantitative bronchoscopy, quantitative endoscopy, 3D CT, airway measurement, airway modeling
INTRODUCTION
Clinical assessment, i.e. history and physical examination, provides useful but limited information regarding the pathological processes causing airway obstruction in infants and children. Of all modalities currently available, direct visualization of the airway via laryngoscopy and bronchoscopy is currently the gold standard to objectively evaluate the exact level, nature, and severity of airway obstruction. CT may also provide information that is useful for localizing and assessing airway obstruction, but is not widely utilized currently in part due to concerns regarding radiation exposure. Recent developments in 3D post-processing of CT scans have enhanced evaluation and management of patients across several surgical disciplines1,2. Specific to the airway, 3D CT reconstructions can provide a framework for computational fluid dynamics of airflow through normal and pathologic airways. Such models could possibly assist surgeons with airway assessment and patient specific medical and surgical planning for patients with airway problems.
Three-dimensional reconstructions of the airway derived from CT scans are not without limitations. CT scan reconstructions cannot capture the dynamic nature of the airway. The need for resolution high enough to capture detailed airway anatomy requires increased radiation exposure. In addition, a CT cannot differentiate well between mucus and the airway wall. This may lead to inaccuracies in airway measurement in planar and reconstructed images. Endoscopy, while able to capture the dynamic nature of the airway and visualize airway wall components clearly, also has limitations for airway measurement. Accurate discernment of airway outline at any given cross-sectional level is challenging, especially when the entire cross section cannot be seen in a single field of view.
There have been several validation studies of quantitative endoscopic measurement of the bronchial tree and the trachea in vivo3–6, and more recent studies have compared quantitative endoscopy and measurements derived from MRI7,8. The resolution of CT scanning is often sufficient to provide useful images at a faster rate than MRI (often obviating the need for sedation or anesthesia), and is much less expensive. Three-dimensional airway reconstructions from CT and quantitative airway endoscopy have different strengths and weaknesses, therefore, a multi-modality approach to airway measurement may currently be the best approach. The aim of the current study was to obtain and compare airway measurements from videobronchoscopy and 3D CT reconstruction at multiple levels of the airway in a static, non-living system in order to help improve methods for measuring the airway in humans.
MATERIALS AND METHODS
Endoscopic Measurements
Flexible videobronchoscopy (Olympus flexible bronchoscope model BFMP160F, Olympus Corporation, Tokyo, Japan) was performed on an adult-sized commercially available airway training mannequin (AirSim Bronchi, Trucorp Ltd., Belfast, N. Ireland) and recorded. Cross-sectional levels of interest were chosen based on the ease of anatomic correlation on endoscopy and CT and included three levels of imposed stricture on the mannequin's trachea created using umbilical tape, the true vocal folds, the tip of the epiglottis, the tongue base, the minimal cross-sectional area of the pharynx, the left choanae, the left nasal valve, and the left pyriform aperture. The mannequin did not have right-sided nasal anatomy. During videobronchoscopy, the endoscope was maintained at the levels of interest and a referent of known size (Biopsy Forceps, Rat Tooth, FB-56D-1, Olympus, Tokyo, Japan) was passed through the biopsy port and into the visual field. The referent was touched against the walls of the airway in the plane at the area of interest to help visualize the airway outline at the appropriate level. The endoscope was panned across the level of interest if the entire region was not visible in one field of view.
Video footage was read into Quicktime Pro 7.0 (Apple, Inc., Cupertino, CA, USA) software and still video frames were captured using Grab 1.5(Apple, Inc., Cupertino, CA, USA) software at the levels of interest in which the airway section was to be measured and the referent was visible. If more than one still video image was needed to visualize the entire section of the airway, the images were brought into Adobe Photoshop CS5 Extended version 12.0 (Adobe Systems Inc., Seattle, WA, USA) and composited together by a professional compositing artist (H.E.C.). The airway was subjectively outlined by the compositor, and relevant areas and diameters were measured using Bersoft Image Measurement Software version 7.25 (Bersoft Software and Technology, First South, Nova Scotia, Canada).
Three-dimensional CT Reconstruction Measurements
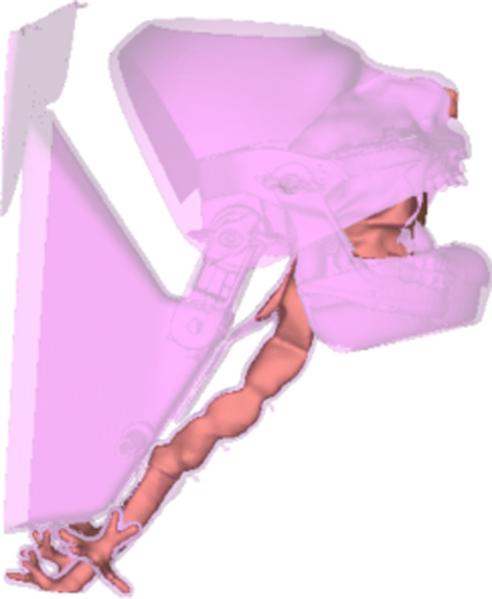
A high-resolution CT scan was made of the same mannequin (axial slice increment, 0.7mm; pixel size, 0.502mm). Three-dimensional reconstruction was generated from high resolution CT using Mimics 14.01 (Materialise, Inc., Plymouth, MI, USA) software (Figure 1).
Figure 1.
3D reconstruction of high resolution CT scan of the commercial training mannequin using Mimics software.
The corresponding airway levels were determined on the 3D model by the same pediatric otolaryngologist who performed the endoscopy. Cross sections were taken at the specified levels of the 3D model and the areas, diameters, and shapes of interest were measured within the Mimics software (Figure 2). The measurements were then numerically compared to endoscopic measurements. The endoscopic measurement was divided by the 3D cross-sectional measurement for each level. The CT derived 3D rendering was chosen as the denominator because the geometry is fixed and not distorted by factors such as camera angle lens distortion and coloration. Percent differences between the two types of measurements were expressed by taking the absolute value of the difference between the ratio of the endoscopic to the 3D CT measurement.
Figure 2.
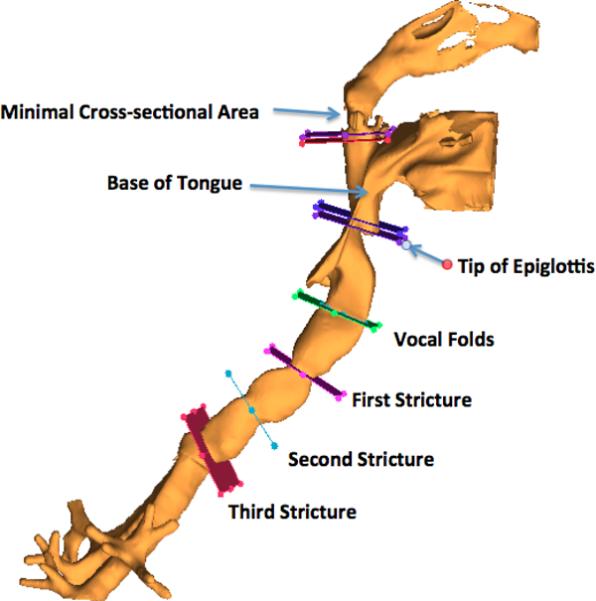
Levels of interest chosen for cross-sectional measurements.
RESULTS
At the three levels of stricture within the trachea, the differences between the endoscopic measurement and the 3D model cross sectional area were 1%, 0%, and 7% (1.8, 0.8, and 14 mm2), respectively (Figures 3–5). At the vocal folds, the difference was 9% (7.8 mm2) (Figure 6). Measuring the complex geometric shape of the airway at the tip of the epiglottis by endoscopy was challenging due to the size of this space precluding visualization of the entire airway level in one field of view, endoscope tip angle distortion, and complex geometry of the pharynx at this level. Attempts to incorporate the entire space in one visual field with the referent included were complicated by endoscopic line-of-site interruption at the tongue base and palate. Therefore, the region between the tip of the epiglottis and the posterior hypopharynx was chosen for the cross-sectional area measurement. The anterior-posterior length of the epiglottis and the cross-sectional area at the tip of the epiglottis differed by 10% and 27% (0.40 mm2, 18.73 mm2), respectively (Figures 7 and 8). Similar issues were encountered at the base of tongue, minimal cross sectional area of the pharynx, and left choana, which differed by 26%, 36%, and 30% (101.40 mm2, 36.67 mm2, 122.71 mm2), (Figures 9–11) respectively. Clinically relevant horizontal and vertical diameters were correlated as well (Table 1).
Figure 3.
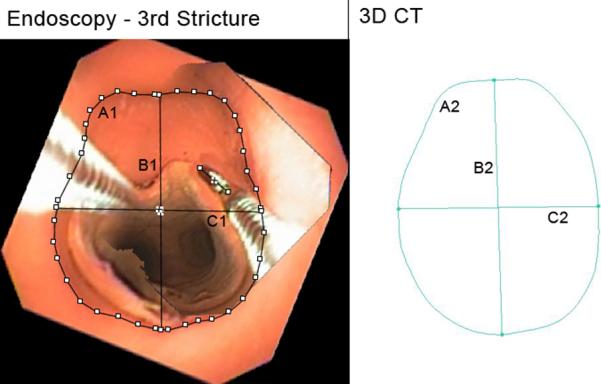
Third Stricture. A1, A2: Cross-sectional area, endoscopic, 3D CT (177.0 mm2, 199.2 mm2). B1, B2: Vertical midline diameter, endoscopic, 3D CT (15.6 mm, 17.3 mm). C1, C2: Horizontal midline diameter, endoscopic, 3D CT (13.6 mm, 13.6 mm). Fields of view = 1.
Figure 5.
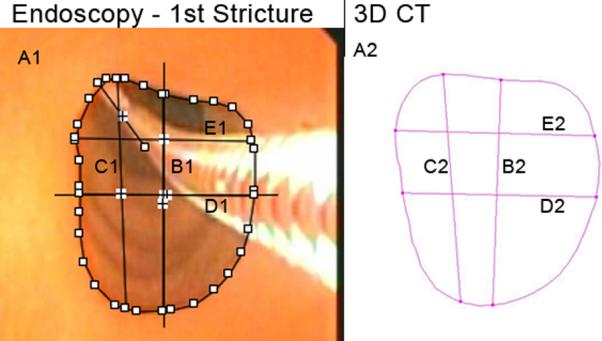
First Stricture. A1, A2: Cross-sectional area, endoscopic, 3D CT (127.8 mm2, 129.6 mm2). B1, B2: Vertical midline diameter, endoscopic, 3D CT (13.3 mm, 13.1 mm). C1, C2: Maximum vertical diameter, endoscopic, 3D CT (14.1 mm, 13.3 mm). D1, D2: Horizontal midline diameter, endoscopic, 3D CT (10.7 mm, 11.3 mm). E1, E2: Maximum horizontal diameter, endoscopic, 3D CT (10.8 mm, 11.6 mm). Fields of view = 1.
Figure 6.
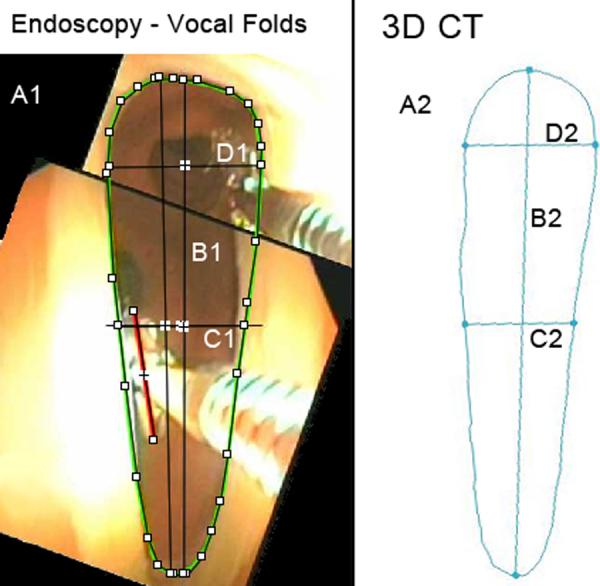
True Vocal Folds. A1, A2: Cross-sectional area, endoscopic, 3D CT (82.0 mm2, 89.8 mm2). B1, B2: Vertical midline diameter, endoscopic, 3D CT (18.8 mm, 21.3 mm). C1, C2: Horizontal midline diameter, endoscopic, 3D CT (4.8 mm, 4.6 mm). D1, D2: Maximum horizontal diameter, endoscopic, 3D CT (5.8 mm, 5.5 mm). Fields of view = 2.
Figure 7.
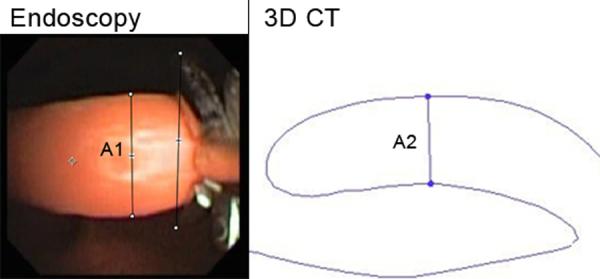
Width of Epiglottis. A1, A2: Width of epiglottis, endoscopic, 3D CT (3.5 mm, 3.9 mm). Fields of view = 1.
Figure 8.
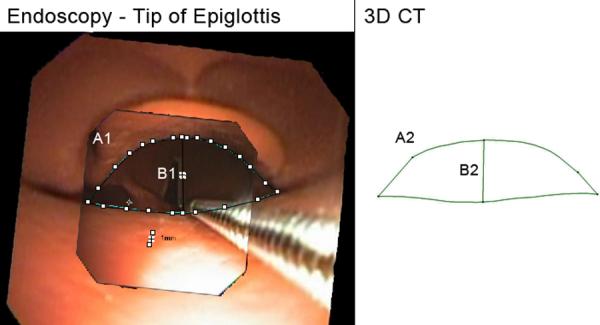
Created region behind the tip of epiglottis. A1, A2: Cross-sectional area, endoscopic, 3D CT (51.2 mm2, 69.9 mm2). B1, B2: distance from middle of epiglottis tip to posterior hypopharynx, endoscopic, 3D CT (5.6 mm, 5.3 mm). Fields of view = 2.
Figure 9.
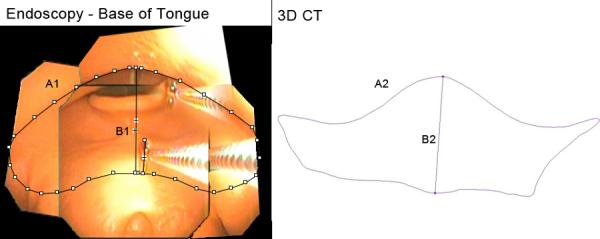
Base of Tongue. A1, A2: Cross-sectional area, endoscopic, 3D CT (489.1 mm2, 387.7 mm2). B1, B2: Vertical midline diameter, endoscopic, 3D CT (15.8 mm, 15.8 mm). Fields of view = 4.
Figure 11.
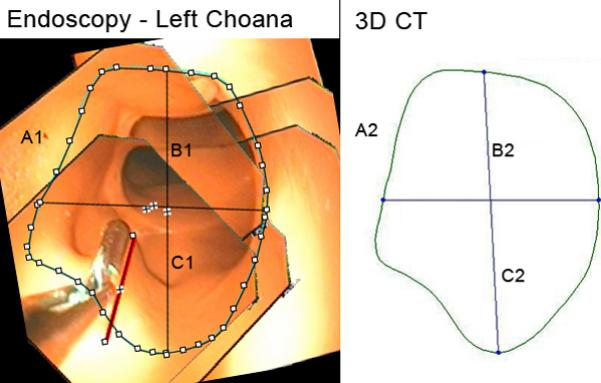
Left Choana. A1, A2: Cross-sectional area, endoscopic, 3D CT (100.9 mm2, 137.6 mm2). B1, B2: Vertical midline diameter, endoscopic, 3D CT (12.9 mm, 15.2 mm). C1, C2: Horizontal midline diameter, endoscopic, 3D CT (10.3 mm, 11.7 mm). Fields of view = 6.
Table 1.
Comparison of endoscopic and 3D CT cross-sectional measurements displayed as individual area measurements for each level and as ratio of endoscopic measurement divided by 3D CT measurement (E/3D).
| Level of Interest | Area Endoscopic (mm2) | Area 3D-CT (mm2) | E/3D ratio | Area Absolute Difference (mm2) | Horizontal Midline (E/3D)) | Vertical Midline (E/3D) | Horizontal Max Distance (E/3D) | Vertical Max Distance (E/3D) | Fields of View Used |
|---|---|---|---|---|---|---|---|---|---|
| 3rd Stricture | 177.0 | 191.2 | 0.93 | −14.1 | 1.01 | 0.90 | n/a | n/a | 1 |
| 2nd Stricture | 205.7 | 204.9 | 1.00 | 0.8 | 1.00 | 1.04 | n/a | n/a | 1 |
| 1st Stricture | 127.8 | 129.6 | 0.99 | −1.8 | 0.95 | 1.01 | 0.93 | 1.06 | 1 |
| Vocal cords | 82.0 | 89.8 | 0.91 | −7.8 | 1.05 | 0.89 | 1.06 | n/a | 2 |
| Width of Epiglottis | n/a | n/a | n/a | n/a | n/a | n/a | 0.90 | 2 | |
| Tip of Epiglottis | 51.2 | 69.9 | 0.73 | −18.7 | n/a | 1.05 | n/a | n/a | 1 |
| Base of Tongue | 489.00 | 387.7 | 1.26 | 101.4 | n/a | 1.00 | n/a | n/a | 4 |
| Minimal Pharyngeal Cross-Sectional Area | 414.10 | 291.4 | 1.42 | 122.7 | n/a | 0.73 | 2.28 | n/a | 7 |
| Left Choana | 100.90 | 137.6 | 0.73 | −36.7 | 0.88 | 0.85 | n/a | n/a | 6 |
n/a = clinically irrelevant or too difficult to assess
AP = Anterior-Posterior
The pyriform aperture was unable to be assessed because the mannequin does not have a bony skeleton corresponding to human anatomy, thus it was too difficult to find the corresponding region in the CT 3D reconstruction to correlate with the endoscopic measurement. The nasal valve was found to be too challenging to measure endoscopically because its complex geometric shape made it difficult to maneuver the endoscope across all its fields of view from a coplanar orthographic viewpoint while incorporating the referent in the field(s) of view. In addition, co-planer anatomy was also difficult to reliably reproduce from 3D geometries generated from CT for this level.
DISCUSSION
Several studies have evaluated endoscopic measurements of the airway, using various image analysis methods, and some comparing them to radiographic imaging. Previous studies have concentrated on isolated regions of the airway in living patients where the entire cross-section is easily obtained in one orthogonal endoscopic field of view3–5,7–9. This study is unique because it aimed to assess all levels of the airway from the pyriform aperture to the lower trachea in a non-living mannequin. This study was created as a proof of principle and method development for a larger study comparing endoscopic airway measurements with measurements derived from 3D reconstructions of CT scans in infants and children. Other major goals were to determine which cross-sectional levels of the airway had the best correlation between endoscopic and 3D CT measurements, where each method is potentially useful, and where each has limitations.
Levels of the airway easiest to measure endoscopically were those that are geometrically simple and small, affording one field of view, which included the referent; examples are the three tracheal strictures (Figures 3–5). This is most likely due to several factors. One, the levels being compared and their plane of measurement could be identified and correlated with greater certainty. Two, when the airway above the region being measured is relatively straight (such as the trachea), the endoscope can be retracted backward linearly, allowing an orthogonal view of the airway geometry and creating a less optically distorted image due to endoscope tip tilt. Thirdly, full view of the region of interest in a single frame with full view of the referent without compositing also inherently decreases error. Not surprisingly, the cross sectional shape obtained from each method was very similar and there was better correlation between endoscopic and 3D CT measurements than at the levels discussed below.
Levels of the airway most difficult to measure endoscopically were those where the entire cross-section of the airway is large or geometrically complex and unable to be contained in one field of view (Figures 6, 9, 10, and 11). At these levels, multiple fields of view were taken of the airway as the endoscope panned across them while attempting to maintain an orthogonal view. Endoscope tip angle distortion of the different still-frames presented a challenge for the compositor to create the entire cross-section with minimal distortion from perspective. Because there is no endoscopic 3D view, the referent has to be touched against the walls circumferentially in a coplanar fashion to mark the outline of the cross-section. If the referent is not at the exact same planar level while touching the different sides of the airway walls, this affects the accuracy of the shape measured as well as the entire image size. This is obviously more difficult in large, geometrically complex areas that are more difficult to outline and capture in a single field of view and which require compositing, which inherently compounds the potential for error.
Figure 10.
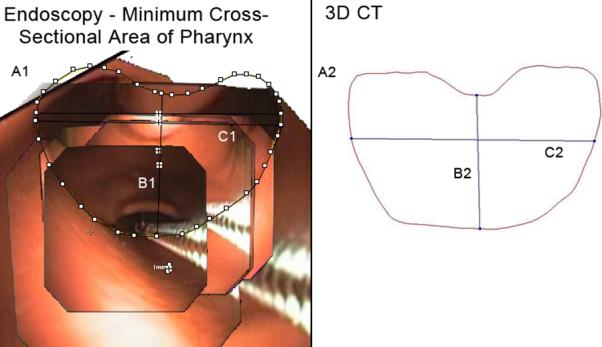
Minimal Cross-Sectional Area of the Pharynx. A1, A2: Cross-sectional area, endoscopic, 3D CT (414.4 mm2, 291.4 mm2). B1, B2: Vertical midline diameter, endoscopic, 3D CT (16.6 mm, 22.8 mm). C1, C2: Maximum horizontal diameter, endoscopic, 3D CT (28.6 mm, 12.6 mm). Fields of view = 7.
Additional difficulties were encountered when endoscopically measuring the minimal cross sectional area of the pharynx (Figure 10). In addition to the problems described above, when the endoscope is retracted far enough proximally to view the entire airway in one field, the curvature of the pharyngeal anatomy blocks the view of the side-walls presenting a “line-of-site “ dilemma where the endoscopic image cannot encompass the entire airway shape and the referent. Viewing it more closely with the endoscope distorts the geometry too much to obtain necessary landmarks to accurately composite an image. It also inherently increases the number of still image fields of view incorporated into a composited image, a process, which, again, most likely increases error in measurement. For regions such as the hypopharynx, larynx, and trachea, direct laryngoscopy, and bronchoscopy elicits a more orthogonal view of the level in question and limits the camera angle distortion inherently present in the flexible bronchoscope. Future studies could compare the accuracy of rigid versus flexible bronchoscopy in such regions.
Some differences in measurements between modalities may be due to correlation of the exact airway location being measured. Levels, which are easily, reproducibly identified endoscopically, and by CT reconstruction, and which lie in a relatively orthogonal plane (such as the created strictures and true vocal folds) are easier to correlate than those that are not (such as the base of tongue and nasal valve area). It is therefore important to choose levels of the airway that have clear anatomic landmarks, which are reproducibly identifiable (such as the vocal folds, choanae, and any obvious stricture) when making comparisons. The creation of a “virtual bronchoscopy” derived from the CT data may help alleviate some of the difficulties encountered in correlation of airway level determined endoscopically versus from CT.
A limitation of this study is that an adult-sized mannequin was utilized and the proportions and sizes of airways measured were larger than that of the pediatric population to be studied. The limitations of CT-scan resolution may be even more significant when measuring airways of small children. This study could be also be further enhanced by utilizing a second observer to measure both the endoscopic and 3D CT cross-section areas and determining the intra-observer reliability.
Finally, in living patients, vocal fold mobility and the dynamic nature of the pharynx add another level of complexity in making relative state dependent comparisons between these different modalities. The use of anatomical optical coherence tomography (aOCT) in the future could provide very meaningful data more quickly and accurately than endoscopic measurements. This technology also accounts for the real-time dynamic nature of the airway, but unfortunately suffers from the same line-of-site issues encountered with quantitative bronchoscopy. A few studies have shown reliability of aOCT measurements in the bronchial tree of pigs, humans, and in a mannequin10, as well as in patients with tracheal stenosis, tracheal tumors, and tracheomalacia11. Additionally, real time or cine-MRI technologies may also help overcome the issues related to imaging the dynamic airway, but resolution, particularly in small, obstructed airways, may be an issue. In addition, cost, specialized protocols, which are not widely utilized, and sedation issues in infants and children with airway obstruction may prove problematic.
CONCLUSION
Endoscopy is an effective tool for obtaining airway measurements that are comparable to 3D reconstructions. Concordance is best where the entire cross-section measured is visible within one endoscopic field of view and in areas that are geometrically simple (trachea, round; and vocal folds, triangular) versus geometrically complex areas that encompass more than one field of view (i.e. pharynx). Correlation between modalities of the exact level of the airway being measured can be challenging. Optimal techniques include selecting levels to measure that have clear anatomical landmarks, minimizing endoscope tip angle distortion, marking the sidewalls of the airway level of interest carefully with a referent, and minimizing the number of fields of view required to visualize the level of interest.
Figure 4.
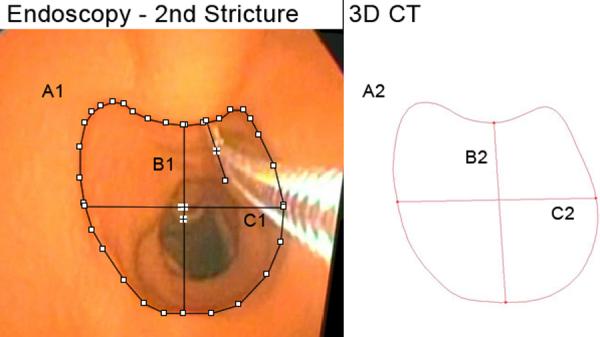
Second Stricture. A1, A2: Cross-sectional area, endoscopic, 3D CT (205.7 mm2, 204.9 mm2). B1, B2: Vertical midline diameter, endoscopic, 3D CT (14.8 mm, 14.2 mm). C1, C2: Horizontal midline diameter, endoscopic, 3D CT (15.6 mm, 15.6 mm). Fields of view = 1.
ACKNOWLEDGEMENTS
We would like to thank Richard Feins, MD for letting us use his training mannequin for this study.
Supported by NIH/NHLBI R01HL105241.
Footnotes
CONFLICTS OF INTEREST: none
FINANCIAL DISCLOSURES: None of the authors have any financial interests or disclosures.
REFERENCES
- 1.Calloway EH, Chhotani AN, Lee YZ, Phillips JD. Three-dimensional computed tomography for evaluation and management of children with complex chest wall anomalies: useful information or just pretty pictures? Journal of Pediatric Surgery. 2011;46(4):640–647. doi: 10.1016/j.jpedsurg.2010.10.013. [DOI] [PMC free article] [PubMed] [Google Scholar]
- 2.Wilbrand J-F, Szczukowski A, Blecher J-C, et al. Objectification of cranial vault correction for craniosynostosis by three-dimensional photography. [Accessed March 3, 2012];Journal of Cranio-Maxillo-Facial Surgery: Official Publication of the European Association for Cranio-Maxillo-Facial Surgery. 2012 doi: 10.1016/j.jcms.2012.01.007. Available at: http://www.ncbi.nlm.nih.gov/pubmed/22364839. [DOI] [PubMed]
- 3.Masters IB, Eastburn MM, Wootton R, et al. A new method for objective identification and measurement of airway lumen in paediatric flexible videobronchoscopy. Thorax. 2005;60(8):652–658. doi: 10.1136/thx.2004.034421. [DOI] [PMC free article] [PubMed] [Google Scholar]
- 4.Czaja P, Soja J, Grzanka P, et al. Assessment of airway caliber in quantitative videobronchoscopy. Respiration. 2007;74(4):432–438. doi: 10.1159/000097993. [DOI] [PubMed] [Google Scholar]
- 5.Dalal PG, Murray D, Feng A, Molter D, McAllister J. Upper airway dimensions in children using rigid video-bronchoscopy and a computer software: description of a measurement technique. Paediatr Anaesth. 2008;18(7):645–653. doi: 10.1111/j.1460-9592.2008.02533.x. [DOI] [PubMed] [Google Scholar]
- 6.Ko M-T, Su C-Y. Computer-assisted quantitative evaluation of obstructive sleep apnea using digitalized endoscopic imaging with Muller maneuver. Laryngoscope. 2008;118(5):909–914. doi: 10.1097/MLG.0b013e3181638187. [DOI] [PubMed] [Google Scholar]
- 7.Hsu PP, Han HNC, Chan YH, et al. Quantitative computer-assisted digital-imaging upper airway analysis for obstructive sleep apnoea. Clin Otolaryngol Allied Sci. 2004;29(5):522–529. doi: 10.1111/j.1365-2273.2004.00849.x. [DOI] [PubMed] [Google Scholar]
- 8.Hsu PP, Tan AKL, Tan BYB, et al. Uvulopalatopharyngoplasty outcome assessment with quantitative computer-assisted videoendoscopic airway analysis. Acta Otolaryngol. 2007;127(1):65–70. doi: 10.1080/00016480600672659. [DOI] [PubMed] [Google Scholar]
- 9.Nouraei SAR, McPartlin DW, Nouraei SM, et al. Objective sizing of upper airway stenosis: a quantitative endoscopic approach. Laryngoscope. 2006;116(1):12–17. doi: 10.1097/01.mlg.0000186657.62474.88. [DOI] [PubMed] [Google Scholar]
- 10.Williamson JP, Armstrong JJ, McLaughlin RA, et al. Measuring airway dimensions during bronchoscopy using anatomical optical coherence tomography. Eur. Respir. J. 2010;35(1)::34–41. doi: 10.1183/09031936.00041809. [DOI] [PubMed] [Google Scholar]
- 11.Williamson JP, McLaughlin RA, Phillips MJ, et al. Using optical coherence tomography to improve diagnostic and therapeutic bronchoscopy. Chest. 2009;136(1):272–276. doi: 10.1378/chest.08-2800. [DOI] [PubMed] [Google Scholar]


