

Fig. 2 is incorrect. The y-axis is incorrectly labeled in Fig. 2G. The authors have provided a corrected version here.
Fig 2. Unusually rapid biodistribution of radiolabeled HRG.
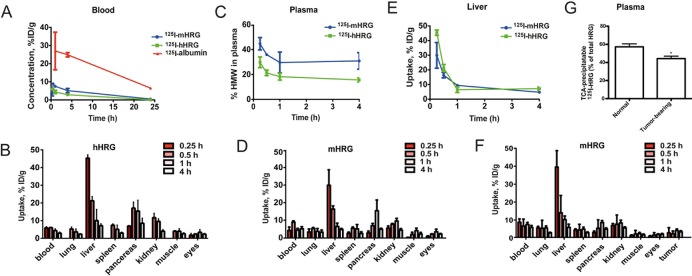
A. Blood kinetics of 125l-albumin, 125l-hHRG and 125l-mHRG in C57BL/6 mice. (n = 4/time point). B. Biodistribution of 125l-hHRG in selected C57BL/6 mouse organs. C. Percentage of radioactivity in blood plasma, associated with a high molecular-weight fraction (>5 kDa). D. Biodistribution of 125l-mHRG in selected organs of naive C57BL/6 mice. E. Liver uptake of 125l-mHRG and 125l-mHRG. F. Biodistribution of 125l-mHRG in selected organs of T241 fibrosarcoma-bearing C57BL/6 mice. G. TCA-precipitable 125l-radioactivity in plasma after 2 h of circulation in naive and tumor-bearing mice injected with 125l-mHRG.
The Fig. 4 legend is incorrect. The third sentence of the Fig. 4 legend should have been omitted. The complete, correct Fig. 4 legend is:
Fig 4. HRG detected by IHC of CRC tumor tissue arrays.

A. Scoring of HRG IHC signals associated with inflammatory cells in CRC arrays from strong to no signal. Statistical analysis; p<0.05 was considered significant. B. Scoring of HRG IHC signals associated with vessels, as above. C. Upper and middle row of panels: Representative images of the HRG IHC signals from the indicated categories at 20× magnification. Lower row of panels: Representative images of the HRC IHC signals in CRC at 60× magnification. Arrows indicate typical vessel-associated HRG signals in normal colorectal tissue (left) and in inflammatory cells in normal tissue (middle) and in stage 2 CRC (right).
Reference
- 1. Tugues S, Roche F, Noguer O, Orlova A, Bhoi S, Padhan N, et al. (2014) Histidine-Rich Glycoprotein Uptake and Turnover Is Mediated by Mononuclear Phagocytes. PLoS ONE 9(9): e107483 doi:10.1371/journal.pone.0107483 [DOI] [PMC free article] [PubMed] [Google Scholar]