

Abstract
Testing of T cell-based cancer therapeutics often involves measuring cancer antigen-specific T-cell populations with the assumption that they arise from in vivo clonal expansion. This analysis, using peptide/MHC tetramers, is often ambiguous.
From a leukemia cell line, we identified a CDK4-derived peptide epitope, UNC-CDK4-1 (ALTPVVVTL) that bound HLA-A*02:01 with high affinity and could induce CD8+ T-cell responses in vitro. We identified UNC-CDK4-1/HLA-A*02:01 tetramer+ populations in 3 of 6 patients with acute myeloid leukemia who had undergone allogeneic stem cell transplant (SCT).
Using tetramer-based, single-cell sorting and T-cell receptor β (TCRβ) sequencing we identified recurrent UNC-CDK4-1 tetramer-associated TCRβ clonotypes in a patient with a UNC-CDK4-1 tetramer+ population, suggesting in vivo T-cell expansion to UNC-CDK4-1. In parallel, we measured the patient's TCRβ repertoire and found it to be highly restricted / oligoclonal. The UNC-CDK4-1 tetramer-associated TCRβ clonotypes represented >17% of the entire TCRβ repertoire – far in excess of the UNC-CDK4-1 tetramer+ frequency, indicating that the recurrent TCRβ clonotypes identified from UNC-CDK-4-1 tetramer+ cells were likely a consequence of the extremely constrained T-cell repertoire in the patient and not in vivo UNC-CDK4-1-driven clonal T-cell expansion.
Mapping recurrent TCRβ clonotype sequences onto TCRβ repertoires can help confirm or refute antigen-specific T-cell expansion in vivo.
Keywords: T-cell repertoire, Single-cell T-cell receptor sequencing, Leukemia antigen, Tetramer analysis, Immune monitoring
Introduction
Part of measuring the efficacy of T cell-based therapies like cancer vaccines, adoptive T-cell therapies, and allogeneic stem cell transplantation (SCT) involves quantifying antigen-specific T-cell responses, which usually is accomplished using peptide/MHC tetramers (1-4). While the enumeration of tetramer+ cells is considered a measurement of antigen-specific T-cell expansion, this assumption may be invalid in the setting of low-frequency, or low affinity responses - as is often the case in the measurement of cancer antigen-specific T-cells.
Antigen-specific T-cell expansion should yield clonal populations with recurrent TCRβ sequences in tetramer+ populations (5). In this report we describe the use of tetramer-based fluorescence activated cell sorting (FACS) to identify recurrent, potentially “antigen-specific” TCRβ CDR3 sequences, i.e. TCRβ clonotypes, which were then mapped onto a patient's TCRβ CDR3 repertoire. By comparing the frequency of tetramer+ cells to the frequency of tetramer-associated TCRβ CDR3 sequences in a patient's CD8+ T-cell repertoire we were able to support in vivo clonal T-cell expansion to a viral antigen (pp65NLV) and refute clonal expansion to a potentially novel leukemia-associated antigen (UNC-CDK4-1, ALTPVVVTL) in an SCT patient despite detection of recurrent UNC-CDK4-1 tetramer-associated TCRβ clonotypes.
Materials and Methods
Detailed descriptions are included in supplementary materials.
Identification of HLA-A*02:01 restricted peptides by HPLC-MS
A lysate of 6×10⁹ HLA-A*02:01-transfected U937 cells (U937.A2) was cleared by ultracentrifugation, and the supernatant passed over a BB7.2-loaded HiTRAP recombinant protein A column. The BB7.2/HLA/peptide complexes were eluted with acetic acid, and the eluate passed through Microcon 3 K filters to yield peptide epitopes (6).
A Hitachi NanoFrontier Nano LC / linear ion trap time-of-flight mass spectrometer was used for online LC-MS/MS experiments. The peptide mixture was injected and subjected to data-dependent acquisition using collision-induced dissociation (CID) for peptide ion activation. MS/MS ion searching was performed using the Mascot search engine, with the no enzyme option and non-identical protein database (NCBInr).
Western blot analysis
Twenty μg each of 3 human AML PBMC lysates, a healthy donor PBMC lysate and a Jurkat cell lysate were electrophoresed on a 4-12% NuPAGE gradient gel and transferred to a PVDF membrane. CDK4 was detected with a primary antibody (Abcam, ab75511) followed by an HRP-conjugated anti-mouse antibody. Bands were visualized using Amersham ECL Western blotting reagents.
iTopia affinity and off-rate assays
Epitope binding was measured using the iTopia Epitope Discovery System. For binding affinity, peptides were incubated in HLA-A*02:01-coated wells overnight, in the presence of the anti-HLA antibody, and fluorescence was read on a Synergy 2 microplate reader with results compared to the binding of the positive control peptide (FLPSDFFPSV, from Hepatitis B core protein) at 10-4 M. The EC50 was determined using GraphPad Prism's nonlinear regression ‘log (agonist) versus response – variable slope (four parameter)’ curve. For the off-rate assay, peptides were incubated in HLA-A*02:01-coated wells at 11 μM overnight, then washed. Fluorescence was read at the times indicated on the graph. The t1/2 was calculated using GraphPad Prism's nonlinear regression, ‘dissociation – one phase exponential decay’ curve.
UNC-CDK4-1-specific cytotoxic T-cell generation
Antigen-specific T cells were generated based on the method of Wölfl and Greenberg with some modifications (7). HLA-A*02:01-expressing monocyte-derived DCs were generated following adherence to plastic and incubation with IL4 10 ng/mL and GM-CSF 800 IU with the addition of 10 ng/mL LPS, 100 IU/mL IFNγ on the fifth day. The DCs were pulsed with 20 μg/mL UNC-CDK4-1 peptide and irradiated at 30 Gy. Naïve CD8+ cells were isolated from the non-adherent fraction by negative selection using Miltenyi MACS beads with subsequent negative selection using anti-CD57 and anti-CD45RO beads. The naïve CD8+ cells and peptide-pulsed DCs were co-incubated at a ratio of 4:1 with IL21 at 30 ng/mL. On day 3 of co-culture IL15 at 5 ng/mL and IL7 at 5 ng/mL were added. Cultures were analyzed on day 11.
CD107 / IFNγ T-cell activation assay
Antigen-specific activity was measured by flow cytometry quantifying CD107 and IFNγ expression described by Betts and colleagues (8). Autologous DCs were pulsed with 20 μg/mL of PR1 (VLQELNVTV) peptide, 20 μg/mL of UNC-CDK4-1, or left unpulsed. As a positive control, non-specific stimulation with phytohemagglutinin (PHA) was also performed. T cells were mixed with DCs at a 1:1 ratio and incubated with PE-labeled anti-CD107a, PE-labeled anti-CD107b and anti-CD28/49d. After 1 hour, the cells were treated with Brefeldin A and monensin. After incubation for an additional 5 hours, cells were washed, permeabilized and fixed. The cells were blocked with IgG and incubated with PerCP-labeled anti-CD8 and FITC-labeled anti-IFNγ. After 30 minutes the cells were analyzed by flow cytometry.
Tetramer flow cytometry
PBMCs (5×10⁵ to 1×10⁶) from cryopreserved post-SCT AML patients were incubated in DPBS with Pacific Blue-conjugated CD4, CD14 CD16 and CD19 (lineage) antibodies, FITC-conjugated CD8 antibody, and PE-UNC-CDK4-1/HLA-A*02:01 tetramer at 4°C for 25 minutes. Live/Dead Fixable Far Red Stain was added and cells were incubated for 5 minutes at 4°C. Samples were washed and analyzed on a MACSQuant flow cytometer. Tetramer-positive cells were enumerated in the live (far red negative), lymphocyte (FSC/SSC), “lineage” (Pacific Blue) negative, CD8 (FITC) positive gate (9-11). A negative tetramer and/or a fluorescence minus one (FMO) sample was used to set the tetramer gate.
FACS Tetramer analysis and single-cell sorting
PBMCs from Patient 5 were stained with CD8-Pacific Orange along with PE-HLA-A*02:01 tetramers generated with CMV-pp65NLV (NLVPMVATV), UNC-CDK4-1, and negative control peptides. For single-cell sorting, sort gates were determined by setting the CD8+ Tetramer+ gate so that it included no cells in the negative tetramer sample. Tetramer+CD8+ T cells were sorted by an iCyt Reflection high-speed sorter at 1 cell/well into a 96-well PCR plate each well containing 4 μL buffer (0.5× PBS, 10 mM DTT, and 8 U RNaseOUT) (12). The same method was used for single-cell CD8+ sorting except no tetramers were used.
Single-cell PCR and sequencing
RT-PCR amplification and sequencing of TCRβ clonotypes was performed using multiplex primers (Supplementary Table 1) and nested PCR covering all human TCRβ variable region genes and the β-chain constant region (12). PCR products were treated with Exonuclease I and shrimp alkaline phosphatase and sequenced by the UNC Genome Analysis Facility. TCRβ sequence identifications were made using the SoDA software tool (13). Tetramer-PE fluorescence vs. CD8-Pacific Orange fluorescence values were plotted for each T-cell's TCRβ clonotype using an R script.
Bulk TCRβ repertoire sequencing
PBMCs were isolated from a second sample from Patient 5 obtained 2 months after the initial sample. Bulk CD8+ T cells were sorted, and RNA was extracted from 3×10⁶ CD8+ T cells using the RNEasy kit. The TCRβ repertoire was amplified using a RT-PCR protocol and the iRepertoire multiplex primer set (14). The sequencing library was run using 2×100 paired-end chemistry on an Illumina HiSeq 2000 sequencer in the UNC High Throughput Sequencing Facility.
High-throughput sequencing data analysis
Sequence data were processed using Python and R scripts developed in the lab. Paired-end reads were analyzed for the presence of the conserved invariant cysteine and FGXG motifs that define the CDR3 region in one reading frame. Sequences that did not exhibit this motif, had stop codons in the motif reading frame, or were present at less than three copies in the dataset were excluded. Vβ and Jβ gene identifications were made by either exact alignment or the highest-scoring Smith-Waterman alignment to the germline reference gene sequences annotated in IMGT (http://www.imgt.org/IMGTrepertoire) (15, 16).
Results
In vitro analysis of the UNC-CDK4-1 antigen
By HPLC-tandem MS we identified 34 candidate leukemia-associated antigens (LAA) from U937.A2 cells (Supplementary Table 2) and focused on the CDK4-derived peptide ALTPVVVTL (Figure 1A) because CDK4 is a therapeutic target in leukemia (17-19). Western blotting confirmed CDK4 overexpression in human AML but not in normal PBMCs (Figure 1B). Using the iTopia assay, we measured an equilibrium EC50 of 2.4 μM for UNC-CDK4-1 and a dissociation t1/2 > 8 hr, the longest time point in the assay, (Figure 1C, 1D).
Figure 1. In vitro characterization of UNC-CDK4-1.
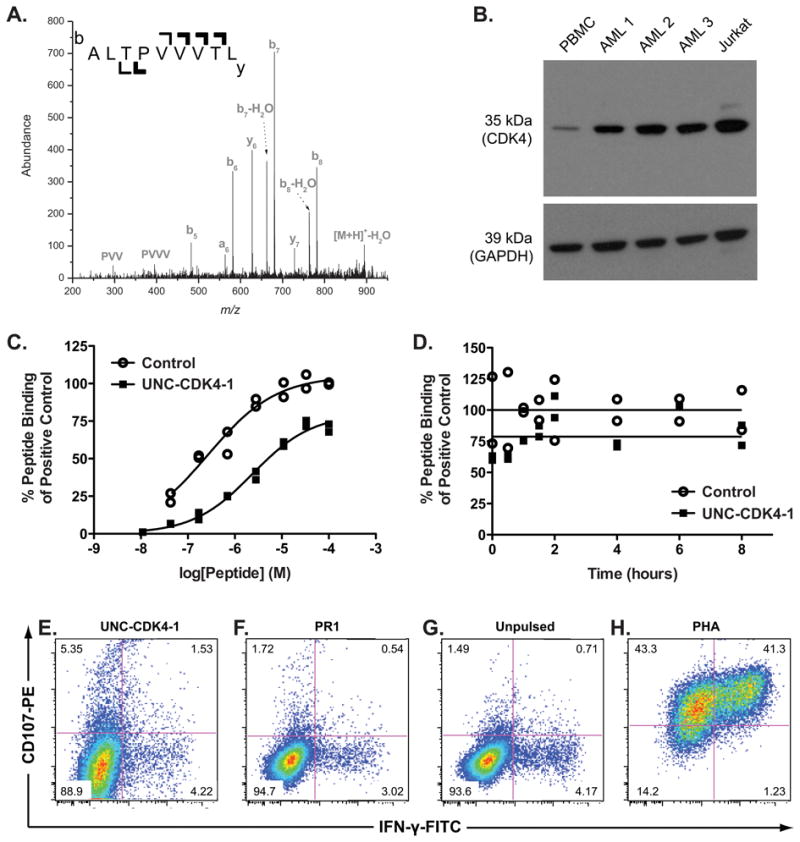
(A) The tandem mass spectrum from the UNC-CDK4-1 peptide that was eluted from HLA-A*02:01-transfected U937 cells is shown. The singly charged peptide [M+H]+-H2O = 894.56 was identified. The b-ion series and y-ions, where b and y refer to N-terminal and C-terminal product ions respectively via peptide ion fragmentation nomenclature, uniquely matched to the CDK4 protein. (B) Western blot of CDK4 in whole-cell lysates from a healthy donor's PBMCs, 3 human AML samples, and the Jurkat cell line (positive control) are shown. CDK4 expression is significantly higher in all AML samples compared to that in healthy-donor PBMCs. (C) The concentrations to generate peptide/HLA complexes for UNC-CDK4-1 and control peptide (FLPSDFFPSV) with HLA-A*02:01 are shown. The EC50 of UNC-CDK4-1 binding to HLA-A*02:01 was measured using the iTopia assay and found to be 2.4 μM. (D) Complexes of UNC-CDK4-1/HLA-A*02:01 or FLPSDFFPSV/HLA-A*02:01 were assembled in multiple wells on the iTopia plates and non-bound peptide was washed away. At the given time points, the amount of peptide/HLA complex was measured and compared to the amount of peptide/HLA complex at t=0. The dissociation t1/2 of UNC-CDK4-1 from HLA-A*02:01, measured using the iTopia assay, is > 8 hr. Healthy donor T cells that had been co-cultured with UNC-CDL4-1-pulsed autologous DCs were tested for specific activity by measuring CD107 and IFNγ expression when stimulated by (E) autologous DCs pulsed with UNC-CDK4-1, (F) autologous DCs pulsed with PR1 antigen, (G) unpulsed autologous DCs. (H) non-specific stimulation with PHA as a positive control.
Using UNC-CDK4-1-pulsed autologous dendritic cells as stimulators we generated a T-cell product that showed antigen-specific killing against UNC-CDK4-1 (Figure 1E-H), and in experiments using UNC-CDK4-1-pulsed T2 cells as stimulators, we generated a T-cell population with 0.2% of CD8+ cells specific for UNC-CDK4-1 (Supplementary Figure 1).
Measurements of UNC-CDK4-1 T-cell responses in post-SCT patients
PE-UNC-CDK4-1/HLA-A*02:01 tetramers were used to probe for UNC-CDK4-1-specific T-cell responses in 6 HLA-A*02:01-expressing, post-SCT, AML patients (Table 1). Based on in vitro expansion experiments, we set a threshold for a tetramer+ population of >0.01% as possibly representing a UNC-CDK4-1-specific T-cell response. We observed UNC-CDK4-1/HLA-A*02:01 tetramer frequencies of >0.01% of CD8+ cells in 3 of the 6 patients (Figure 2A-F, Supplementary Figure 2), but all frequencies were low, raising the possibility that the identified cells did not represent a true antigen-specific response.
Table 1.
Patient Characteristics.
| Patient | Age | Gender | Disease | Collection day post-SCT | Absolute lymphocyte count (×109/L) | GVHD at collection | Systemic steroids at collection | GVHD prior to collection | Status |
|---|---|---|---|---|---|---|---|---|---|
| 1 | 57 | M | MDS / AML | +83 | 0.6 | No | No | No | Alive (censored at day +1,085) |
| 2 | 64 | M | FLT3-ITD mutated AML | +164 | 0.7 | Yes | Prednisone 2.5 mg daily | Acute grade II skin | Died of AML relapse at day +338 |
| 3 | 60 | F | Relapsed AML | +368 | 0.9 | Yes | No | Acute grade II skin Extensive chronic ocular, oral | Alive (censored at day +1,907) |
| 4 | 60 | F | Relapsed AML | +481 | 2.6 | Yes | Prednisone 2.5 mg daily | Acute grade II skin Extensive chronic ocular, oral, cutaneous | Died of AML relapse at day +1,042 |
| 5 | 47 | M | MF / AML | +567 | 5.7 | No | No | Acute grade II skin | Alive (censored at day +1,446) |
| 6 | 55 | F | Treatment related AML | +569 | 1.2 | No | No | No | Alive (censored at day +2,045) |
Six HLA-A*02:01-expressing AML patients underwent allogeneic SCT at the North Carolina Cancer Hospital. Post-SCT samples were obtained at the post-SCT day of collection shown in column 5, and the absolute lymphocyte count at the time of collection is recorded in column 6. The presence of GVHD at the time of collection is listed in column 7, and systemic steroid use at the time of collection is shown in column 8. GVHD prior to sample collection is shown in column 9, and the long-term status of all 6 patients is shown in column 10.
Figure 2. UNC-CDK4-1-specific CD8+ cells are expanded in AML patients post-SCT.
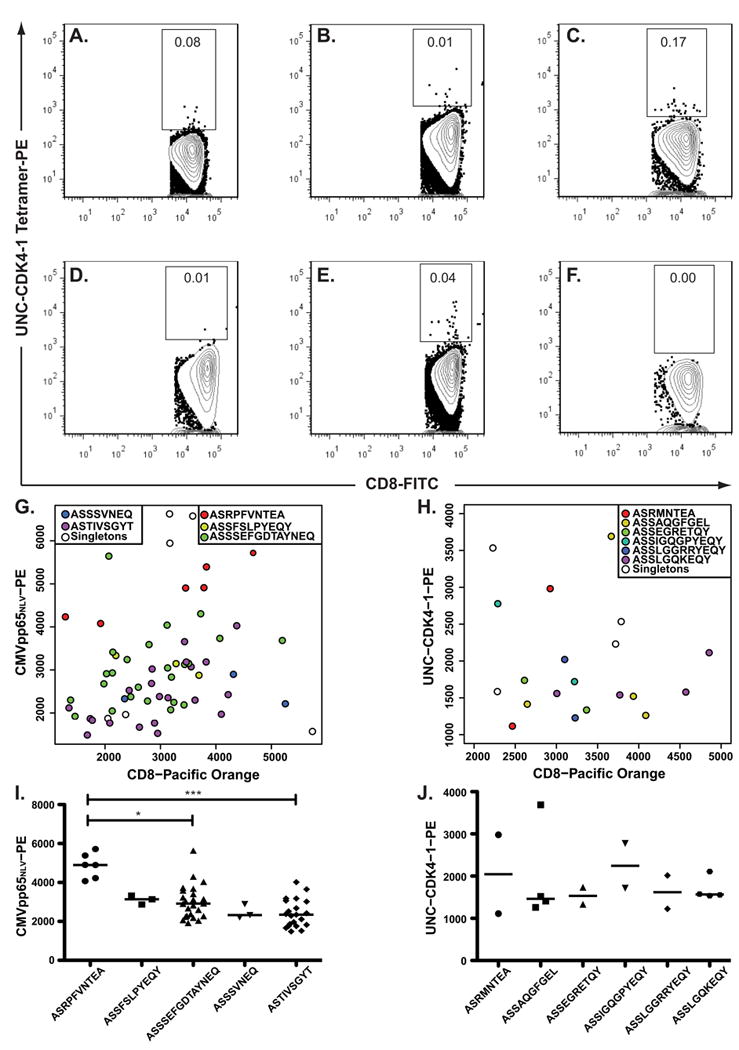
(A-F) 6 HLA-A*02:01-expressing AML patients who underwent SCT were evaluated for expanded populations of UNC-CDK4-1-specific CD8+ cells using UNC-CDK4-1 peptide-loaded tetramers. Because of the prior tissue culture studies, a tetramer+ value of > 0.01% was considered suggestive of an expanded UNC-CDK4-1-specific T-cell response. CD8+ cells from Patient 5 (2E) that were reactive to either pp65NLV or UNC-CDK4-1 tetramers were individually sorted into wells of a 96-well plate, and their TCRβ V-CDR3-J sequences (i.e. clonotypes) were determined using RT-PCR followed by Sanger sequencing. The TCRβ clonotype sequence from each well was indexed back to the fluorescence measurements obtained during the sort. The recurrent TCRβ clonotypes reactive to (G) pp65NLV or (H) UNC-CDK4-1 are shown as color-coded circles on the fluorescence graphs, and cells that have a unique TCRβ clonotype are shown as unfilled circles. Comparisons of tetramer affinity among clonotypes were performed using an unpaired student t-test. (I) Clonotype ASRPFVNTEAF had significantly higher apparent avidity than the 2 most prevalent other pp65NLV clonotypes (* P<0.05, *** P<0.01). Comparisons to the other pp65NLV-reactive clonotypes could not be made because of low cell numbers. (J) No significant differences in tetramer affinity were measured in the UNC-CDK4-1 tetramer-associated clonotypes.
Antigen-specific T-cell responses generate clonally expanded T-cell populations with the same TCRβ clonotypes (5). We performed tetramer-based single-cell sorting with TCRβ CDR3 sequencing on a PBMC sample from Patient 5 (Figure 2E) using tetramers specific to UNC-CDK4-1 or the CMV pp65NLV epitope. The patient and donor were CMV seropositive pre-SCT. The patient had developed CMV viremia 2 months post-SCT, but he was not viremic at the time of this sample collection. There were 5 recurrent TCRβ clonotypes in the pp65NLV-tetramer+ sorted cells and 6 recurrent TCRβ clonotypes in the UNC-CDK4-1-tetramer+ cells (Figure 2G-J, Supplementary Table 3). The cells in each recurrent clonotype had the same nucleic acid and amino acid CDR3 sequence. For the pp65NLV tetramer+ cells the TCRβ clonotype containing epitope ASRPFVNTEA had significantly higher tetramer affinity compared to the next 2 most prevalent pp65NLV-specific TCRβ clonotypes (Figure 2I); however, no UNC-CDK4-1-specific TCRβ clonotype showed a statistically significant higher affinity (Figure 2J).
Tetramer-associated TCRβ clonotypes map to the TCRβ repertoire at different frequencies
Using a 2-month subsequent sample from Patient 5, we measured the frequency of the tetramer-associated TCRβ clonotypes (Figure 2G-J) in the patient's CD8+ TCRβ repertoire. After removing sequences supported by ≤ 2 reads as possible sources of PCR or sequencing errors, our TCRβ repertoire contained 1.02×10⁸ reads with 9.5×10⁷ yielding functional TCRβ sequences. The frequency of different Vβ and Jβ combinations varied greatly (Figure 3A). Furthermore, the diversity of CDR3 region amino acid lengths (analogous to TCRβ spectratyping) showed a non-parametric distribution suggesting a highly constrained/oligoclonal TCRβ repertoire (Figure 3B, Supplementary Table 4) (20-22).
Figure 3. Antigen-specific TCRβ clonotypes map to the TCRβ repertoire at markedly different frequencies.

3×10⁶ CD8+ cells obtained from Patient 5 two months after the initial analytical tetramer study were analyzed for Vβ-Jβ distribution using the Illumina Hiseq platform. (A) The distribution of Vβ-Jβ combinations from the patient is shown. Vβ and Jβ families that were used in the antigen-specific TCRβ clonotypes are shown in blue (UNC-CDK4-1-associated), red (pp65NLV-associated) or green (used in both antigen responses). (B) The reads that yielded functional TCRβ CDR3 regions were arranged by predicted CDR3 amino acid length (starting from the amino acid immediately following the N-terminal invariant cysteine and ending immediately before the C-terminal invariant phenylalanine). The TCRβ CDR3 repertoire was highly restricted with 78.99% of CR3 regions being either 10 or 11 amino acids in length. (C) The 5,043 determined TCRβ clonotypes are ranked by decreasing clonotype frequency from left to right in the graph. 9 of the 11 TCRβ clonotypes associated with either the pp65NLV or UNC-CDK4-1 tetramer (Figure 2, Supplementary Table 4) are mapped onto the graph. Three of the 5 pp65NLV tetramer-associated TCRβ clonotypes (denoted in red) mapped to the TCRβ repertoire with a frequency of 0.002% of the repertoire. In contrast, the 6 UNC-CDK4-1 tetramer-associated TCRβ clonotypes (denoted in blue) represented 17.1% of the TCRβ repertoire. (D) A 6-month follow-up sample from Patient 5 was analyzed using single-cell sorting of CD8+ cells and TCRβ V-CDR3-J sequencing. All 6 UNC-CDK4-1 tetramer-associated TCRβ clonotypes were identified at high frequencies in the 89 cells whose TCRβ clonotype was determined. (E) The ratio of the frequencies of the TCRβ clonotypes measured by single-cell tetramer sorting and bulk TCRβ repertoire analysis are shown. UNC-CDK4-1-associated clonotypes are shown in blue, and pp65NLV-associated clonotypes are shown in red. The bulk repertoire frequencies for pp65NLV-associated clonotypes ASSFSLPYEQY and ASSSVNEQ that were not identified in the repertoire analysis were assigned the minimal frequency in the repertoire of 3.16×10⁻⁸, the frequency of 1 copy in the repertoire. There was a statistically significant difference in the enrichment of pp65NLV–associated (red) clonotypes in their tetramer+ gate compared to enrichment in the tetramer+ gate for the UNC-CDK4-1-associated clonotypes (blue) (t-test, p < 0.0001).
We graphed the 5,043 unique clonotypes according to their frequency in the dataset. The clonotype frequencies varied from 1 clonotype (V6-5_J1-1_ASWTGEGNTEA) representing 0.28 (28%) of the repertoire to 1,346 unique clonotypes each having the minimum clonotype frequency (supported by 3 reads in the repertoire) of 3.16×10⁻⁸. All 6 UNC-CDK4-1 tetramer+ associated TCRβ clonotypes were present at unexpectedly high frequencies from 0.038% to 12%, while the three pp65NLV tetramer+ associated TCRβ clonotypes identified in the repertoire were present at between 0.00011% to 0.0016% (Figure 3C). To test for amplification bias in the repertoire analysis we obtained another sample from Patient 5, 6 months after the sample used for repertoire analysis, and performed single-cell sorting of CD8+ cells with TCRβ CDR3 sequencing. From 95 sorted CD8+ cells we obtained 86 TCRβ CDR3 sequences. All 6 recurrent UNC-CDK4-1 tetramer+ associated clonotypes were again present at extremely high frequencies (Figure 3D). By comparing frequency of the UNC-CDK4-1 and pp65NLV-associated TCRβ clonotypes in their respective tetramer+ gates (Figures 2G and 2H) to their frequencies in the repertoire (Figure 3C) we measured an enrichment ratio for each clonotype, i.e. clonotype frequency in tetramer+ gate / clonotype frequency in bulk repertoire (Figure 3E). The mean enrichment ratio for the pp65NLV-associated clonotypes was 7.63×10⁵, while the mean enrichment for the UNC-CDK4-1 was only 1.04×101.
Discussion
Peptide/MHC tetramers are often used to measure antigen-specific T-cell responses in vivo; however, the data they provide can be ambiguous. As part of an antigen discovery project, we identified UNC-CDK4-1 as a potential LAA. CDK4 is overexpressed in AML, the UNC-CDK4-1 epitope has high affinity to HLA-A*02:01 (23), and tolerance to UNC-CDK4-1 can be broken. Based on these in vitro data, we tested for UNC-CDK4-1 responses in vivo.
Using UNC-CDK4-1/HLA-A*02:01 tetramers we identified tetramer+ T cells at a frequency of > 0.01%, higher than our sensitivity cut-off, in 3 of 6 post-SCT AML patients. The tetramer results were ambiguous because of the low number of tetramer+ cells and many of the gated CD8+ T cells had low affinity for the tetramer. To address this ambiguity, we performed tetramer-based single-cell sorting and TCRβ CDR3 sequencing to test for recurrent TCRβ clonotypes (5).
We isolated UNC-CDK4-1 and pp65NLV tetramer+ T cells from Patient 5 and identified tetramer-associated recurrent TCRβ clonotypes. While recurrent TCRβ clonotypes identified in a tetramer-defined population typically confirms the discovery of antigen-specific T-cell clonal populations (5), our repertoire mapping studies show that this is not the case in all situations.
Tetramer analysis of Patient 5's T cells identified a rare T-cell population (0.04%) recognizing UNC-CDK4-1; however, the recurrent UNC-CDK4-1-associated TCRβ clonotypes represented ∼15% of the patient's CD8+ repertoire. In contrast, the patient had a T-cell population (0.07%, Supplementary Figure 2) recognizing the pp65NLV antigen and the recurrent pp65NLV-associated TCRβ clonotypes only represented 0.002% of the patient's TCRβ repertoire. The low frequency of pp65NLV tetramer+ cells are consistent with antigen-specific memory T cells in a CMV-exposed but not viremic subject, like this patient. While the differences in clonotype frequency measured by tetramer compared to TCRβ repertoire analysis for pp65NLV-associated clonotypes could be explained by the 2 month difference in sample collection dates, tetramer gating and TCR repertoire sampling, it is unlikely that these factors explain the vast differences observed in the UNC-CDK4-1-associated clonotypes. By measuring the frequency of TCRβ clonotypes in a tetramer+ sample and in the bulk T-cell repertoire, we demonstrated that the pp65NLV-associated clonotypes were highly enriched in their tetramer+ gate, while the UNC-CDK4-1-associated clonotypes were not – suggesting that the recurrent UNC-CDK4-1-associated clonotypes are not antigen-specific whereas the pp65NLV associated clonotypes are antigen-specific (Figure 3E).
Overexpression of TCRs in some cells or preferential amplification of specific TCRβ CDR3 regions could affect TCRβ repertoire analysis. However, the primers used in the TCRβ CDR3 repertoire analysis minimize amplification bias (14), and our single-cell CD8+ TCRβ CDR3 sequencing reports the TCRβ clonotype for individual cells. Because the frequencies between the repertoire and CD8+ single-cell analysis are so similar (Figure 3C-D) the highly restricted repertoire observed is likely an accurate representation of Patient 5's T-cell repertoire.
Our study did not analyze TCRα sequences, and while it is conceivable that the highly prevalent TCRβ sequences found in Patient 5 could be paired with multiple different TCRα sequences this phenomenon is unlikely given the mechanism behind TCR assembly and has not, to our knowledge, been described (5, 24, 25).
In this patient's highly restricted (i.e. oligoclonal) T-cell repertoire, which is common in patients following SCT (21, 22), the majority of T cells identified in the UNC-CDK4-1 tetramer+ gate are derived from the expanded pools of T cells that are not antigen-specific. Tetramer-based TCRβ clonotype analysis in a highly restricted T-cell repertoire can lead to clonotypically identical T cells stochastically being captured in a tetramer+ gate and misinterpreted as antigen-specific. This potential error can be addressed by TCRβ repertoire mapping.
Supplementary Material
Acknowledgements and Authorship
S.A.H. designed and conducted experiments and edited the manuscript. C.M. designed and conducted experiments. B.G.V. designed and conducted experiments and edited the manuscript. A.A.E. designed and conducted experiments. J.P.W. designed and conducted experiments. L.M.B. designed and conducted experiments. K.P.M. designed and conducted experiments. P.A.R. designed and conducted experiments. J.M.C, W.A.W, D.A.G, S.S and T.C.S enrolled patients for analysis. J.S.S. enrolled patients for analysis and edited the manuscript. G.A. designed experiments and edited the manuscript. T.R-C. contributed U937-A2 cells. G.L contributed U937-A2 cells. A.S.B. designed experiments and edited the manuscript. J.A.F. designed experiments and edited the manuscript. G.L.G. designed experiments and edited the manuscript. P.M.A designed and conducted experiments and wrote the manuscript.
Support: BGV received salary support through T32 HL007149-37. PMA received salary support through KL2 TR000084 and K08 HL113594-01.
Footnotes
The authors have no relevant financial conflicts of interest.
References
- 1.Chapuis AG, Ragnarsson GB, Nguyen HN, Chaney CN, Pufnock JS, Schmitt TM, et al. Transferred WT1-reactive CD8+ T cells can mediate antileukemic activity and persist in post-transplant patients. Sci Transl Med. 2013;5:174r. doi: 10.1126/scitranslmed.3004916. a27. [DOI] [PMC free article] [PubMed] [Google Scholar]
- 2.Greiner J, Schmitt A, Giannopoulos K, Rojewski MT, Gotz M, Funk I, et al. High-dose RHAMM-R3 peptide vaccination for patients with acute myeloid leukemia, myelodysplastic syndrome and multiple myeloma. Haematologica. 2010;95:1191–7. doi: 10.3324/haematol.2009.014704. [DOI] [PMC free article] [PubMed] [Google Scholar]
- 3.Meij P, Jedema I, van der Hoorn MA, Bongaerts R, Cox L, Wafelman AR, et al. Generation and administration of HA-1-specific T-cell lines for the treatment of patients with relapsed leukemia after allogeneic stem cell transplantation: a pilot study. Haematologica. 2012;97:1205–8. doi: 10.3324/haematol.2011.053371. [DOI] [PMC free article] [PubMed] [Google Scholar]
- 4.Molldrem JJ, Lee PP, Wang C, Felio K, Kantarjian HM, Champlin RE, Davis MM. Evidence that specific T lymphocytes may participate in the elimination of chronic myelogenous leukemia. Nat Med. 2000;6:1018–23. doi: 10.1038/79526. [DOI] [PubMed] [Google Scholar]
- 5.Wang GC, Dash P, McCullers JA, Doherty PC, Thomas PG. T cell receptor alphabeta diversity inversely correlates with pathogen-specific antibody levels in human cytomegalovirus infection. Sci Transl Med. 2012;4:128ra42. doi: 10.1126/scitranslmed.3003647. [DOI] [PMC free article] [PubMed] [Google Scholar]
- 6.Hunt DF, Henderson RA, Shabanowitz J, Sakaguchi K, Michel H, Sevilir N, et al. Characterization of peptides bound to the class I MHC molecule HLA-A2.1 by mass spectrometry. Science. 1992;255:1261–3. doi: 10.1126/science.1546328. [DOI] [PubMed] [Google Scholar]
- 7.Wolfl M, Greenberg PD. Antigen-specific activation and cytokine-facilitated expansion of naive, human CD8+ T cells. Nat Protoc. 2014;9:950–66. doi: 10.1038/nprot.2014.064. [DOI] [PMC free article] [PubMed] [Google Scholar]
- 8.Betts MR, Brenchley JM, Price DA, De Rosa SC, Douek DC, Roederer M, Koup RA. Sensitive and viable identification of antigen-specific CD8+ T cells by a flow cytometric assay for degranulation. J Immunol Methods. 2003;281:65–78. doi: 10.1016/s0022-1759(03)00265-5. [DOI] [PubMed] [Google Scholar]
- 9.Altman JD, Moss PA, Goulder PJ, Barouch DH, McHeyzer-Williams MG, Bell JI, et al. Phenotypic analysis of antigen-specific T lymphocytes. Science. 1996;274:94–6. [PubMed] [Google Scholar]
- 10.Armistead PM, Liang S, Li H, Lu S, Van Bergen CA, Alatrash G, et al. Common minor histocompatibility antigen discovery based upon patient clinical outcomes and genomic data. PLoS One. 2011;6:e23217. doi: 10.1371/journal.pone.0023217. [DOI] [PMC free article] [PubMed] [Google Scholar]
- 11.Zhang M, Sukhumalchandra P, Enyenihi AA, St John LS, Hunsucker SA, Mittendorf EA, et al. A Novel HLA-A*0201 Restricted Peptide Derived from Cathepsin G Is an Effective Immunotherapeutic Target in Acute Myeloid Leukemia. Clin Cancer Res. 2013;19:247–57. doi: 10.1158/1078-0432.CCR-12-2753. [DOI] [PMC free article] [PubMed] [Google Scholar]
- 12.Vincent BG, Young EF, Buntzman AS, Stevens R, Kepler TB, Tisch RM, et al. Toxin-coupled MHC class I tetramers can specifically ablate autoreactive CD8+ T cells and delay diabetes in nonobese diabetic mice. J Immunol. 2010;184:4196–204. doi: 10.4049/jimmunol.0903931. [DOI] [PMC free article] [PubMed] [Google Scholar]
- 13.Volpe JM, Cowell LG, Kepler TB. SoDA: implementation of a 3D alignment algorithm for inference of antigen receptor recombinations. Bioinformatics. 2006;22:438–44. doi: 10.1093/bioinformatics/btk004. [DOI] [PubMed] [Google Scholar]
- 14.Wang C, Sanders CM, Yang Q, Schroeder HW, Jr, Wang E, Babrzadeh F, et al. High throughput sequencing reveals a complex pattern of dynamic interrelationships among human T cell subsets. Proc Natl Acad Sci U S A. 2010;107:1518–23. doi: 10.1073/pnas.0913939107. [DOI] [PMC free article] [PubMed] [Google Scholar]
- 15.Lefranc MP, Giudicelli V, Ginestoux C, Jabado-Michaloud J, Folch G, Bellahcene F, et al. IMGT, the international ImMunoGeneTics information system. Nuc Acids Res. 2009;37(Database issue):D1006–12. doi: 10.1093/nar/gkn838. [DOI] [PMC free article] [PubMed] [Google Scholar]
- 16.Smith TF, Waterman MS. Identification of common molecular subsequences. J Mol Biol. 1981;147:195–7. doi: 10.1016/0022-2836(81)90087-5. [DOI] [PubMed] [Google Scholar]
- 17.Karp JE, Smith BD, Resar LS, Greer JM, Blackford A, Zhao M, et al. Phase 1 and pharmacokinetic study of bolus-infusion flavopiridol followed by cytosine arabinoside and mitoxantrone for acute leukemias. Blood. 2011;117:3302–10. doi: 10.1182/blood-2010-09-310862. [DOI] [PMC free article] [PubMed] [Google Scholar]
- 18.Lin TS, Ruppert AS, Johnson AJ, Fischer B, Heerema NA, Andritsos LA, et al. Phase II study of flavopiridol in relapsed chronic lymphocytic leukemia demonstrating high response rates in genetically high-risk disease. J Clin Oncol. 2009;27:6012–8. doi: 10.1200/JCO.2009.22.6944. [DOI] [PMC free article] [PubMed] [Google Scholar]
- 19.Malumbres M, Barbacid M. Cell cycle, CDKs and cancer: a changing paradigm. Nat Rev Cancer. 2009;9:153–66. doi: 10.1038/nrc2602. [DOI] [PubMed] [Google Scholar]
- 20.Krell PF, Reuther S, Fischer U, Keller T, Weber S, Gombert M, et al. Next-generation-sequencing-spectratyping reveals public T-cell receptor repertoires in pediatric very severe aplastic anemia and identifies a beta chain CDR3 sequence associated with hepatitis-induced pathogenesis. Haematologica. 2013;98:1388–96. doi: 10.3324/haematol.2012.069708. [DOI] [PMC free article] [PubMed] [Google Scholar]
- 21.Liu C, He M, Rooney B, Kepler TB, Chao NJ. Longitudinal analysis of T-cell receptor variable beta chain repertoire in patients with acute graft-versus-host disease after allogeneic stem cell transplantation. Biol Blood Marrow Transplant. 2006;12:335–45. doi: 10.1016/j.bbmt.2005.09.019. [DOI] [PubMed] [Google Scholar]
- 22.van Heijst JW, Ceberio I, Lipuma LB, Samilo DW, Wasilewski GD, Gonzales AM, et al. Quantitative assessment of T cell repertoire recovery after hematopoietic stem cell transplantation. Nat Med. 2013;19:372–7. doi: 10.1038/nm.3100. [DOI] [PMC free article] [PubMed] [Google Scholar]
- 23.Engels B, Engelhard VH, Sidney J, Sette A, Binder DC, Liu RB, et al. Relapse or eradication of cancer is predicted by peptide-major histocompatibility complex affinity. Cancer Cell. 2013;23:516–26. doi: 10.1016/j.ccr.2013.03.018. [DOI] [PMC free article] [PubMed] [Google Scholar]
- 24.Han A, Glanville J, Hansmann L, Davis MM. Linking T-cell receptor sequence to functional phenotype at the single-cell level. Nat Biotechnol. 2014;32:684–92. doi: 10.1038/nbt.2938. [DOI] [PMC free article] [PubMed] [Google Scholar]
- 25.Kim SM, Bhonsle L, Besgen P, Nickel J, Backes A, Held K, et al. Analysis of the paired TCR alpha- and beta-chains of single human T cells. PLoS One. 2012;7:e37338. doi: 10.1371/journal.pone.0037338. [DOI] [PMC free article] [PubMed] [Google Scholar]
Associated Data
This section collects any data citations, data availability statements, or supplementary materials included in this article.