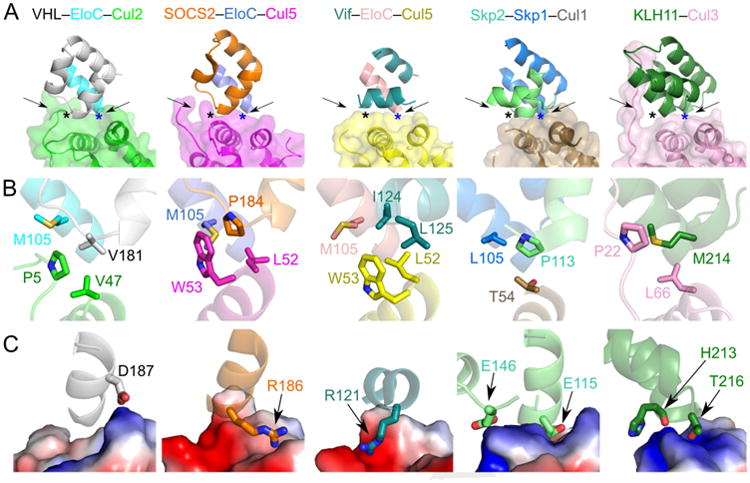
Figure 5. Comparison of the overall CRL architecture and cullin–adaptor protein/substrate receptor interactions.

Residues involved in interactions are shown as sticks. (A) The cullin–adaptor protein/substrate receptor binding regions of VHL–EloC–Cul2, SOCS2–EloC–Cul5 (PDB ID: 4JGH), Vif–EloC–Cul5 (PDB ID: 4N9F), Skp2–Skp1–Cul1 (PDB ID: 1LDK), and KLH11–Cul3 (PDB ID: 4AP2) in ribbon representations with semi-transparent surface shown for the cullins. Proteins are colored as in the label above each panel. (B) Conserved interactions of the three-protein interface involving adaptor protein–substrate receptor–helix α2 of cullin. Each region is marked in A) with a black asterisk and with the point of view pointed out by the left arrow. (C) Charge complementary at the binary cullin–substrate receptor interface. Cullins are shown as electrostatic surfaces. Each region is marked in A) with a blue asterisk and with the point of view pointed out by the right arrow.
